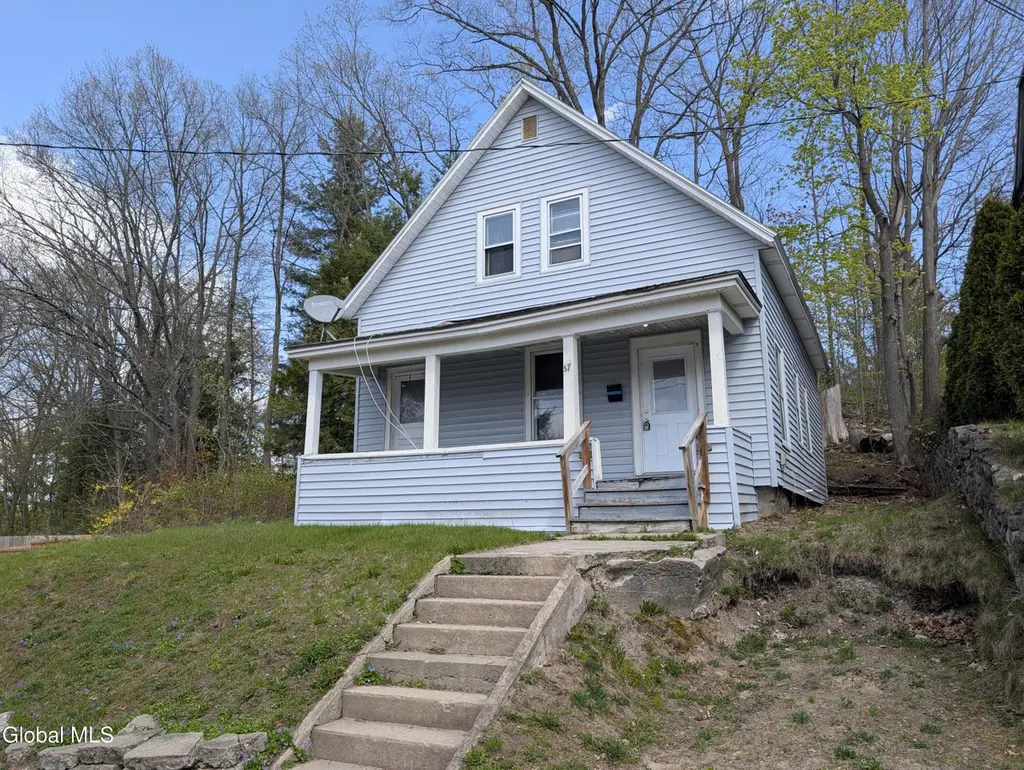
67 Montgomery St · Gloversville, NY
Flood risk 1/10 · Minimal
- FEMA flood zone
- X
- Chance of flooding over 30 yrs
- 0.0%
- Est. flood insurance / yr
- $473 – $860
Fire risk 1/10 · Minimal
- Est. fire insurance / yr
- $691 – $1,283
Heat risk 2/10 · Minimal
- Hot days now (above 93°F)
- 7 days/yr
- Hot days in 30 yrs
- 17 days/yr
Wind risk 2/10 · Minimal
- Chance of severe wind over 30 yrs
- 3.0%
Air-quality risk 1/10 · Minimal
- Unhealthy air days now
- 0 days/yr
- Unhealthy air days in 30 yrs
- 0 days/yr
Risk factors via First Street. Map © Google.
Why this score? — see what drove the A grade
The composite is a weighted blend of 9 inputs, each scored 0–100. Each bar is that input's sub-score; the figure is the points it added to the 100-point composite (weight × sub-score).
- Cash flow +30.0/30.0
- ARV discount +15.0/15.0
- 1% rule +10.0/10.0
- DSCR +10.0/10.0
- Appreciation +10.0/10.0
- Livability +4.1/5.0
- Schools +2.8/10.0
- Rent growth +2.5/5.0
- Condition / age +2.5/5.0
$80,000
🖨 Deal sheet 📄 Offer letter ✓ Due diligence
Listing remarks
Welcome to 67 Montgomery St. This property offers a solid opportunity for investors or buyers looking to add value over time. The home features good natural light on the first floor, a functional layout, and a first floor bedroom for added flexibility. A covered front porch adds usable outdoor space, while the overall property provides a strong foundation for cosmetic updates and improvements without major renovation needs. Whether you are looking for a rental property or a home to make your own, this property has potential in a convenient location. House needs an upstairs bathroom, but conventional financing not out of the question.
Key facts
- Covered front porch
- Strong foundation
- Natural light
Tags
Property features AI
Exterior
- Parking: Driveway with space for 1 vehicle
- Utilities: 100 amp electric service; Public water; Public sewer
- Home design: Single family residence; Living area approximately 1,496
- Construction: Vinyl siding; Built with conventional foundation
- Exterior features: Shingle roof; Steep slope lot
Interior
- Kitchen: Range
- Bedrooms: One bedroom on the first floor; Two bedrooms on the second floor
- Flooring: Laminate flooring; Linoleum flooring
- Bathrooms: Two full bathrooms (one on the first floor, one on the second floor)
- Heating & cooling: Forced air heating; Natural gas heating
- Interior features: Seven total rooms; Full unfinished basement
- Laundry & utility: Laundry in basement
Neighborhood map
What this means for you Summary
Snapshot
- This is a 3-bed/2.0-bath single-family listed at $80k.
Deal economics
- At list price, monthly cash flow is $678 ($8k/yr) — positive.
- The deal already cash-flows at list — no discount required.
- Meets the 1% rule at list price ($2k rent vs $80k).
- Recommended offer: $78k (3.0% below list) — sets the bar for market timing.
Location & tenants
- Location reads 82/100 on livability (#70 in NY, #1,048 nationally) — a professional / high-income tenant draw. Strengths: amenities A+, commute A+, cost of living A+; Watch: employment F.
- Gloversville City School District (town): math 26% / reading 42% proficiency, ranked #565 of 590 in NY (top 96%) — families likely to look elsewhere, expect single-tenant / working-renter base with shorter leases.
- Zoned schools: Gloversville High School (math 82% / reading 77%, grade A-, #518 of 1,100 statewide, top 51%, 697 students, 71% FRL) — zoned schools average 71% FRL vs 54% district-wide (17 pts higher); higher-poverty schools than district average — tighter screening recommended.
- Zoned-school proficiency averages 80% at this address vs 34% district-wide (+46 pts) — the actual schools serving this property are materially stronger than the Gloversville City School District average implies; a family-tenant draw the district grade alone would hide.
- Market conditions: 165 active listings in the ZIP; 1 comparable units currently listed for rent nearby; 112 units permitted in Fulton County in 2024 (50 in 5+ unit buildings).
Forward outlook
- In year one you build about $9k of equity ($553 loan paydown + $8k appreciation (10.0% local appreciation)).
- Fulton County population projected at -23% by 2050 — secular population decline; favor cash flow + early exit over multi-decade hold.
- At projected returns (10.0% appreciation + 3.0% rent growth), your $22k cash investment doubles in ~2 years — after that, you're playing with house money.
- By year 4, paydown + projected appreciation supports a ~$30k cash-out refi (75% LTV) — recoverable capital for the next deal without selling this one.
Negotiation context
- It's been on market 42 days — a 3% lower offer ($78k) is reasonable based on typical stale-listing flexibility.
- 7 sale attempts since 10y ago; this cycle's ask has dropped $5k (6%) from the opening price — seller is motivated, your offer sets the floor, not the list.
- Current owner paid $55k; 45% above their basis — modest negotiation headroom, anchor on the comps not their cost.
Risks & watch-outs
- Watch-outs: property tax is 2.6% of price; built in 1900 — expect roof / HVAC / electrical / plumbing capex.
Questions for the listing agent
- It's been on market 42 days. Have you received any prior offers? Is the seller open to a 3% concession, seller financing, or rate buy-down credit?
- Built in 1900 — when were the roof, HVAC, electrical panel, plumbing, and water heater last replaced?
- Property tax is high relative to price — has the assessment been appealed recently, and will the sale trigger a re-assessment?
- Is there a deadline driving the sale (1031 exchange, divorce, estate, relocation)? That informs how much negotiation room exists.
- Schools are D-rated, which usually means shorter tenancies and higher turnover. Who's the typical renter profile here, and what's been the actual vacancy rate?
- What's the average days-on-market for RENTAL listings here right now (not sales)? A rising rental-DOM trend means longer vacancies and softer asking-rent achievability than the comps imply.
- What's the recent tenant-quality profile in this submarket — average credit score on applications, eviction rate, late-payment / NSF rate, and stable-employment percentage? A property-management company in the area should have these aggregated.
- How much new for-sale + rental construction is in the pipeline within 1–3 miles? Heavy new supply typically softens prices + rents 12–24 months out; constrained supply supports both.
Investment metrics
- 1% rule
- 2.06% ✓
- Cap rate
- 16.46%
- Cash-on-cash
- 36.31%
- DSCR
- 2.62
- GRM
- 4.0
CMA / ARV
- ARV (median comp)
- $124,707
- List price
- $80,000
- Delta
- -35.85%
- Verdict
- UNDERPRICED
- Comps
- 20 within 1.0 mi
Show comp detail 12 sales within ~0.75 mi
| Address | Dist | Beds/Ba | Sqft | Sold | Price | $/sf | Match |
|---|---|---|---|---|---|---|---|
| 98 S Kingsboro Ave | 0.25mi | 3/2.0 | 1,579 (+6%) | 7mo | $195,000 | $123 | 73 |
| 135 Wells St | 0.27mi | 3/1.0 | 1,472 (-2%) | 10mo | $171,500 | $117 | 73 |
| 34 Division St | 0.18mi | 3/1.0 | 1,585 (+6%) | 8mo | $82,000 | $52 | 71 |
| 30 Saratoga Blvd | 0.68mi | 3/1.5 | 1,472 (-2%) | 1mo | $200,000 | $136 | 63 |
| 12 Monroe St | 0.56mi | 3/2.5 | 1,528 (+2%) | 8mo | $170,000 | $111 | 62 |
| 33 Monroe St | 0.55mi | 3/1.5 | 1,536 (+3%) | 10mo | $190,000 | $124 | 60 |
| 72 Park St | 0.26mi | 3/1.5 | 1,272 (-15%) | 4mo | $131,000 | $103 | 58 |
| 35 Spruce St | 0.59mi | 2/2.0 (-1) | 1,556 (+4%) | 6mo | $175,000 | $112 | 55 |
| 36 Maple St | 0.34mi | 4/1.5 (+1) | 1,710 (+14%) | 7mo | $100,000 | $58 | 48 |
| 60 Broad St | 0.56mi | 2/1.0 (-1) | 1,596 (+7%) | 8mo | $15,000 | $9 | 47 |
| 7 N Mcnab Ave | 0.71mi | 3/1.0 | 1,434 (-4%) | 11mo | $160,000 | $112 | 47 |
| 233 E Fulton St | 0.64mi | 4/1.5 (+1) | 1,692 (+13%) | 10mo | $205,000 | $121 | 33 |
Match score weights: distance 35% · size 25% · config 20% · recency 20%. Top-matched comps best support the ARV.
Projected returns pro-forma
10.0% appreciation · 3.0% rent growth · sell at horizon
- IRR
- 52.2%
- Equity multiple
- 4.88×
- Total profit
- $86,806
- Equity at exit
- $72,070
- IRR
- 45.8%
- Equity multiple
- 10.90×
- Total profit
- $221,822
- Equity at exit
- $155,422
Cash invested: $22,400 (down + closing). Projections, not guarantees.
Landlord ↔ Tenant lean methodology
- Overall (STATE)
- 15 Strongly Tenant-Friendly
- State New York
- 15 Strongly Tenant-Friendly · D+10
- County
- — inherits STATE
- City
- — inherits STATE
ZIP-level market 12078
- Home prices YoY
- 12.2%
- Active inventory
- 165
- Price-to-rent
- 4.0×
Monthly cashflow live
- Estimated rent
- $1,650 medium interval (Pro) →
- Mortgage (P&I)
- −$420
- Tax from tax record
- −$173 /mo · $2,075/yr
- Insurance
- −$33
- HOA
- −$0
- Vacancy / Maint / Mgmt
- −$346
- Net cashflow
- $678
Break-even live
UW: 25.0% down · 7.5% · 30yr · 1.5% tax · 5.0% vac · 8.0% maint · 8.0% mgmt
Financing live
Cash to close
- Down payment
- $20,000
- Closing costs
- $2,400
- Reserves months
- —
- Total cash needed
- —
Loan-product check · same deal, 3 products live
Conventional
25% down · 7.5% · 30yr
- Down + closing
- —
- Monthly P&I
- —
- Monthly cashflow
- —
- DSCR
- —
- Eligible?
- —
Personal DTI + credit; lowest rate.
DSCR
20% down · 8.5% · 30yr
- Down + closing
- —
- Monthly P&I
- —
- Monthly cashflow
- —
- DSCR
- —
- Eligible?
- —
No personal income docs; deal must DSCR.
Hard money
10% down · 12.0% · 12mo
- Down + closing
- —
- Monthly P&I
- —
- Monthly cashflow
- —
- DSCR
- —
- Eligible?
- —
Short-term bridge; refi at stabilization.
Rent comps 1 comps
| Address | Beds | Baths | Sqft | Rent | $/sqft | DOM | Units | Dist |
|---|---|---|---|---|---|---|---|---|
| 11 Fremont St Gloversville, NY | 2.0–3.0 | 1.5–2.0 | 1612 | $1,650 | $1.02 | 43d | 3 | 0.45mi |
Listing history 38 events
-
2026-06-18days on market $80,000 Active 42 DOM
-
2026-06-17days on market $80,000 Active 41 DOM
-
2026-06-16days on market $80,000 Active 40 DOM
-
2026-06-15days on market $80,000 Active 39 DOM
-
2026-06-13days on market $80,000 Active 37 DOM
-
2026-06-12days on market $80,000 Active 36 DOM
-
2026-06-09days on market $80,000 Active 33 DOM
-
2026-06-08days on market $80,000 Active 32 DOM
-
2026-06-07days on market $80,000 Active 31 DOM
-
2026-06-07days on market $80,000 Active 30 DOM
-
2026-06-04pricedays on market $80,000 Active 27 DOM
-
2026-06-02days on market $84,000 Active 26 DOM
-
2026-06-01days on market $84,000 Active 25 DOM
-
2026-05-31days on market $84,000 Active 24 DOM
-
2026-05-07$85,000 Active 561-char remark
-
2026-03-26$95,000 Active
-
2026-03-26historical
-
2025-12-03price $97,500
-
2025-09-25price $99,400
-
2025-06-10$99,900 Active
-
2025-01-17soldstatus $55,000
-
2024-12-03soldstatus $55,000 Closed
-
2024-07-01status Pending
-
2024-06-20$60,000 Active
-
2024-06-10historical
-
2024-04-29price $49,900
-
2024-04-25price $54,900
-
2024-04-11$69,900 Active
-
2021-07-30soldstatus $46,900 Closed (Final Sale)
-
2021-07-21soldstatus $46,900
-
2021-07-07status Pend (Under Cntr)
-
2021-06-25price $46,900
-
2021-06-21$51,900 New
-
2017-05-23soldstatus $15,000 Closed (Final Sale)
-
2017-05-19soldstatus $15,000
-
2017-04-11status Pend (Under Cntr)
-
2016-09-16price $29,500
-
2016-01-27$37,000 New
ⓘ Source: listings_history table (triggers on properties + properties_extension) + one-shot
backfill from property_details.listing_events for pre-trigger history.
Tax reassessment forecast NY · Partial reset (capped growth)
- Current annual tax
- $2,075 · $173/mo
- Projected year-2 tax
- $2,075 · $173/mo
- Expected delta
- $0/yr ($0/mo · 0.0%)
ⓘ Screening estimate from a state-policy table — verify with the county assessor before closing.
Climate risk First Street
- Flood 1/10 Low FEMA zone X · 0% chance over 30 yrs
- Wildfire 1/10 Low
- Heat 2/10 Low 7 d/yr ≥93°F today · 17 d/yr by 30 yrs out
- Wind 2/10 Low 3% chance of damaging wind over 30 yrs
- Air quality 1/10 Low 0 unhealthy d/yr today · 0 by 30 yrs out
Nearby sold comps map
Loading sold comps map…
Walkable amenities ~0.75 mi
Loading nearby amenities…
Taxation est. · year 1
- Rental income
- $19,800
- − Mortgage interest
- −$4,481
- − Property taxes
- −$2,075
- − Insurance
- −$400
- − Repairs & maintenance
- −$1,584
- − Management
- −$1,584
- − Depreciation
- −$2,327
- Taxable income
- $7,349
- Est. tax owed @ 24.0%
- −$1,764
- After-tax cash flow
- $6,369/yr
For passive investors: Depreciation is non-cash, so a rental often shows a tax loss while cash-flowing — sheltering income. Rental losses are passive: they offset passive income freely, and up to $25,000/yr can offset ordinary (W-2) income if you actively participate and your MAGI is under $100k (phasing out to $0 by $150k); unused losses carry forward. On sale, claimed depreciation is recaptured at up to 25%, and gains may owe capital-gains tax (a 1031 exchange can defer both). Figures are a year-1 estimate at your 24.0% rate — not tax advice; consult a CPA.
Schools (NCES district)
- District
- Gloversville City School District
- NCES district ID
- 3612270
- Math proficiency
- 26% ▼ -6.00%
- Reading proficiency
- 42% ▲ 7.00%
- Median HH income
- $36,775
- Composite
- 28.2/100
- National rank
- #6806
- State rank
- #565 of 590 in NY
Livability — Gloversville
- Score
- 82/100
- State rank
- #70
- US rank
- #1048
Category grades
Schools grade is shown separately in the Schools card above.
Census & demographics
- Census place
- Gloversville, NY
- Population (ZIP)
- 23,087
Population outlook (Fulton County) Hauer SSP2
- Today (2025)
- 51,132 people
- By 2030
- 49,114 · -3.9%
- By 2040
- 44,373 · -13.2%
- By 2050
- 39,321 · -23.1%
- By 2075
- 28,503 · -44.3%
- By 2100
- 19,268 · -62.3%
Race, ethnicity, and origin ACS 2023
- Neighborhood character
- Predominantly White (86%)
- Race & ethnicity
- White 86% Two or more races 8% Hispanic / Latino 5% Black 2% Asian 1%
- Hispanic origin (detail)
- Puerto Rican 3%
- Common ancestry
- Lithuanian 5% Romanian 4% Iranian 4%
- Foreign-born
- 2% · Canada, China
- Languages at home
- 97% English-only · Spanish 2%
Political lean MEDSL · Fulton
- 2024 margin
- Solid R (+35.9) · D 32.1% · R 67.9%
- 2008→2024 swing
- -26.6pp toward R · 2008: -9.2pp · 2024: -35.9pp
- All cycles
- 2024: R+35.9 2020: R+31.4 2016: R+35.5 2012: R+10.5 2008: R+9.2
Not yet ingested
- Civics
- —
Market trends
- HPI YoY
- ▲ 34.22%
- Current HPI
- 315.1368
- Rent YoY
- —
- Metro
- —
- State GDP YoY
- ▲ 2.60%
- F500 in state
- 92
Industry mix (Fortune 500 HQ in NY)
| Industry | F500 HQs | Revenue |
|---|---|---|
| Financial Services | 10 | $950B |
|
||
| Consumer Goods | 9 | $162B |
|
||
| Insurance | 4 | $225B |
|
||
| Telecommunications | 2 | $144B |
|
||
| Pharmaceuticals | 2 | $112B |
|
||
| Media / Entertainment | 2 | $69B |
|
||
Price history
+116.2% since first listed28 events — show timeline
- 2026-06-03 Price Changed $80,000 Global MLS
- 2026-05-29 Price Changed $84,000 Global MLS
- 2026-05-26 Listing Removed — CNYIS
- 2026-05-07 Listed $85,000 Global MLS
- 2026-03-27 Listing Removed — CNYIS
- 2026-03-26 Listing Removed — CNYIS
- 2026-03-26 Listed $95,000 CNYIS
- 2025-12-03 Price Changed $97,500 CNYIS
- 2025-09-25 Price Changed $99,400 CNYIS
- 2025-06-10 Listed $99,900 CNYIS
- 2025-01-17 Sold (Public Records) $55,000 Public Records
- 2024-12-03 Sold (MLS) $55,000 Global MLS
- 2024-07-01 Pending — Global MLS
- 2024-06-20 Listed $60,000 Global MLS
- 2024-06-10 Listing Removed — Global MLS
- 2024-04-29 Price Changed $49,900 Global MLS
- 2024-04-25 Price Changed $54,900 Global MLS
- 2024-04-11 Listed $69,900 Global MLS
- 2021-07-30 Sold (MLS) $46,900 Global MLS
- 2021-07-21 Sold (Public Records) $46,900 Public Records
- 2021-07-07 Pending — Global MLS
- 2021-06-25 Price Changed $46,900 Global MLS
- 2021-06-21 Listed $51,900 Global MLS
- 2017-05-23 Sold (MLS) $15,000 Global MLS
- 2017-05-19 Sold (Public Records) $15,000 Public Records
- 2017-04-11 Pending — Global MLS
- 2016-09-16 Price Changed $29,500 Global MLS
- 2016-01-27 Listed $37,000 Global MLS
Property tax history
+20.2%/yrLatest (2025): $2,075 · +5.4% YoY. Source: county tax records.
Cash-flow waterfall
monthlySold comps — $/sqft
last 12 mo · ≤1 miLoading sold comps…