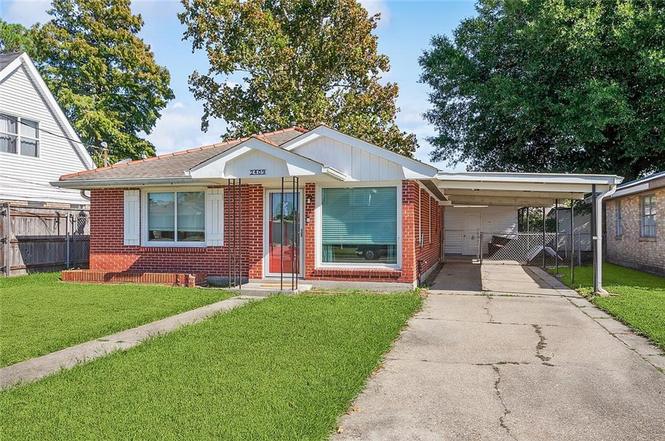
2409 Corinne Dr · Chalmette, LA
Flood risk No data
- FEMA flood zone
- —
- Chance of flooding over 30 yrs
- %
- Est. flood insurance / yr
- —
Fire risk No data
- Est. fire insurance / yr
- —
Heat risk No data
- Hot days now (above °F)
- days/yr
- Hot days in 30 yrs
- days/yr
Wind risk No data
- Chance of severe wind over 30 yrs
- %
Air-quality risk No data
- Unhealthy air days now
- days/yr
- Unhealthy air days in 30 yrs
- days/yr
Risk factors via First Street. Map © Google.
Why this score? — see what drove the D- grade
The composite is a weighted blend of 9 inputs, each scored 0–100. Each bar is that input's sub-score; the figure is the points it added to the 100-point composite (weight × sub-score).
- Cash flow +12.0/30.0
- Schools +5.0/10.0
- ARV discount +4.6/15.0
- DSCR +3.5/10.0
- 1% rule +3.4/10.0
- Rent growth +3.3/5.0
- Livability +3.2/5.0
- Condition / age +2.5/5.0
- Appreciation +0.0/10.0
$185,000
🖨 Deal sheet 📄 Offer letter ✓ Due diligence
Listing remarks
Cute brick ranch home in quiet Chalmette neighborhood! Pristine clean interiors with huge plate-glass front window, plank floors, new fans, fresh dovecote paint. Den and dining include a flow-through service window to an updated kitchen with custom cabinets, granite-look counters and matching appliances. Sunny bedrooms and bath with granite vanity and shower insert. Lots of extras: gated parking, carport storage, backyard shed & loads of lush lawn, fenced in for pets and entertaining. Just blocks from Judge Perez and only 20 min from city center and Nola's finest cafes, bars and businesses. Great value!
Key facts
- Plank floors
- Custom cabinets
- Brick ranch home
Tags
Neighborhood map
What this means for you Summary
Snapshot
- This is a 3-bed/1.0-bath single-family listed at $185k.
Deal economics
- At list price, monthly cash flow is $-44 ($-534/yr) — negative.
- To cash-flow at today's rent, offer at most $179k (3.5% below list).
- To meet the 1% rule (rent ≥ 1% of price), the offer needs to be $156k (15.6% below list).
- Recommended offer: $156k (15.6% below list) — sets the bar for 1% rule.
Location & tenants
- Location reads 65/100 on livability (#137 in LA) — a middle-class / working-renter tenant base. Strengths: cost of living A+, housing A+, health & safety A; Watch: crime F, amenities F, commute F.
- Market conditions: Rents rising (+3.1%/yr); 209 active listings in the ZIP; 32 comparable units currently listed for rent nearby; rentals at typical pace (median 21d on market — plan ~3-4 weeks tenant-placement turnaround); 112 units permitted in St. Bernard Parish in 2024 (0 in 5+ unit buildings).
- This rent runs 34% of the median local income ($55k/yr) — at the standard rent-burdened threshold; future hikes will face affordability resistance.
Forward outlook
- Local home prices are declining (-3.0%/yr); year-one equity from $1k of loan paydown is wiped out by about $6k of value loss. Plan a longer hold.
- St. Bernard County population projected at +89% by 2050 — long-run rental-demand tailwind backs the buy-and-hold thesis.
Negotiation context
- It's been on market 188 days — a 12% lower offer ($163k) is reasonable based on typical stale-listing flexibility.
Questions for the listing agent
- What do current leases actually rent for vs. the listed asking? Can we see a recent rent roll and the last 12 months of T-12 income?
- It's been on market 188 days. Have you received any prior offers? Is the seller open to a 16% concession, seller financing, or rate buy-down credit?
- Why hasn't it sold? Are there any deal-killer items the seller is aware of (foundation, flood, title, zoning, code violations)?
- Is there a deadline driving the sale (1031 exchange, divorce, estate, relocation)? That informs how much negotiation room exists.
- Crime grade is F in this area — have there been break-ins, vandalism, or insurance claims at this property in the last 3 years? What carrier currently insures it and at what premium?
- The area grade is low — what's the realistic commute time and amenity access for the typical tenant pool here? Any planned neighborhood developments (good or bad) we should know about?
- What's the average days-on-market for RENTAL listings here right now (not sales)? A rising rental-DOM trend means longer vacancies and softer asking-rent achievability than the comps imply.
- What's the recent tenant-quality profile in this submarket — average credit score on applications, eviction rate, late-payment / NSF rate, and stable-employment percentage? A property-management company in the area should have these aggregated.
- How much new for-sale + rental construction is in the pipeline within 1–3 miles? Heavy new supply typically softens prices + rents 12–24 months out; constrained supply supports both.
Investment metrics
- 1% rule
- 0.84% ✗
- Cap rate
- 6.00%
- Cash-on-cash
- -1.03%
- DSCR
- 0.95
- GRM
- 9.9
CMA / ARV
- ARV (on-the-fly)
- $173,883
- Comps found
- 12
Show comp detail 12 sales within ~0.75 mi
| Address | Dist | Beds/Ba | Sqft | Sold | Price | $/sf | Match |
|---|---|---|---|---|---|---|---|
| 2338 Corinne Dr | 0.05mi | 2/1.0 (-1) | 1,099 (-6%) | 0mo | $159,000 | $145 | 82 |
| 2517 Mumphrey Rd | 0.11mi | 3/2.0 | 1,100 (-6%) | 7mo | $192,000 | $175 | 76 |
| 2200 Volpe Dr | 0.39mi | 3/1.5 | 1,056 (-10%) | 1mo | $157,000 | $149 | 63 |
| 2700 Plaza Dr | 0.61mi | 3/2.0 | 1,192 (+2%) | 2mo | $199,000 | $167 | 62 |
| 2709 Riverland Dr | 0.31mi | 3/1.5 | 1,045 (-10%) | 6mo | $185,000 | $177 | 61 |
| 2309 Plaza Dr | 0.62mi | 2/1.0 (-1) | 1,162 (-0%) | 6mo | $152,900 | $132 | 60 |
| 2713 Dauterive Dr | 0.57mi | 3/2.0 | 1,215 (+4%) | 10mo | $199,900 | $165 | 55 |
| 2901 Blanchard Dr | 0.39mi | 3/2.0 | 1,339 (+15%) | 3mo | $195,000 | $146 | 51 |
| 3020 Decomine Dr | 0.63mi | 3/2.0 | 1,230 (+5%) | 9mo | $170,000 | $138 | 50 |
| 2120 Veronica Dr | 0.57mi | 3/2.0 | 1,274 (+9%) | 10mo | $165,000 | $130 | 45 |
| 3417 Volpe Dr | 0.74mi | 3/2.0 | 1,300 (+11%) | 2mo | $210,000 | $162 | 41 |
| 3317 Decomine Dr | 0.72mi | 3/2.0 | 1,300 (+11%) | 7mo | $175,000 | $135 | 37 |
Match score weights: distance 35% · size 25% · config 20% · recency 20%. Top-matched comps best support the ARV.
Projected returns pro-forma
-3.0% appreciation · 3.11% rent growth · sell at horizon
- IRR
- -17.9%
- Equity multiple
- 0.37×
- Total profit
- $-32,615
- Equity at exit
- $27,584
- IRR
- -9.8%
- Equity multiple
- 0.40×
- Total profit
- $-31,243
- Equity at exit
- $15,995
Cash invested: $51,800 (down + closing). Projections, not guarantees.
Landlord ↔ Tenant lean methodology
- Overall (STATE)
- 90 Strongly Landlord-Friendly
- State Louisiana
- 90 Strongly Landlord-Friendly · R+12
- County
- — inherits STATE
- City
- — inherits STATE
ZIP-level market 70043
- Rents YoY
- 3.1%
- Active inventory
- 209
- Price-to-rent
- 9.9×
Monthly cashflow live
- Estimated rent
- $1,562 high interval (Pro) →
- Mortgage (P&I)
- −$970
- Tax est. 1.5%
- −$231 /mo · $2,775/yr
- Insurance
- −$77
- HOA
- −$0
- Vacancy / Maint / Mgmt
- −$328
- Net cashflow
- $-44
Break-even live
UW: 25.0% down · 7.5% · 30yr · 1.5% tax · 5.0% vac · 8.0% maint · 8.0% mgmt
Financing live
Cash to close
- Down payment
- $46,250
- Closing costs
- $5,550
- Reserves months
- —
- Total cash needed
- —
Loan-product check · same deal, 3 products live
Conventional
25% down · 7.5% · 30yr
- Down + closing
- —
- Monthly P&I
- —
- Monthly cashflow
- —
- DSCR
- —
- Eligible?
- —
Personal DTI + credit; lowest rate.
DSCR
20% down · 8.5% · 30yr
- Down + closing
- —
- Monthly P&I
- —
- Monthly cashflow
- —
- DSCR
- —
- Eligible?
- —
No personal income docs; deal must DSCR.
Hard money
10% down · 12.0% · 12mo
- Down + closing
- —
- Monthly P&I
- —
- Monthly cashflow
- —
- DSCR
- —
- Eligible?
- —
Short-term bridge; refi at stabilization.
Rent comps 32 comps
| Address | Beds | Baths | Sqft | Rent | $/sqft | DOM | Units | Dist |
|---|---|---|---|---|---|---|---|---|
| 2514 Chalona Dr Chalmette, LA | 2.0 | 1.0 | 828 | $1,400 | $1.69 | 21d | 1 | 0.17mi |
| 2602 Chalona Dr Unit C Chalmette, LA | 2.0 | 1.5 | 900 | $1,200 | $1.33 | 3d | 1 | 0.19mi |
| 2228 Riverland Dr Chalmette, LA | 3.0 | 1.0 | 1300 | $1,800 | $1.38 | 2d | 1 | 0.35mi |
| 2431 Octavia Dr Chalmette, LA | 3.0 | 2.0 | 1100 | $1,499 | $1.36 | 43d | 1 | 0.47mi |
| 2335 Plaza Dr Chalmette, LA | 2.0 | 1.0 | 765 | $1,300 | $1.70 | 43d | 1 | 0.59mi |
| 2337 Plaza Dr Chalmette, LA | 3.0 | 2.0 | 925 | $1,500 | $1.62 | 43d | 1 | 0.59mi |
| 2319 Plaza Dr Chalmette, LA | 2.0 | 1.0 | 1000 | $1,200 | $1.20 | 3d | 1 | 0.60mi |
| 2329 Lyndell Dr Chalmette, LA | 2.0 | 1.0 | 1265 | $1,400 | $1.11 | 43d | 1 | 0.65mi |
| 3321 Plaza Dr Chalmette, LA | 3.0 | 2.0 | 1400 | $1,650 | $1.18 | 10d | 1 | 0.76mi |
| 3209 Golden Dr Unit C Chalmette, LA | 2.0 | 1.5 | 950 | $1,200 | $1.26 | 16d | 1 | 0.83mi |
| 321 Rosemary Pl Chalmette, LA | 2.0 | 2.0 | 1000 | $1,550 | $1.55 | 2d | 1 | 0.87mi |
| 3305 Golden Dr Unit D Chalmette, LA | 2.0 | 1.5 | 1100 | $1,200 | $1.09 | 16d | 1 | 0.88mi |
| 3629 Charles Dr Chalmette, LA | 3.0 | 2.0 | 1405 | $1,600 | $1.14 | 14d | 1 | 0.89mi |
| 2012 E Beauregard St Chalmette, LA | 2.0 | 1.0 | 749 | $1,500 | $2.00 | 43d | 1 | 0.90mi |
| 2029 W Beauregard St Chalmette, LA | 3.0 | 2.0 | 1176 | $2,200 | $1.87 | 17d | 1 | 0.91mi |
| 3329 Golden Dr Unit A Chalmette, LA | 2.0 | 1.5 | 1200 | $1,200 | $1.00 | 43d | 1 | 0.92mi |
| 3106 Laplace St Chalmette, LA | 3.0 | 2.5 | 1390 | $1,650 | $1.19 | 43d | 1 | 0.95mi |
| 226 E Casa Calvo St Chalmette, LA | 3.0 | 2.0 | 1330 | $1,900 | $1.43 | 43d | 1 | 0.96mi |
| 3108 Laplace St Chalmette, LA | 3.0 | 2.5 | 1390 | $1,650 | $1.19 | 43d | 1 | 0.96mi |
| 2709 Munster Blvd Meraux, LA | 3.0 | 2.0 | 1411 | $1,900 | $1.35 | 23d | 1 | 1.00mi |
| 203 E Moreau St Chalmette, LA | 3.0 | 1.5 | 965 | $1,700 | $1.76 | 3d | 1 | 1.00mi |
| 3513 Golden Dr Chalmette, LA | 2.0 | 2.0 | 1000 | $1,200 | $1.20 | 43d | 1 | 1.00mi |
| 3108 Tournefort St Chalmette, LA | 3.0 | 2.0 | 1399 | $1,750 | $1.25 | 3d | 1 | 1.02mi |
| 3316 Laplace St Chalmette, LA | 2.0 | 1.0 | 850 | $1,200 | $1.41 | 43d | 1 | 1.04mi |
| 511 E Genie St Chalmette, LA | 3.0 | 2.0 | 1100 | $1,500 | $1.36 | 2d | 1 | 1.08mi |
| 2107 Montesquieu St Chalmette, LA | 2.0 | 1.0 | 1150 | $1,199 | $1.04 | 21d | 1 | 1.14mi |
| 222 W Morales St Unit C Chalmette, LA | 2.0 | 1.0 | 850 | $1,100 | $1.29 | 23d | 1 | 1.16mi |
| 3612 Laplace St Chalmette, LA | 2.0 | 1.5 | 1090 | $1,300 | $1.19 | 17d | 1 | 1.17mi |
| 406 Dubarry Pl Chalmette, LA | 3.0 | 2.0 | 950 | $1,550 | $1.63 | 43d | 1 | 1.20mi |
| 3711 Tournefort St Chalmette, LA | 3.0 | 2.0 | 1250 | $1,850 | $1.48 | 3d | 1 | 1.26mi |
| 3400 Montesquieu St Unit 1-B Chalmette, LA | 3.0 | 2.5 | 1372 | $2,550 | $1.86 | 1d | 1 | 1.29mi |
| 2004 Webster St Meraux, LA | 3.0 | 2.0 | 1400 | $1,750 | $1.25 | 17d | 1 | 1.46mi |
Listing history 2 events
-
2026-06-18remarks 612-char remark
-
2026-06-18$185,000 Active 188 DOM
ⓘ Source: listings_history table (triggers on properties + properties_extension) + one-shot
backfill from property_details.listing_events for pre-trigger history.
Nearby sold comps map
Loading sold comps map…
Walkable amenities ~0.75 mi
Loading nearby amenities…
Taxation est. · year 1
- Rental income
- $18,744
- − Mortgage interest
- −$10,363
- − Property taxes
- −$2,775
- − Insurance
- −$925
- − Repairs & maintenance
- −$1,500
- − Management
- −$1,500
- − Depreciation
- −$5,382
- Taxable loss
- −$3,700
- Est. tax savings @ 24.0%
- +$888
- After-tax cash flow
- $354/yr
For passive investors: Depreciation is non-cash, so a rental often shows a tax loss while cash-flowing — sheltering income. Rental losses are passive: they offset passive income freely, and up to $25,000/yr can offset ordinary (W-2) income if you actively participate and your MAGI is under $100k (phasing out to $0 by $150k); unused losses carry forward. On sale, claimed depreciation is recaptured at up to 25%, and gains may owe capital-gains tax (a 1031 exchange can defer both). Figures are a year-1 estimate at your 24.0% rate — not tax advice; consult a CPA.
Schools (NCES district)
No district data.
Livability — Chalmette
- Score
- 65/100
- State rank
- #137
- US rank
- #12500
Category grades
Schools grade is shown separately in the Schools card above.
Census & demographics
- Census place
- Chalmette, LA
- County
- Saint Bernard Parish · 22,638 people
- City population
- 22,638
- Metro
- New Orleans-Metairie, LA
- Population (ZIP)
- 22,638
- Household income
- $55,068
- Rent vs Own
- Severe rent burden
- 881.0
Population outlook (St. Bernard County) Hauer SSP2
- Today (2025)
- 66,513 people
- By 2030
- 77,768 · +16.9%
- By 2040
- 101,296 · +52.3%
- By 2050
- 125,770 · +89.1%
- By 2075
- 188,160 · +182.9%
- By 2100
- 239,339 · +259.8%
Race, ethnicity, and origin ACS 2023
- Neighborhood character
- Diverse neighborhood (Simpson 0.61)
- Race & ethnicity
- White 55% Black 26% Hispanic / Latino 12% Two or more races 10% Asian 2%
- Hispanic origin (detail)
- Mexican 2%
- Common ancestry
- Lithuanian 13% Slovak 2%
- Foreign-born
- 6% · Canada, Vietnam
- Languages at home
- 88% English-only · Spanish 8% Arabic 1% Vietnamese 1%
Political lean MEDSL · St. Bernard
- 2024 margin
- Strong R (+29.3) · D 34.5% · R 63.8% · Other 1.7%
- 2008→2024 swing
- +16.1pp toward D · 2008: -45.4pp · 2024: -29.3pp
- All cycles
- 2024: R+29.3 2020: R+28.5 2016: R+33.4 2012: R+24.7 2008: R+45.4
Not yet ingested
- Civics
- —
Market trends
- HPI YoY
- ▼ -211.77%
- Current HPI
- 194.8123
- Rent YoY
- ▲ 3.11%
- Metro
- New Orleans-Metairie, LA
- State GDP YoY
- ▲ 3.29%
- F500 in state
- 10
Industry mix (Fortune 500 HQ in LA)
| Industry | F500 HQs | Revenue |
|---|---|---|
| Telecommunications | 2 | $23B |
|
||
| Utilities | 1 | $12B |
|
||
| Wholesale / Distribution | 1 | $5B |
|
||
| Advertising | 1 | $2B |
|
||
Cash-flow waterfall
monthlySold comps — $/sqft
last 12 mo · ≤1 miLoading sold comps…