34 Cr 423 · Tula, MS
Flood risk 1/10 · Minimal
- FEMA flood zone
- X (unshaded)
- Chance of flooding over 30 yrs
- 0.0%
- Est. flood insurance / yr
- $507 – $1,088
Fire risk 3/10 · Minor
- Est. fire insurance / yr
- $1,241 – $2,305
Heat risk 6/10 · Moderate
- Hot days now (above 108°F)
- 7 days/yr
- Hot days in 30 yrs
- 21 days/yr
Wind risk 4/10 · Minor
- Chance of severe wind over 30 yrs
- 22.0%
Air-quality risk 1/10 · Minimal
- Unhealthy air days now
- 0 days/yr
- Unhealthy air days in 30 yrs
- 0 days/yr
Risk factors via First Street. Map © Google.
Why this score? — see what drove the B- grade
The composite is a weighted blend of 9 inputs, each scored 0–100. Each bar is that input's sub-score; the figure is the points it added to the 100-point composite (weight × sub-score).
- Cash flow +30.0/30.0
- DSCR +10.0/10.0
- 1% rule +9.1/10.0
- ARV discount +7.5/15.0
- Rent growth +3.7/5.0
- Schools +3.7/10.0
- Livability +2.5/5.0
- Condition / age +2.5/5.0
- Appreciation +0.0/10.0
$149,900
🖨 Deal sheet 📄 Offer letter ✓ Due diligence
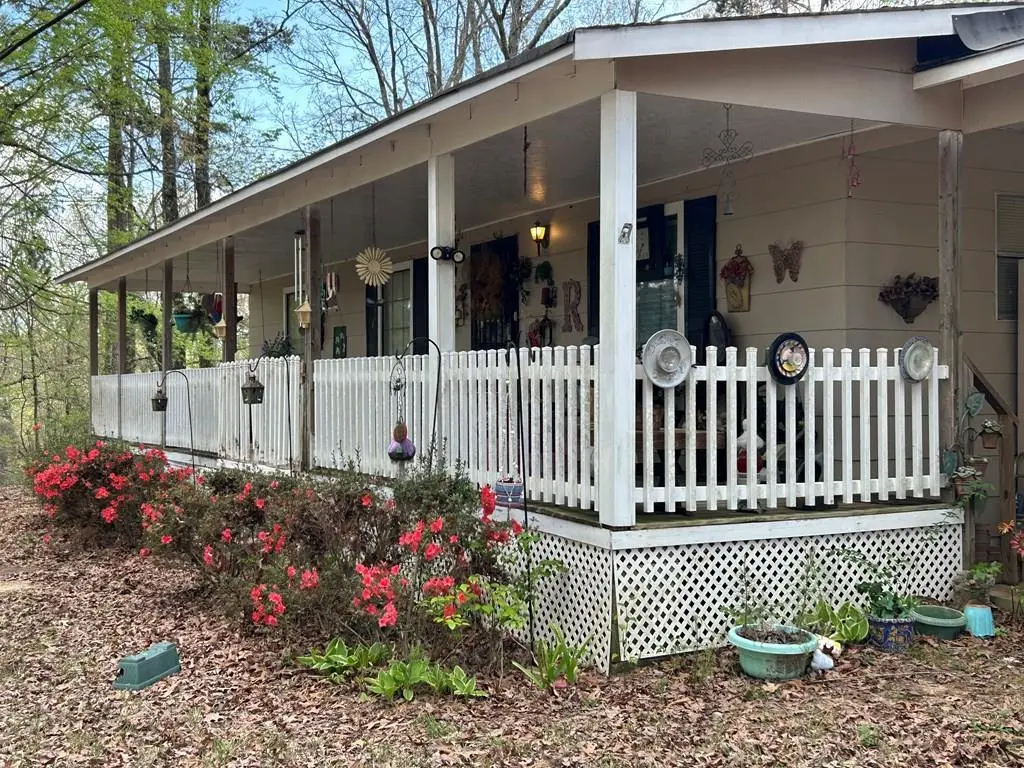
Listing remarks MLS
Nice fixer upper, with 1.5 acres, Priced to sell!!! only 10 minutes to town.
Key facts
- 1.5 acre lot
- Built 1974
- Listed 34 days
Neighborhood map
What this means for you Summary
Snapshot
- This is a 3-bed/2.0-bath single-family listed at $150k.
Deal economics
- At list price, monthly cash flow is $629 ($8k/yr) — positive.
- The deal already cash-flows at list — no discount required.
- Meets the 1% rule at list price ($2k rent vs $150k).
- Recommended offer: $145k (3.0% below list) — sets the bar for market timing.
Location & tenants
- Location reads: area grade B — affects rentability + tenant quality, not the cash-flow math above.
- Lafayette County School District (town): math 47% / reading 40% proficiency, ranked #29 of 130 in MS (top 22%) — families likely to look elsewhere, expect single-tenant / working-renter base with shorter leases.
- Market conditions: Rents rising fast (+4.8%/yr); 855 active listings in the ZIP; 503 units permitted in Lafayette County in 2024 (0 in 5+ unit buildings).
- This rent runs 37% of the median local income ($68k/yr) — at the standard rent-burdened threshold; future hikes will face affordability resistance.
Forward outlook
- Local home prices are declining (-3.0%/yr); year-one equity from $1k of loan paydown is wiped out by about $4k of value loss. Plan a longer hold.
- Lafayette County population projected at +61% by 2050 — long-run rental-demand tailwind backs the buy-and-hold thesis.
- At projected returns (-3.0% appreciation + 4.8% rent growth), your $42k cash investment doubles in ~6 years — after that, you're playing with house money.
Negotiation context
- It's been on market 34 days — a 3% lower offer ($145k) is reasonable based on typical stale-listing flexibility.
Risks & watch-outs
- Climate carrying-cost: extreme-heat days projected 7→21/yr by 2055 (HVAC capex compounding) — expect insurance premiums to compound above CPI over the hold.
Questions for the listing agent
- It's been on market 34 days. Have you received any prior offers? Is the seller open to a 3% concession, seller financing, or rate buy-down credit?
- Built in 1974 — when were the roof, HVAC, electrical panel, plumbing, and water heater last replaced?
- Is there a deadline driving the sale (1031 exchange, divorce, estate, relocation)? That informs how much negotiation room exists.
- What's the average days-on-market for RENTAL listings here right now (not sales)? A rising rental-DOM trend means longer vacancies and softer asking-rent achievability than the comps imply.
- What's the recent tenant-quality profile in this submarket — average credit score on applications, eviction rate, late-payment / NSF rate, and stable-employment percentage? A property-management company in the area should have these aggregated.
- How much new for-sale + rental construction is in the pipeline within 1–3 miles? Heavy new supply typically softens prices + rents 12–24 months out; constrained supply supports both.
Investment metrics
- 1% rule
- 1.41% ✓
- Cap rate
- 11.33%
- Cash-on-cash
- 17.99%
- DSCR
- 1.80
- GRM
- 5.9
CMA / ARV
No comps found within radius.
Projected returns pro-forma
-3.0% appreciation · 4.85% rent growth · sell at horizon
- IRR
- 11.6%
- Equity multiple
- 1.47×
- Total profit
- $19,819
- Equity at exit
- $22,351
- IRR
- 22.1%
- Equity multiple
- 3.05×
- Total profit
- $86,027
- Equity at exit
- $12,961
Cash invested: $41,972 (down + closing). Projections, not guarantees.
Landlord ↔ Tenant lean methodology
- Overall (STATE)
- 90 Strongly Landlord-Friendly
- State Mississippi
- 90 Strongly Landlord-Friendly · R+11
- County
- — inherits STATE
- City
- — inherits STATE
ZIP-level market 38655
- Rents YoY
- 4.8%
- Active inventory
- 855
- Price-to-rent
- 5.9×
Monthly cashflow live
- Estimated rent
- $2,108 medium interval (Pro) →
- Mortgage (P&I)
- −$786
- Tax est. 1.5%
- −$187 /mo · $2,248/yr
- Insurance
- −$62
- HOA
- −$0
- Vacancy / Maint / Mgmt
- −$443
- Net cashflow
- $629
Break-even live
UW: 25.0% down · 7.5% · 30yr · 1.5% tax · 5.0% vac · 8.0% maint · 8.0% mgmt
Financing live
Cash to close
- Down payment
- $37,475
- Closing costs
- $4,497
- Reserves months
- —
- Total cash needed
- —
Loan-product check · same deal, 3 products live
Conventional
25% down · 7.5% · 30yr
- Down + closing
- —
- Monthly P&I
- —
- Monthly cashflow
- —
- DSCR
- —
- Eligible?
- —
Personal DTI + credit; lowest rate.
DSCR
20% down · 8.5% · 30yr
- Down + closing
- —
- Monthly P&I
- —
- Monthly cashflow
- —
- DSCR
- —
- Eligible?
- —
No personal income docs; deal must DSCR.
Hard money
10% down · 12.0% · 12mo
- Down + closing
- —
- Monthly P&I
- —
- Monthly cashflow
- —
- DSCR
- —
- Eligible?
- —
Short-term bridge; refi at stabilization.
Listing history 3 events
-
2026-05-06status Pending 77-char remark
Show marketing remark (77 chars)
Nice fixer upper, with 1.5 acres, Priced to sell!!! only 10 minutes to town.
-
2026-04-17price $149,900 77-char remark
Show marketing remark (77 chars)
Nice fixer upper, with 1.5 acres, Priced to sell!!! only 10 minutes to town.
-
2026-04-03$154,900 Active 77-char remark
Show marketing remark (77 chars)
Nice fixer upper, with 1.5 acres, Priced to sell!!! only 10 minutes to town.
ⓘ Source: listings_history table (triggers on properties + properties_extension) + one-shot
backfill from property_details.listing_events for pre-trigger history.
Climate risk First Street
- Flood 1/10 Low FEMA zone X (unshaded) · 0% chance over 30 yrs
- Wildfire 3/10 Moderate
- Heat 6/10 Major 7 d/yr ≥108°F today · 21 d/yr by 30 yrs out
- Wind 4/10 Moderate 22% chance of damaging wind over 30 yrs
- Air quality 1/10 Low 0 unhealthy d/yr today · 0 by 30 yrs out
Nearby sold comps map
Loading sold comps map…
Walkable amenities ~0.75 mi
Loading nearby amenities…
Taxation est. · year 1
- Rental income
- $25,295
- − Mortgage interest
- −$8,397
- − Property taxes
- −$2,248
- − Insurance
- −$750
- − Repairs & maintenance
- −$2,024
- − Management
- −$2,024
- − Depreciation
- −$4,361
- Taxable income
- $5,492
- Est. tax owed @ 24.0%
- −$1,318
- After-tax cash flow
- $6,234/yr
For passive investors: Depreciation is non-cash, so a rental often shows a tax loss while cash-flowing — sheltering income. Rental losses are passive: they offset passive income freely, and up to $25,000/yr can offset ordinary (W-2) income if you actively participate and your MAGI is under $100k (phasing out to $0 by $150k); unused losses carry forward. On sale, claimed depreciation is recaptured at up to 25%, and gains may owe capital-gains tax (a 1031 exchange can defer both). Figures are a year-1 estimate at your 24.0% rate — not tax advice; consult a CPA.
Schools (NCES district)
- District
- Lafayette County School District
- NCES district ID
- 2802370
- Math proficiency
- 47% ▼ -16.00%
- Reading proficiency
- 40% ▼ -12.00%
- Median HH income
- $46,476
- Composite
- 37.09/100
- National rank
- #4498
- State rank
- #29 of 130 in MS
Livability — Tula
No livability data for this city. (Only ~50 U.S. cities are tracked.)
Census & demographics
- County
- Lafayette County · 46,156 people
- Metro
- Oxford, MS
- Population (ZIP)
- 46,156
- Household income
- $68,235
- Rent vs Own
- Severe rent burden
- 1892.0
Population outlook (Lafayette County) Hauer SSP2
- Today (2025)
- 66,984 people
- By 2030
- 74,726 · +11.6%
- By 2040
- 90,806 · +35.6%
- By 2050
- 108,114 · +61.4%
- By 2075
- 151,215 · +125.7%
- By 2100
- 187,997 · +180.7%
Race, ethnicity, and origin ACS 2023
- Neighborhood character
- Predominantly White (68%)
- Race & ethnicity
- White 68% Black 24% Hispanic / Latino 4% Asian 2% Two or more races 2%
- Common ancestry
- Slovak 3% Serbian 2% Lithuanian 1%
- Foreign-born
- 4% · Canada, China, Vietnam
- Languages at home
- 95% English-only · Spanish 2% Other Indo-European 1% Vietnamese 1%
Political lean MEDSL · Lafayette
- 2024 margin
- Strong R (+21.8) · D 38.3% · R 60.0% · Other 1.7%
- 2008→2024 swing
- -9.4pp toward R · 2008: -12.4pp · 2024: -21.8pp
- All cycles
- 2024: R+21.8 2020: R+12.3 2016: R+14.8 2012: R+15.6 2008: R+12.4
Not yet ingested
- Civics
- —
Market trends
- HPI YoY
- ▼ -204.86%
- Current HPI
- 211.5486
- Rent YoY
- ▲ 4.85%
- Metro
- Oxford, MS
- State GDP YoY
- —
- F500 in state
- 0
Price history
-3.2% since first listed3 events — show timeline
- 2026-05-06 Pending — NCMBR
- 2026-04-17 Price Changed $149,900 NCMBR
- 2026-04-03 Listed $154,900 NCMBR
Cash-flow waterfall
monthlySold comps — $/sqft
last 12 mo · ≤1 miLoading sold comps…