529 Mcnaughton Ave · Deptford, NJ
Flood risk 8/10 · Major
- FEMA flood zone
- X (unshaded)
- Chance of flooding over 30 yrs
- 0.99%
- Est. flood insurance / yr
- $507 – $1,088
Fire risk 4/10 · Minor
- Est. fire insurance / yr
- $526 – $976
Heat risk 6/10 · Moderate
- Hot days now (above 104°F)
- 7 days/yr
- Hot days in 30 yrs
- 15 days/yr
Wind risk 6/10 · Moderate
- Chance of severe wind over 30 yrs
- 53.0%
Air-quality risk 4/10 · Minor
- Unhealthy air days now
- 4 days/yr
- Unhealthy air days in 30 yrs
- 6 days/yr
Risk factors via First Street. Map © Google.
Why this score? — see what drove the C grade
The composite is a weighted blend of 9 inputs, each scored 0–100. Each bar is that input's sub-score; the figure is the points it added to the 100-point composite (weight × sub-score).
- Cash flow +20.7/30.0
- ARV discount +15.0/15.0
- 1% rule +6.6/10.0
- DSCR +6.6/10.0
- Schools +2.8/10.0
- Rent growth +2.5/5.0
- Livability +2.5/5.0
- Condition / age +2.5/5.0
- Appreciation +0.0/10.0
$160,000
🖨 Deal sheet 📄 Offer letter ✓ Due diligence
Listing remarks MLS
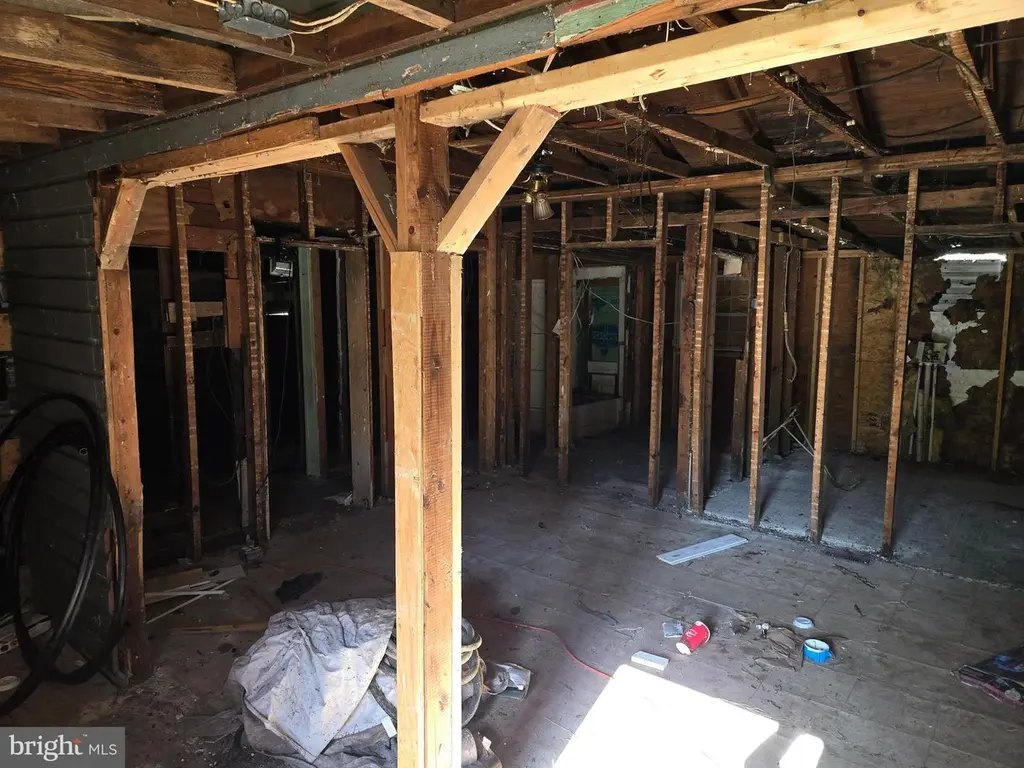
Needs gone ASAP. Make an offer. Lot can be subdivided. Please do your own research.
Key facts
- 1.69 acre lot
- 2 parking spots
- Built 1920
Neighborhood map
What this means for you Summary
Snapshot
- This is a 2-bed/1.0-bath single-family listed at $160k.
Deal economics
- At list price, monthly cash flow is $152 ($2k/yr) — positive.
- The deal already cash-flows at list — no discount required.
- Meets the 1% rule at list price ($2k rent vs $160k).
- Recommended offer: $155k (3.0% below list) — sets the bar for market timing.
Location & tenants
- Location reads: area grade C — affects rentability + tenant quality, not the cash-flow math above.
- Deptford Township Public School District (suburban): math 17% / reading 45% proficiency, ranked #326 of 472 in NJ (top 69%) — families likely to look elsewhere, expect single-tenant / working-renter base with shorter leases.
- Market conditions: 176 active listings in the ZIP; 8 comparable units currently listed for rent nearby; rentals leasing fast (median 10d on market — plan ~1-2 weeks tenant-placement turnaround); solid renter incomes; 1,047 units permitted in Gloucester County in 2024 (183 in 5+ unit buildings).
Forward outlook
- Local home prices are declining (-3.0%/yr); year-one equity from $1k of loan paydown is wiped out by about $5k of value loss. Plan a longer hold.
- Gloucester County population projected to shrink 5% by 2050 — rents likely to lag national; underwrite the cash flow, not the appreciation.
Negotiation context
- It's been on market 55 days — a 3% lower offer ($155k) is reasonable based on typical stale-listing flexibility.
- 3 sale attempts since 2y ago; this cycle's ask has dropped $25k (14%) from the opening price — seller is motivated, your offer sets the floor, not the list.
- Current owner paid $100k; list at $160k implies a 60% gain — meaningful room to come down on a strong offer.
Risks & watch-outs
- Watch-outs: property tax is 2.5% of price; flood insurance adds $66/mo; built in 1920 — expect roof / HVAC / electrical / plumbing capex.
- Climate carrying-cost: severe flood risk; major wind risk, 53% chance of damaging wind over 30y; extreme-heat days projected 7→15/yr by 2055 (HVAC capex compounding) — expect insurance premiums to compound above CPI over the hold.
Questions for the listing agent
- It's been on market 55 days. Have you received any prior offers? Is the seller open to a 3% concession, seller financing, or rate buy-down credit?
- Built in 1920 — when were the roof, HVAC, electrical panel, plumbing, and water heater last replaced?
- Property tax is high relative to price — has the assessment been appealed recently, and will the sale trigger a re-assessment?
- What's the actual annual flood-insurance premium (NFIP or private), and is the property in a SFHA with mandatory coverage?
- Is there a deadline driving the sale (1031 exchange, divorce, estate, relocation)? That informs how much negotiation room exists.
- What's the average days-on-market for RENTAL listings here right now (not sales)? A rising rental-DOM trend means longer vacancies and softer asking-rent achievability than the comps imply.
- What's the recent tenant-quality profile in this submarket — average credit score on applications, eviction rate, late-payment / NSF rate, and stable-employment percentage? A property-management company in the area should have these aggregated.
- How much new for-sale + rental construction is in the pipeline within 1–3 miles? Heavy new supply typically softens prices + rents 12–24 months out; constrained supply supports both.
Investment metrics
- 1% rule
- 1.16% ✓
- Cap rate
- 7.93%
- Cash-on-cash
- 5.84%
- DSCR
- 1.26
- GRM
- 7.2
CMA / ARV
- ARV (median comp)
- $278,172
- List price
- $160,000
- Delta
- -42.48%
- Verdict
- UNDERPRICED
- Comps
- 20 within 1.0 mi
Show comp detail 12 sales within ~0.75 mi
| Address | Dist | Beds/Ba | Sqft | Sold | Price | $/sf | Match |
|---|---|---|---|---|---|---|---|
| 439 Pine Ave | 0.13mi | 3/1.0 (+1) | 1,046 (-5%) | 4mo | $215,000 | $206 | 77 |
| 428 Pine Ave | 0.16mi | 2/1.0 | 1,008 (-8%) | 2mo | $275,000 | $273 | 77 |
| 522 1st Ave | 0.13mi | 3/1.0 (+1) | 1,056 (-4%) | 9mo | $212,000 | $201 | 74 |
| 436 Rankin | 0.12mi | 2/1.0 | 940 (-15%) | 2mo | $275,000 | $293 | 68 |
| 411 Pine Ave | 0.23mi | 3/1.5 (+1) | 1,161 (+5%) | 15mo | $305,000 | $263 | 61 |
| 640 Oak Ave | 0.21mi | 3/1.0 (+1) | 1,200 (+9%) | 16mo | $295,000 | $246 | 57 |
| 1949 Bellmore Ave | 0.65mi | 3/2.0 (+1) | 1,098 (-0%) | 8mo | $310,000 | $282 | 53 |
| 434 Summit Ave | 0.32mi | 3/1.5 (+1) | 1,232 (+12%) | 7mo | $350,000 | $284 | 53 |
| 276 Crestview Ave | 0.66mi | 3/1.0 (+1) | 1,040 (-6%) | 7mo | $325,000 | $313 | 49 |
| 840 May Ave | 0.61mi | 3/2.0 (+1) | 1,152 (+4%) | 11mo | $286,000 | $248 | 46 |
| 2959 County House Rd | 0.71mi | 3/1.0 (+1) | 1,200 (+9%) | 15mo | $330,000 | $275 | 34 |
| 210 Summit Ave | 0.66mi | 3/2.0 (+1) | 1,236 (+12%) | 19mo | $355,000 | $287 | 24 |
Match score weights: distance 35% · size 25% · config 20% · recency 20%. Top-matched comps best support the ARV.
Projected returns pro-forma
-3.0% appreciation · 3.0% rent growth · sell at horizon
- IRR
- -9.8%
- Equity multiple
- 0.64×
- Total profit
- $-16,118
- Equity at exit
- $23,857
- IRR
- -0.3%
- Equity multiple
- 0.98×
- Total profit
- $-978
- Equity at exit
- $13,834
Cash invested: $44,800 (down + closing). Projections, not guarantees.
Landlord ↔ Tenant lean methodology
- Overall (STATE)
- 21 Tenant-Leaning
- State New Jersey
- 21 Tenant-Leaning · D+6
- County
- — inherits STATE
- City
- — inherits STATE
ZIP-level market 08096
- Active inventory
- 176
- Price-to-rent
- 7.2×
Monthly cashflow live
- Estimated rent
- $1,852 high interval (Pro) →
- Mortgage (P&I)
- −$839
- Tax from tax record
- −$339 /mo · $4,068/yr
- Insurance
- −$67
- Flood insurance flood zone
- −$66 /mo · $798/yr
- HOA
- −$0
- Vacancy / Maint / Mgmt
- −$389
- Net cashflow
- $152
Break-even live
UW: 25.0% down · 7.5% · 30yr · 1.5% tax · 5.0% vac · 8.0% maint · 8.0% mgmt
Financing live
Cash to close
- Down payment
- $40,000
- Closing costs
- $4,800
- Reserves months
- —
- Total cash needed
- —
Loan-product check · same deal, 3 products live
Conventional
25% down · 7.5% · 30yr
- Down + closing
- —
- Monthly P&I
- —
- Monthly cashflow
- —
- DSCR
- —
- Eligible?
- —
Personal DTI + credit; lowest rate.
DSCR
20% down · 8.5% · 30yr
- Down + closing
- —
- Monthly P&I
- —
- Monthly cashflow
- —
- DSCR
- —
- Eligible?
- —
No personal income docs; deal must DSCR.
Hard money
10% down · 12.0% · 12mo
- Down + closing
- —
- Monthly P&I
- —
- Monthly cashflow
- —
- DSCR
- —
- Eligible?
- —
Short-term bridge; refi at stabilization.
Rent comps 8 comps
| Address | Beds | Baths | Sqft | Rent | $/sqft | DOM | Units | Dist |
|---|---|---|---|---|---|---|---|---|
| 1515 Hurffville Rd Unit A Deptford, NJ | 3.0 | 1.0 | 1128 | $1,999 | $1.77 | 24d | 1 | 0.33mi |
| 227 Washington Ave Apt D2 Blackwood, NJ | 1.0 | 1.0 | 700 | $1,395 | $1.99 | 10d | 1 | 0.82mi |
| 227 Washington Ave Blackwood, NJ | 1.0 | 1.0 | 700 | $1,375 | $1.96 | 1d | 1 | 0.82mi |
| 230 Almonesson Rd Unit A Blackwood, NJ | 2.0 | 1.0 | 900 | $1,900 | $2.11 | 10d | 1 | 0.88mi |
| 2049 Barnsboro Rd Blackwood, NJ | 1.0 | 1.0 | 765 | $1,540 | $2.01 | 13d | 1 | 0.97mi |
| 241 Blackwood-Barnsboro Rd Unit 1207 Blackwood, NJ | 2.0 | 1.5 | 800 | $1,500 | $1.88 | 13d | 1 | 1.22mi |
| 100 Blenheim-Erial Rd Blackwood, NJ | 1.0–2.0 | 1.0–2.0 | 1439 | $2,670 | $1.85 | 1d | 1 | 1.35mi |
| 590 Lower Landing Rd Blackwood, NJ | 3.0 | 1.0–1.5 | 1030 | $2,087 | $2.03 | 1d | 10 | 1.40mi |
Listing history 27 events
-
2026-06-18days on market $160,000 Active 55 DOM
-
2026-06-17days on market $160,000 Active 54 DOM
-
2026-06-16days on market $160,000 Active 53 DOM
-
2026-06-15days on market $160,000 Active 52 DOM
-
2026-06-13days on market $160,000 Active 50 DOM
-
2026-06-09days on market $160,000 Active 46 DOM
-
2026-06-08days on market $160,000 Active 45 DOM
-
2026-06-07days on market $160,000 Active 44 DOM
-
2026-06-04days on market $160,000 Active 41 DOM
-
2026-06-03days on market $160,000 Active 40 DOM
-
2026-06-02days on market $160,000 Active 39 DOM
-
2026-06-01days on market $160,000 Active 38 DOM
-
2026-05-31days on market $160,000 Active 37 DOM
-
2026-05-14price $160,000 83-char remark
Show marketing remark (83 chars)
Needs gone ASAP. Make an offer. Lot can be subdivided. Please do your own research.
-
2026-04-22$184,999 Active 83-char remark
Show marketing remark (83 chars)
Needs gone ASAP. Make an offer. Lot can be subdivided. Please do your own research.
-
2025-12-22historical
-
2025-11-29price $184,999
-
2025-10-09price $199,000
-
2025-09-05price $215,000
-
2025-07-01$249,900 Active
-
2024-07-29soldstatus $99,999
-
2024-07-12soldstatus $99,999 Closed
-
2024-06-27historical Active Under Contract
-
2024-06-20$100,000 Active
-
1999-11-16soldstatus $25,000
-
1996-11-21soldstatus $110,330
-
1993-03-17soldstatus $50,000
ⓘ Source: listings_history table (triggers on properties + properties_extension) + one-shot
backfill from property_details.listing_events for pre-trigger history.
Tax reassessment forecast NJ · Partial reset (capped growth)
- Current annual tax
- $4,068 · $339/mo
- Projected year-2 tax
- $4,068 · $339/mo
- Expected delta
- $0/yr ($0/mo · 0.0%)
ⓘ Screening estimate from a state-policy table — verify with the county assessor before closing.
Climate risk First Street
- Flood 8/10 Severe FEMA zone X (unshaded) · 99% chance over 30 yrs
- Wildfire 4/10 Moderate
- Heat 6/10 Major 7 d/yr ≥104°F today · 15 d/yr by 30 yrs out
- Wind 6/10 Major 53% chance of damaging wind over 30 yrs
- Air quality 4/10 Moderate 4 unhealthy d/yr today · 6 by 30 yrs out
Nearby sold comps map
Loading sold comps map…
Walkable amenities ~0.75 mi
Loading nearby amenities…
Taxation est. · year 1
- Rental income
- $22,220
- − Mortgage interest
- −$8,962
- − Property taxes
- −$4,068
- − Insurance
- −$1,598
- − Repairs & maintenance
- −$1,778
- − Management
- −$1,778
- − Depreciation
- −$4,655
- Taxable loss
- −$618
- Est. tax savings @ 24.0%
- +$148
- After-tax cash flow
- $1,967/yr
For passive investors: Depreciation is non-cash, so a rental often shows a tax loss while cash-flowing — sheltering income. Rental losses are passive: they offset passive income freely, and up to $25,000/yr can offset ordinary (W-2) income if you actively participate and your MAGI is under $100k (phasing out to $0 by $150k); unused losses carry forward. On sale, claimed depreciation is recaptured at up to 25%, and gains may owe capital-gains tax (a 1031 exchange can defer both). Figures are a year-1 estimate at your 24.0% rate — not tax advice; consult a CPA.
Schools (NCES district)
- District
- Deptford Township Public School District
- NCES district ID
- 3403900
- Math proficiency
- 17% ▼ -24.00%
- Reading proficiency
- 45% ▼ -5.00%
- Median HH income
- $66,302
- Composite
- 28.48/100
- National rank
- #6741
- State rank
- #326 of 472 in NJ
Livability — Deptford
No livability data for this city. (Only ~50 U.S. cities are tracked.)
Census & demographics
- County
- Gloucester County · 160,422 people
- Metro
- Philadelphia-Camden-Wilmington, PA-NJ-DE-MD
- Population (ZIP)
- 35,336
- Household income
- $89,013
- Rent vs Own
- Severe rent burden
- 1044.0
Population outlook (Gloucester County) Hauer SSP2
- Today (2025)
- 298,895 people
- By 2030
- 299,031 · +0.0%
- By 2040
- 294,020 · -1.6%
- By 2050
- 284,188 · -4.9%
- By 2075
- 260,720 · -12.8%
- By 2100
- 229,565 · -23.2%
Race, ethnicity, and origin ACS 2023
- Neighborhood character
- Predominantly White (66%)
- Race & ethnicity
- White 66% Hispanic / Latino 13% Black 12% Two or more races 10% Asian 3%
- Hispanic origin (detail)
- Mexican 3% Puerto Rican 5% Dominican 1%
- Common ancestry
- Romanian 4% Lithuanian 1% Iranian 1%
- Foreign-born
- 8% · Canada, China, South Korea
- Languages at home
- 86% English-only · Spanish 9% Other Indo-European 2% Other Asian/Pacific 1%
Political lean MEDSL · Gloucester
- 2024 margin
- Toss-up / Even · D 47.8% · R 50.6% · Other 1.6%
- 2008→2024 swing
- -15.0pp toward R · 2008: 12.2pp · 2024: -2.8pp
- All cycles
- 2024: R+2.8 2020: D+1.9 2016: R+0.4 2012: D+10.5 2008: D+12.2
Not yet ingested
- Civics
- —
Market trends
- HPI YoY
- ▼ -239.24%
- Current HPI
- 269.1606
- Rent YoY
- —
- Metro
- Philadelphia-Camden-Wilmington, PA-NJ-DE-MD
- State GDP YoY
- ▲ 2.05%
- F500 in state
- 34
Industry mix (Fortune 500 HQ in NJ)
| Industry | F500 HQs | Revenue |
|---|---|---|
| Consumer Goods | 3 | $31B |
|
||
| Pharmaceuticals | 2 | $153B |
|
||
| Technology | 2 | $21B |
|
||
| Insurance | 2 | $20B |
|
||
| Healthcare | 2 | $19B |
|
||
| Financial Services | 1 | $70B |
|
||
Price history
+220.0% since first listed14 events — show timeline
- 2026-05-14 Price Changed $160,000 BRIGHT MLS
- 2026-04-22 Listed $184,999 BRIGHT MLS
- 2025-12-22 Listing Removed — BRIGHT MLS
- 2025-11-29 Price Changed $184,999 BRIGHT MLS
- 2025-10-09 Price Changed $199,000 BRIGHT MLS
- 2025-09-05 Price Changed $215,000 BRIGHT MLS
- 2025-07-01 Listed $249,900 BRIGHT MLS
- 2024-07-29 Sold (Public Records) $99,999 Public Records
- 2024-07-12 Sold (MLS) $99,999 BRIGHT MLS
- 2024-06-27 Contingent — BRIGHT MLS
- 2024-06-20 Listed $100,000 BRIGHT MLS
- 1999-11-16 Sold (Public Records) $25,000 Public Records
- 1996-11-21 Sold (Public Records) $110,330 Public Records
- 1993-03-17 Sold (Public Records) $50,000 Public Records
Property tax history
+5.2%/yrLatest (2025): $4,068 · +2.1% YoY. Source: county tax records.
Cash-flow waterfall
monthlySold comps — $/sqft
last 12 mo · ≤1 miLoading sold comps…