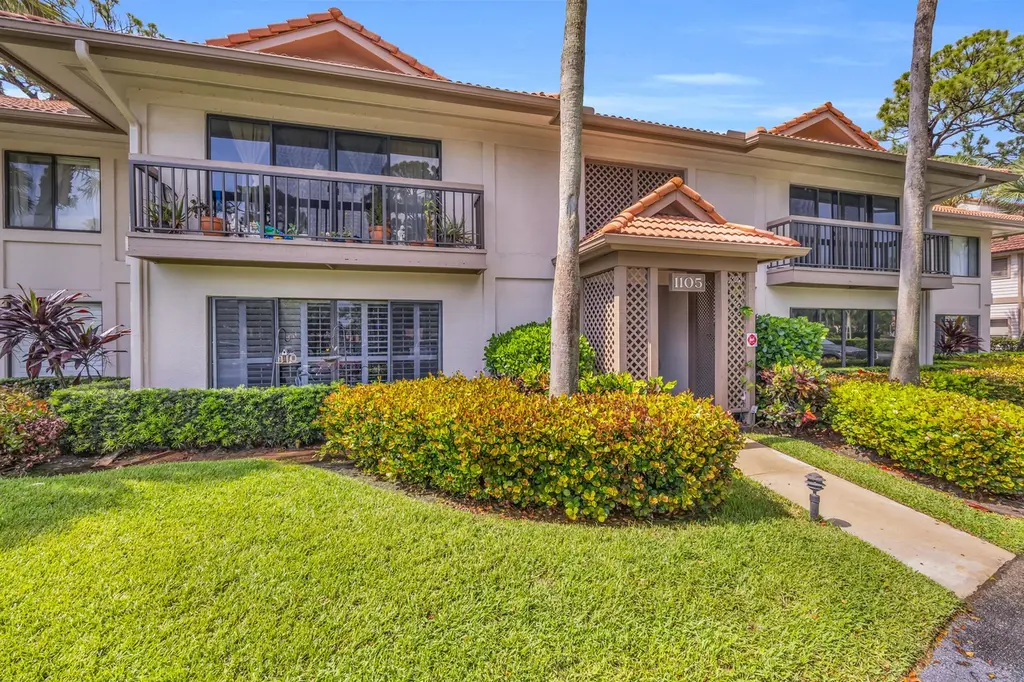
1105 Duncan Cir #104 · Palm Beach Gardens, FL
Flood risk 1/10 · Minimal
- FEMA flood zone
- X (unshaded)
- Chance of flooding over 30 yrs
- 0.0%
- Est. flood insurance / yr
- $507 – $1,088
Fire risk 3/10 · Minor
- Est. fire insurance / yr
- $947 – $1,759
Heat risk 10/10 · Severe
- Hot days now (above 106°F)
- 7 days/yr
- Hot days in 30 yrs
- 26 days/yr
Wind risk 10/10 · Severe
- Chance of severe wind over 30 yrs
- 99.0%
Air-quality risk 2/10 · Minimal
- Unhealthy air days now
- 2 days/yr
- Unhealthy air days in 30 yrs
- 2 days/yr
Risk factors via First Street. Map © Google.
Why this score? — see what drove the D- grade
The composite is a weighted blend of 9 inputs, each scored 0–100. Each bar is that input's sub-score; the figure is the points it added to the 100-point composite (weight × sub-score).
- Cash flow +10.5/30.0
- ARV discount +7.5/15.0
- 1% rule +5.0/10.0
- Schools +4.3/10.0
- Livability +3.5/5.0
- DSCR +3.0/10.0
- Rent growth +3.0/5.0
- Condition / age +2.5/5.0
- Appreciation +0.0/10.0
$410,000
🖨 Deal sheet (PDF) 📄 Offer letter ✓ Due diligence
Listing remarks MLS
This beautiful 2 bedroom 2 bath completely renovated condo is move in ready. Spacious kitchen with quartz, stainless steel appliances, and plenty of cabinet space is perfect for entertaining guests. Master suite has a walk in closet, and double vanity separate from the shower and toilet. PGA national golf memberships available. Close to PGA commons where there are many great restaurants and bars for entertainment. A MUST SEE.
Key facts
- Gated community
- Updated home
- 24 hour patrol
Tags
Property features AI
Finance
- Other: Pets allowed (possible pet restrictions)
- HOA & community: Monthly HOA fee (reported) of 674; Association amenities include clubhouse, golf course, parking, and pool; HOA covers cable TV, insurance, grounds maintenance, sewer, trash, water, and common real estate tax; Association managed by Hawk-Eye Management
Exterior
- Parking: Assigned parking; Guest parking; Open parking (total 1 space); No carport
- Security: Gated community with guard; Smoke detector(s)
- Utilities: Public water; Public sewer; Cable available
- Home design: Condominium in a community named Dunbar Woods; Two levels (total listed as one story building area); Faces south; Resale condition
- Construction: Block and stucco construction
- Exterior features: No waterfront; Tile roof
Interior
- Kitchen: Disposal; Dishwasher; Electric range; Microwave; Refrigerator
- Bedrooms: Two bedrooms on the main level
- Flooring: Vinyl flooring
- Bathrooms: Two full bathrooms on the main level
- Heating & cooling: Central heating; Central air; Ceiling fan(s)
- Interior features: Kitchen island; Walk-in closet(s); Furnished
- Laundry & utility: Laundry closet inside the unit
Neighborhood map
What this means for you Summary
Snapshot
- This is a 2-bed/2.0-bath condo listed at $410k.
Deal economics
- At list price, monthly cash flow is $-207 ($-2k/yr) — negative.
- To cash-flow at today's rent, offer at most $373k (8.9% below list).
- To meet the 1% rule (rent ≥ 1% of price), the offer needs to be $408k (0.4% below list).
- Recommended offer: $373k (8.9% below list) — sets the bar for cash-flow.
Location & tenants
- Location reads 69/100 on livability (#464 in FL) — a middle-class / working-renter tenant base. Strengths: crime A+, employment A+, housing A+; Watch: amenities F, commute F, cost of living F.
- Palm Beach (suburban): math 46% / reading 53% proficiency, ranked #34 of 73 in FL (top 47%) — families likely to look elsewhere, expect single-tenant / working-renter base with shorter leases.
- Zoned schools: Timber Trace Elementary School (math 76% / reading 79%, grade A, #163 of 2,144 statewide, top 8%, 825 students, 34% FRL); Watson B. Duncan Middle School (math 54% / reading 59%, grade B, #171 of 571 statewide, top 30%, 1,157 students, 41% FRL); Palm Beach Gardens High School (math 19% / reading 40%, grade F, #447 of 667 statewide, top 68%, 2,570 students, 61% FRL).
- Market conditions: Rents rising (+2.0%/yr); 542 active listings in the ZIP; 40 comparable units currently listed for rent nearby; rentals at typical pace (median 26d on market — plan ~3-4 weeks tenant-placement turnaround); high-income renter base; 3,974 units permitted in Palm Beach County in 2024 (1,012 in 5+ unit buildings).
- This rent runs 39% of the median local income ($125k/yr) — at the standard rent-burdened threshold; future hikes will face affordability resistance.
Forward outlook
- Local home prices are declining (-3.0%/yr); year-one equity from $3k of loan paydown is wiped out by about $12k of value loss. Plan a longer hold.
- Palm Beach County population projected at +30% by 2050 — long-run rental-demand tailwind backs the buy-and-hold thesis.
Negotiation context
- It's been on market 16 days — a 2% lower offer ($404k) is reasonable based on typical stale-listing flexibility.
- 9 sale attempts since 29y ago with the ask held roughly flat each time — persistent listings suggest the price (not the market) is what's stuck; bring a comps-based counter.
- Current owner paid $220k; list at $410k implies a 86% gain — meaningful room to come down on a strong offer.
Risks & watch-outs
- Climate carrying-cost: severe wind risk, 99% chance of damaging wind over 30y; extreme-heat days projected 7→26/yr by 2055 (HVAC capex compounding) — expect insurance premiums to compound above CPI over the hold.
Questions for the listing agent
- What do current leases actually rent for vs. the listed asking? Can we see a recent rent roll and the last 12 months of T-12 income?
- What does the HOA fee cover, when was the last increase, and are there any pending special assessments or reserve-fund shortfalls?
- Any open or pending special assessments — roof, HVAC, plumbing, elevator, façade? What's the per-unit balance and payoff schedule, and is the seller paying it off at close or rolling it to the buyer?
- Is there a deadline driving the sale (1031 exchange, divorce, estate, relocation)? That informs how much negotiation room exists.
- Schools are B-rated — typically a magnet for longer-tenancy family renters. What's the average tenant stay here, and is there a school-zone premium baked into asking?
- The area grade is low — what's the realistic commute time and amenity access for the typical tenant pool here? Any planned neighborhood developments (good or bad) we should know about?
- What's the average days-on-market for RENTAL listings here right now (not sales)? A rising rental-DOM trend means longer vacancies and softer asking-rent achievability than the comps imply.
- What's the recent tenant-quality profile in this submarket — average credit score on applications, eviction rate, late-payment / NSF rate, and stable-employment percentage? A property-management company in the area should have these aggregated.
- How much new apartment / multifamily construction is in the pipeline within 1–3 miles? Heavy new supply (>2% of stock underway) typically softens rents 12–24 months out; light construction supports rent growth.
Investment metrics
- 1% rule
- 1.00% ✗
- Cap rate
- 5.69%
- Cash-on-cash
- -2.17%
- DSCR
- 0.90
- GRM
- 8.4
CMA / ARV
No comps found within radius.
Projected returns pro-forma
-3.0% appreciation · 2.0% rent growth · sell at horizon
- IRR
- -21.1%
- Equity multiple
- 0.27×
- Total profit
- $-83,284
- Equity at exit
- $61,132
- IRR
- -17.4%
- Equity multiple
- 0.09×
- Total profit
- $-104,142
- Equity at exit
- $35,449
Cash invested: $114,800 (down + closing). Projections, not guarantees.
Landlord ↔ Tenant lean methodology
- Overall (STATE)
- 87 Strongly Landlord-Friendly
- State Florida
- 87 Strongly Landlord-Friendly · R+3
- County
- — inherits STATE
- City
- — inherits STATE
ZIP-level market 33418
- Home prices YoY
- -32.4%
- Rents YoY
- 2.0%
- Active inventory
- 542
- Price-to-rent
- 8.4×
Monthly cashflow live
- Estimated rent
- $4,083 high interval (Pro) →
- Mortgage (P&I)
- −$2,150
- Tax from tax record
- −$438 /mo · $5,259/yr
- Insurance
- −$171
- HOA
- −$674
- Vacancy / Maint / Mgmt
- −$857
- Net cashflow
- $-207
Break-even live
Sensitivity live
| Price | -10% $25 | -5% $-91 | +0% $-207 | +5% $-323 | +10% $-439 |
|---|---|---|---|---|---|
| Rent | -10% $-530 | -5% $-369 | +0% $-207 | +5% $-46 | +10% $115 |
| Rate | -1.0pp $-1 | -0.5pp $-103 | base $-207 | +0.5pp $-314 | +1.0pp $-422 |
UW: 25.0% down · 7.5% · 30yr · 1.5% tax · 5.0% vac · 8.0% maint · 8.0% mgmt
Financing live
Cash to close
- Down payment
- $102,500
- Closing costs
- $12,300
- Reserves months
- —
- Total cash needed
- —
Loan-product check · same deal, 3 products live
Conventional
25% down · 7.5% · 30yr
- Down + closing
- —
- Monthly P&I
- —
- Monthly cashflow
- —
- DSCR
- —
- Eligible?
- —
Personal DTI + credit; lowest rate.
DSCR
20% down · 8.5% · 30yr
- Down + closing
- —
- Monthly P&I
- —
- Monthly cashflow
- —
- DSCR
- —
- Eligible?
- —
No personal income docs; deal must DSCR.
Hard money
10% down · 12.0% · 12mo
- Down + closing
- —
- Monthly P&I
- —
- Monthly cashflow
- —
- DSCR
- —
- Eligible?
- —
Short-term bridge; refi at stabilization.
Rent comps 40 comps
| Address | Beds | Baths | Sqft | Rent | $/sqft | DOM | Units | Dist |
|---|---|---|---|---|---|---|---|---|
| 1107 Duncan Cir #102 Palm Beach Gardens, FL | 3.0 | 2.0 | 1268 | $3,400 | $2.68 | 26d | 1 | 0.03mi |
| 1111 Duncan Cir #203 Palm Beach Gardens, FL | 2.0 | 2.0 | 1035 | $2,900 | $2.80 | 26d | 1 | 0.08mi |
| 1401 Mahogany Pl Palm Beach Gardens, FL | 2.0 | 2.0 | 1499 | $8,500 | $5.67 | 23d | 1 | 0.13mi |
| 355 Prestwick Cir #4 Palm Beach Gardens, FL | 2.0 | 3.0 | 1532 | $3,500 | $2.28 | 26d | 1 | 0.13mi |
| 1903 Rosewood Way Palm Beach Gardens, FL | 2.0 | 2.0 | 1236 | $3,750 | $3.03 | 26d | 1 | 0.13mi |
| 1302 Mahogany Pl Palm Beach Gardens, FL | 2.0 | 2.0 | 1355 | $8,000 | $5.90 | 26d | 1 | 0.15mi |
| 359 Prestwick Cir #2 Palm Beach Gardens, FL | 2.0 | 3.0 | 1532 | $3,400 | $2.22 | 26d | 1 | 0.16mi |
| 1802 Rosewood Way Palm Beach Gardens, FL | 2.0 | 2.0 | 1355 | $3,550 | $2.62 | 23d | 1 | 0.17mi |
| 352 Prestwick Cir #1 Palm Beach Gardens, FL | 2.0 | 3.0 | 1532 | $2,700 | $1.76 | 26d | 1 | 0.18mi |
| 1804 Rosewood Way Palm Beach Gardens, FL | 3.0 | 2.0 | 1615 | $8,000 | $4.95 | 26d | 1 | 0.18mi |
| 479 Prestwick Cir Palm Beach Gardens, FL | 3.0 | 2.0 | 1818 | $9,500 | $5.23 | 26d | 1 | 0.23mi |
| 802 Sabal Palm Ln Palm Beach Gardens, FL | 3.0 | 2.0 | 1615 | $9,995 | $6.19 | 26d | 1 | 0.25mi |
| 505 Prestwick Cir Palm Beach Gardens, FL | 3.0 | 2.0 | 1850 | $3,250 | $1.76 | 4d | 1 | 0.30mi |
| 364 Prestwick Cir #4 Palm Beach Gardens, FL | 2.0 | 2.5 | 1466 | $2,600 | $1.77 | 26d | 1 | 0.30mi |
| 533 Prestwick Cir Palm Beach Gardens, FL | 2.0 | 2.0 | 1514 | $4,000 | $2.64 | 26d | 1 | 0.37mi |
| 316 Brackenwood Cir #316 Palm Beach Gardens, FL | 2.0 | 2.0 | 1180 | $3,150 | $2.67 | 26d | 1 | 0.61mi |
| 334 Brackenwood Cir Palm Beach Gardens, FL | 2.0 | 2.0 | 1366 | $3,950 | $2.89 | 26d | 1 | 0.62mi |
| 137 Brackenwood Rd Palm Beach Gardens, FL | 2.0 | 2.0 | 1366 | $4,500 | $3.29 | 26d | 1 | 0.67mi |
| 428 Brackenwood Ln S Palm Beach Gardens, FL | 2.0 | 2.0 | 1366 | $2,500 | $1.83 | 26d | 1 | 0.70mi |
| 563 Brackenwood Pl Palm Beach Gardens, FL | 2.0 | 2.0 | 1366 | $7,000 | $5.12 | 4d | 1 | 0.70mi |
| 512 Brackenwood Pl Palm Beach Gardens, FL | 2.0 | 2.0 | 1366 | $4,000 | $2.93 | 26d | 1 | 0.71mi |
| 438 Brackenwood Ln S Palm Beach Gardens, FL | 2.0 | 2.0 | 1366 | $3,000 | $2.20 | 26d | 1 | 0.72mi |
| 632 Brackenwood Cv Palm Beach Gardens, FL | 2.0 | 2.0 | 1366 | $3,000 | $2.20 | 26d | 1 | 0.76mi |
| 616 Bracken Wood Cv Unit 616 Palm Beach Gardens, FL | 2.0 | 2.0 | 1366 | $7,000 | $5.12 | 26d | 1 | 0.77mi |
| 605 Brackenwood Cv Palm Beach Gardens, FL | 2.0 | 2.0 | 1366 | $7,000 | $5.12 | 26d | 1 | 0.78mi |
| 611 Brackenwood Cv Palm Beach Gardens, FL | 2.0 | 2.0 | 1366 | $2,800 | $2.05 | 3d | 1 | 0.79mi |
| 605 Masters Way Palm Beach Gardens, FL | 3.0 | 3.0 | 1738 | $17,500 | $10.07 | 26d | 1 | 0.80mi |
| 32 Admirals Ct Palm Beach Gardens, FL | 3.0 | 2.0 | 1438 | $3,590 | $2.50 | 13d | 1 | 0.88mi |
| 32 Admirals Ct Palm Beach Gardens, FL | 3.0 | 2.0 | 1438 | $4,500 | $3.13 | 13d | 1 | 0.88mi |
| 77 Spyglass Way Palm Beach Gardens, FL | 3.0 | 2.5 | 1471 | $3,500 | $2.38 | 26d | 1 | 0.90mi |
| 821 Club Dr Palm Beach Gardens, FL | 2.0 | 2.0 | 1135 | $9,950 | $8.77 | 26d | 1 | 0.90mi |
| 820 Club Dr Palm Beach Gardens, FL | 2.0 | 2.0 | 1135 | $3,200 | $2.82 | 26d | 1 | 0.90mi |
| 515 Club Dr Palm Beach Gardens, FL | 2.0 | 2.0 | 1135 | $5,000 | $4.41 | 26d | 1 | 0.90mi |
| 523 Club Dr Palm Beach Gardens, FL | 2.0 | 2.0 | 1135 | $3,500 | $3.08 | 22d | 1 | 0.91mi |
| 533 Club Dr Palm Beach Gardens, FL | 2.0 | 2.0 | 1135 | $3,000 | $2.64 | 23d | 1 | 0.91mi |
| 615 Club Dr Palm Beach Gardens, FL | 2.0 | 2.0 | 1135 | $6,000 | $5.29 | 26d | 1 | 0.92mi |
| 825 Club Dr Palm Beach Gardens, FL | 2.0 | 2.0 | 1135 | $2,850 | $2.51 | 6d | 1 | 0.92mi |
| 811 Club Dr Palm Beach Gardens, FL | 2.0 | 2.0 | 1135 | $9,000 | $7.93 | 26d | 1 | 0.93mi |
| 830 Club Dr Palm Beach Gardens, FL | 2.0 | 2.0 | 1135 | $7,500 | $6.61 | 26d | 1 | 0.94mi |
| 402 Club Dr Palm Beach Gardens, FL | 2.0 | 2.0 | 1135 | $7,500 | $6.61 | 26d | 1 | 0.96mi |
HOA detail condo
- Monthly dues
- $674 · $8,088/yr
- Assessments
- None detected in remarks — confirm with the listing agent.
Listing history 10 events
-
2026-06-21days on market $410,000 Active 16 DOM
-
2026-06-18days on market $410,000 Active 13 DOM
-
2026-06-17days on market $410,000 Active 12 DOM
-
2026-06-16days on market $410,000 Active 11 DOM
-
2026-06-15days on market $410,000 Active 10 DOM
-
2026-06-13days on market $410,000 Active 8 DOM
-
2026-06-09days on market $410,000 Active 4 DOM
-
2026-06-08days on market $410,000 Active 3 DOM
-
2026-06-07remarks 699-char remark
-
2026-06-07$410,000 Active 2 DOM
ⓘ Source: listings_history table (triggers on properties + properties_extension) + one-shot
backfill from property_details.listing_events for pre-trigger history.
Tax reassessment forecast FL · Resets to sale price
- Current annual tax
- $5,259 · $438/mo
- Projected year-2 tax
- $5,259 · $438/mo
- Expected delta
- $0/yr ($0/mo · 0.0%)
ⓘ Screening estimate from a state-policy table — verify with the county assessor before closing.
Climate risk First Street
- Flood 1/10 Low FEMA zone X (unshaded) · 0% chance over 30 yrs
- Wildfire 3/10 Moderate
- Heat 10/10 Extreme 7 d/yr ≥106°F today · 26 d/yr by 30 yrs out
- Wind 10/10 Extreme 99% chance of damaging wind over 30 yrs
- Air quality 2/10 Low 2 unhealthy d/yr today · 2 by 30 yrs out
Nearby sold comps map
Loading sold comps map…
Walkable amenities ~0.75 mi
Loading nearby amenities…
Taxation est. · year 1
- Rental income
- $48,999
- − Mortgage interest
- −$22,966
- − Property taxes
- −$5,259
- − Insurance
- −$2,050
- − Repairs & maintenance
- −$3,920
- − Management
- −$3,920
- − HOA
- −$8,088
- − Depreciation
- −$11,927
- Taxable loss
- −$9,131
- Est. tax savings @ 24.0%
- +$2,191
- After-tax cash flow
- $-297/yr
For passive investors: Depreciation is non-cash, so a rental often shows a tax loss while cash-flowing — sheltering income. Rental losses are passive: they offset passive income freely, and up to $25,000/yr can offset ordinary (W-2) income if you actively participate and your MAGI is under $100k (phasing out to $0 by $150k); unused losses carry forward. On sale, claimed depreciation is recaptured at up to 25%, and gains may owe capital-gains tax (a 1031 exchange can defer both). Figures are a year-1 estimate at your 24.0% rate — not tax advice; consult a CPA.
Schools (NCES district)
- District
- Palm Beach
- NCES district ID
- 1201500
- Math proficiency
- 46% ▼ -16.00%
- Reading proficiency
- 53% ▼ -4.00%
- Median HH income
- $53,943
- Composite
- 42.72/100
- National rank
- #3160
- State rank
- #34 of 73 in FL
Livability — Palm Beach Gardens
- Score
- 69/100
- State rank
- #464
- US rank
- #8366
Category grades
Schools grade is shown separately in the Schools card above.
Census & demographics
- Census place
- Palm Beach Gardens, FL
- County
- Palm Beach County · 1,438,312 people
- City population
- 96,294
- Metro
- Miami-Fort Lauderdale-Pompano Beach, FL
- Population (ZIP)
- 43,676
- Household income
- $125,497
- Rent vs Own
- Severe rent burden
- 1339.0
Population outlook (Palm Beach County) Hauer SSP2
- Today (2025)
- 1,637,487 people
- By 2030
- 1,743,255 · +6.5%
- By 2040
- 1,948,712 · +19.0%
- By 2050
- 2,132,979 · +30.3%
- By 2075
- 2,530,027 · +54.5%
- By 2100
- 2,706,979 · +65.3%
Race, ethnicity, and origin ACS 2023
- Neighborhood character
- Predominantly White (75%)
- Race & ethnicity
- White 75% Hispanic / Latino 13% Two or more races 9% Black 5% Asian 4%
- Hispanic origin (detail)
- Mexican 2% Puerto Rican 2% Cuban 2%
- Common ancestry
- Romanian 5% Lithuanian 4% Scotch-Irish 4%
- Foreign-born
- 15% · Canada, China, Jamaica
- Languages at home
- 83% English-only · Spanish 8% German/W. Germanic 2% Other Indo-European 2%
Political lean MEDSL · Palm Beach
- 2024 margin
- Toss-up / Even · D 50.0% · R 49.2%
- 2008→2024 swing
- -22.1pp toward R · 2008: 22.9pp · 2024: 0.8pp
- All cycles
- 2024: D+0.8 2020: D+12.8 2016: D+15.3 2012: D+17.0 2008: D+22.9
Not yet ingested
- Civics
- —
Market trends
- HPI YoY
- ▼ -172.79%
- Current HPI
- 361.1997
- Rent YoY
- ▲ 2.00%
- Metro
- Miami-Fort Lauderdale-Pompano Beach, FL
- State GDP YoY
- ▲ 3.28%
- F500 in state
- 36
Industry mix (Fortune 500 HQ in FL)
| Industry | F500 HQs | Revenue |
|---|---|---|
| Industrial Technology | 2 | $29B |
|
||
| Insurance | 2 | $17B |
|
||
| Retail | 1 | $60B |
|
||
| Technology Distribution | 1 | $58B |
|
||
| Homebuilding | 1 | $35B |
|
||
| Technology Manufacturing | 1 | $35B |
|
||
Price history
+486.6% since first listed25 events — show timeline
- 2026-06-04 Listed $410,000 Beaches MLS
- 2026-01-31 Rental Removed $4,000 RMLSFL
- 2025-12-09 Price Changed $4,000 RMLSFL
- 2025-09-26 Listed for Rent $2,800 RMLSFL
- 2025-09-25 Rental Removed $2,800 GFLMLS
- 2025-09-25 Listed for Rent $2,800 GFLMLS
- 2025-07-19 Rental Removed $2,800 RMLSFL
- 2025-04-09 Listed for Rent $2,800 RMLSFL
- 2020-12-07 Sold (MLS) $220,000 Beaches MLS
- 2020-09-24 Pending — Beaches MLS
- 2020-08-04 Listed $240,000 Beaches MLS
- 2018-05-22 Sold (Public Records) $160,000 Public Records
- 2018-05-22 Sold (MLS) $160,000 Beaches MLS
- 2018-05-10 Pending — Beaches MLS
- 2018-03-29 Contingent — Beaches MLS
- 2018-03-08 Price Changed $169,000 Beaches MLS
- 2018-03-08 Relisted — Beaches MLS
- 2017-12-22 Listing Removed — Beaches MLS
- 2017-10-31 Listed $159,900 Beaches MLS
- 2002-04-29 Listing Removed — Beaches MLS
- 1999-08-24 Sold (Public Records) $65,000 Public Records
- 1999-07-14 Listed $68,999 Beaches MLS
- 1998-04-03 Listing Removed — Beaches MLS
- 1997-08-13 Listed $69,999 Beaches MLS
- 1995-02-17 Sold (Public Records) $69,900 Public Records
Property tax history
+18.5%/yrLatest (2025): $5,259 · +2.3% YoY. Source: county tax records.
Cash-flow waterfall
monthlySold comps — $/sqft
last 12 mo · ≤1 miLoading sold comps…