 Fourplex
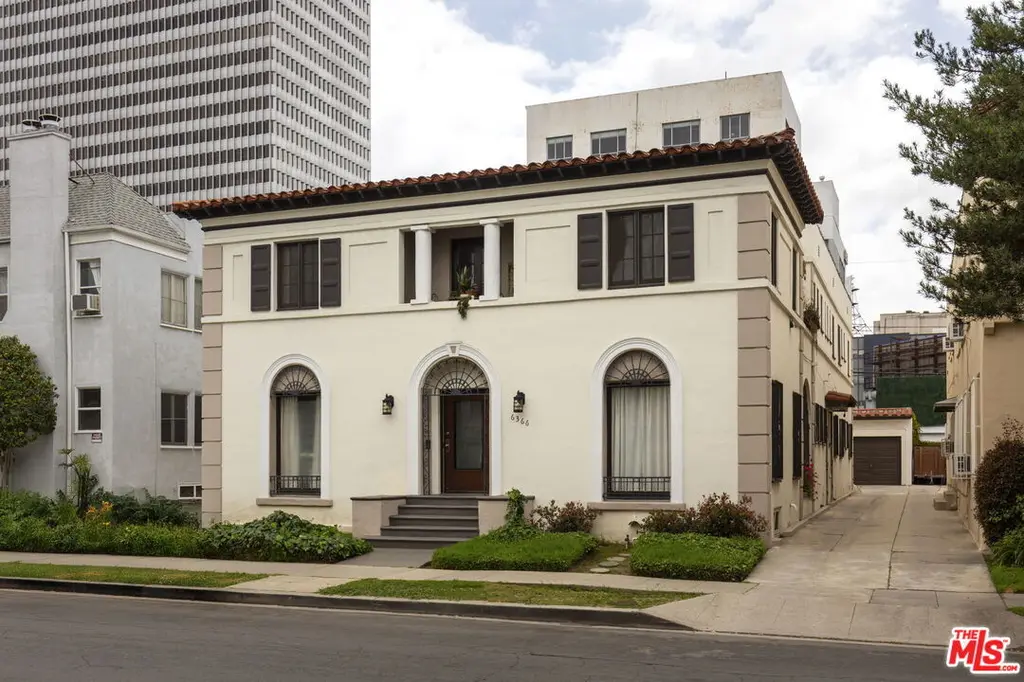
6366 Orange St · Los Angeles, CA
Flood risk 1/10 · Minimal
- FEMA flood zone
- X (unshaded)
- Chance of flooding over 30 yrs
- 0.0%
- Est. flood insurance / yr
- $507 – $1,088
Fire risk 1/10 · Minimal
- Est. fire insurance / yr
- $659 – $1,223
Heat risk 6/10 · Moderate
- Hot days now (above 88°F)
- 7 days/yr
- Hot days in 30 yrs
- 21 days/yr
Wind risk 1/10 · Minimal
- Chance of severe wind over 30 yrs
- —
Air-quality risk 5/10 · Moderate
- Unhealthy air days now
- 7 days/yr
- Unhealthy air days in 30 yrs
- 7 days/yr
Risk factors via First Street. Map © Google.
Why this score? — see what drove the D grade
The composite is a weighted blend of 9 inputs, each scored 0–100. Each bar is that input's sub-score; the figure is the points it added to the 100-point composite (weight × sub-score).
- Cash flow +10.5/30.0
- Appreciation +8.1/10.0
- ARV discount +6.2/15.0
- Schools +3.6/10.0
- Livability +3.4/5.0
- 1% rule +3.1/10.0
- DSCR +3.0/10.0
- Rent growth +2.5/5.0
- Condition / age +2.5/5.0
$2,000,000
🖨 Deal sheet (PDF) 📄 Offer letter ✓ Due diligence
Multi-family units
County records classify this as Multi-Family (2-4 Unit). Listing-text estimate: 4 units. confirmed
Listing remarks MLS
In the same family for 73 years and proudly standing tall for nearly 100 years in the highly acclaimed Beverly Grove neighborhood, this pedigree Italian Renaissance-style fourplex is both a testament and a love letter to early Los Angeles architecture. Designed by Architect Horatio Bishop, most notable as a leading pioneer architect of Cathay Circle, the property boasts a commanding yet romantic curb appeal that is further enhanced by its perfect positioning on a tree-lined street, full of character rich historic properties. Available for the first time in decades, the current stewards of the property have undergone a meticulous, multi-year restoration, striking the impeccable balance of original historical charm and modern amenities that today's tenants desire. Upon arrival, an elegant entry displays period-correct terracotta & hand-painted tiles, original lights, historic doors, and rod iron details throughout. Comprising four generously sized two-bedroom, one-bathroom units, each offers charming kitchens, Art Deco bathrooms, hardwood floors, and stunning casement windows with alluring features such as in-unit washer/dryer hookups and patios or balconies. Other capital improvements include a copper re-pipe and newer interior & exterior paint. Boasting a walk-score of 80, tenants of the community will enjoy nearby amenities such as Whole Foods, The Grove, LACMA, The Peterson Museum, Beverly Center, and & The El Rey Theater. The location also offers close proximity to public transportation, including the future Metro Purple Line Extension, which will provide access to both the West Side and Downtown Los Angeles (DTLA). The offering at 6366 Orange Street is a legacy transfer decades in the making.
Key facts
- 6,252 sq ft lot
- Garage
- Built 1929
Neighborhood map
What this means for you Summary
Snapshot
- This is a 4 × 2-bed/1.0-bath units multifamily listed at $2.00M.
Deal economics
- At list price, monthly cash flow is $-1k ($-12k/yr) — negative. Per door: $-252/mo.
- To cash-flow at today's rent, offer at most $1.85M (7.3% below list).
- To meet the 1% rule (rent ≥ 1% of price), the offer needs to be $1.62M (18.9% below list).
- Recommended offer: $1.62M (18.9% below list) — sets the bar for 1% rule.
- Cap rate 5.7% vs local median 2.1% in Los Angeles — top-decile yield for the area; either an underpriced asset or a hidden risk that comps aren't pricing in. Stress-test before assuming the spread holds.
Location & tenants
- Location reads 68/100 on livability (#273 in CA) — a middle-class / working-renter tenant base. Strengths: amenities A+, commute A+, employment B; Watch: health & safety C-, crime F, cost of living F.
- Los Angeles Unified (urban): math 29% / reading 54% proficiency, ranked #223 of 517 in CA (top 43%) — families likely to look elsewhere, expect single-tenant / working-renter base with shorter leases; 67% free/reduced lunch — lower-income household profile, screen leases tightly.
- Zoned schools: Hancock Park Elementary (510 students, 32% FRL); John Burroughs Middle (reading 39%, 1,373 students, 82% FRL); Fairfax Senior High (math 40% / reading 61%, grade D+, #324 of 1,170 statewide, top 28%, 1,632 students, 81% FRL) — zoned schools at 65% FRL track the district average.
- Market conditions: Rents flat; 122 active listings in the ZIP; solid renter incomes; 19,697 units permitted in Los Angeles County in 2024 (9,426 in 5+ unit buildings).
- At $16,220/mo this rent would consume 188% of the median local household income ($103k/yr) (locally 2888% of renters already pay >50% of income on rent) — very limited rent-growth headroom before tenants either downsize or default.
Forward outlook
- In year one you build about $139k of equity ($14k loan paydown + $125k appreciation (6.2% local appreciation)).
- Los Angeles County population projected at +9% by 2050 — modest demand growth; plan on rents tracking national, not racing it.
- By year 2, paydown + projected appreciation supports a ~$222k cash-out refi (75% LTV) — recoverable capital for the next deal without selling this one.
Negotiation context
- It's been on market 65 days — a 6% lower offer ($1.88M) is reasonable based on typical stale-listing flexibility.
- 3 sale attempts with the ask held roughly flat each time — persistent listings suggest the price (not the market) is what's stuck; bring a comps-based counter.
Risks & watch-outs
- Watch-outs: built in 1929 — expect roof / HVAC / electrical / plumbing capex.
- Climate carrying-cost: extreme-heat days projected 7→21/yr by 2055 (HVAC capex compounding) — expect insurance premiums to compound above CPI over the hold.
Questions for the listing agent
- What do current leases actually rent for vs. the listed asking? Can we see a recent rent roll and the last 12 months of T-12 income?
- It's been on market 65 days. Have you received any prior offers? Is the seller open to a 19% concession, seller financing, or rate buy-down credit?
- Can we see the unit-by-unit rent roll, current vacancy, and any below-market leases? What's the average tenancy length?
- What capital expenditures (roof, boiler, parking lot, exteriors) have been made in the last 5 years, and what's planned in the next 2?
- Built in 1929 — when were the roof, HVAC, electrical panel, plumbing, and water heater last replaced?
- Why hasn't it sold? Are there any deal-killer items the seller is aware of (foundation, flood, title, zoning, code violations)?
- Is there a deadline driving the sale (1031 exchange, divorce, estate, relocation)? That informs how much negotiation room exists.
- Schools are D-rated, which usually means shorter tenancies and higher turnover. Who's the typical renter profile here, and what's been the actual vacancy rate?
- Crime grade is F in this area — have there been break-ins, vandalism, or insurance claims at this property in the last 3 years? What carrier currently insures it and at what premium?
- The area grade is low — what's the realistic commute time and amenity access for the typical tenant pool here? Any planned neighborhood developments (good or bad) we should know about?
- What's the average days-on-market for RENTAL listings here right now (not sales)? A rising rental-DOM trend means longer vacancies and softer asking-rent achievability than the comps imply.
- What's the recent tenant-quality profile in this submarket — average credit score on applications, eviction rate, late-payment / NSF rate, and stable-employment percentage? A property-management company in the area should have these aggregated.
- How much new apartment / multifamily construction is in the pipeline within 1–3 miles? Heavy new supply (>2% of stock underway) typically softens rents 12–24 months out; light construction supports rent growth.
Investment metrics
- 1% rule
- 0.81% ✗
- Cap rate
- 5.69%
- Cash-on-cash
- -2.16%
- DSCR
- 0.90
- GRM
- 10.3
CMA / ARV
- ARV (median comp)
- $1,942,787
- List price
- $2,000,000
- Delta
- 2.94%
- Verdict
- FAIR
- Comps
- 20 within 1.0 mi
Show comp detail 3 sales within ~0.75 mi
| Address | Dist | Beds/Ba | Sqft | Sold | Price | $/sf | Match |
|---|---|---|---|---|---|---|---|
| 6356 Orange St | 0.02mi | 8/4.0 | 5,426 (-4%) | 3mo | $1,520,000 | $280 | 89 |
| 924 S Orange Grove Ave | 0.50mi | 8/4.5 | 5,395 (-5%) | 11mo | $2,120,000 | $393 | 57 |
| 100 N Kings Rd | 0.74mi | 8/6.0 | 5,003 (-12%) | 18mo | $2,300,000 | $460 | 23 |
Match score weights: distance 35% · size 25% · config 20% · recency 20%. Top-matched comps best support the ARV.
Projected returns pro-forma
6.25% appreciation · 0.14% rent growth · sell at horizon
- IRR
- 13.1%
- Equity multiple
- 1.89×
- Total profit
- $497,262
- Equity at exit
- $1,288,276
- IRR
- 12.8%
- Equity multiple
- 3.54×
- Total profit
- $1,424,191
- Equity at exit
- $2,363,456
Cash invested: $560,000 (down + closing). Projections, not guarantees.
Landlord ↔ Tenant lean methodology
- Overall (CITY)
- 0 Strongly Tenant-Friendly
- State California
- 18 Strongly Tenant-Friendly · D+13
- County
- — inherits STATE
- City Los Angeles
- 0 Strongly Tenant-Friendly · D+22
ZIP-level market 90048
- Home prices YoY
- 1.3%
- Rents YoY
- 0.1%
- Active inventory
- 122
- Price-to-rent
- 41.1×
Monthly cashflow live
- Estimated rent
- $16,220 high interval (Pro) →
- Mortgage (P&I)
- −$10,488
- Tax est. 1.5%
- −$2,500 /mo · $30,000/yr
- Insurance
- −$833
- HOA
- −$0
- Vacancy / Maint / Mgmt
- −$3,406
- Net cashflow
- $-1,008
Break-even live
Sensitivity live
| Price | -10% $374 | -5% $-317 | +0% $-1,008 | +5% $-1,699 | +10% $-2,390 |
|---|---|---|---|---|---|
| Rent | -10% $-2,289 | -5% $-1,648 | +0% $-1,008 | +5% $-367 | +10% $274 |
| Rate | -1.0pp $-1 | -0.5pp $-499 | base $-1,008 | +0.5pp $-1,526 | +1.0pp $-2,053 |
4-unit breakdown (identical units grouped — click to expand)
| Units | Beds | Baths | Est. rent |
|---|---|---|---|
| 4× units | 2 | 1 | $16,220 |
| #1 | 2 | 1 | $4,055 |
| #2 | 2 | 1 | $4,055 |
| #3 | 2 | 1 | $4,055 |
| #4 | 2 | 1 | $4,055 |
| Total (4 units) | $16,220 | ||
UW: 25.0% down · 7.5% · 30yr · 1.5% tax · 5.0% vac · 8.0% maint · 8.0% mgmt
Financing live
Cash to close
- Down payment
- $500,000
- Closing costs
- $60,000
- Reserves months
- —
- Total cash needed
- —
Loan-product check · same deal, 3 products live
Conventional
25% down · 7.5% · 30yr
- Down + closing
- —
- Monthly P&I
- —
- Monthly cashflow
- —
- DSCR
- —
- Eligible?
- —
Personal DTI + credit; lowest rate.
DSCR
20% down · 8.5% · 30yr
- Down + closing
- —
- Monthly P&I
- —
- Monthly cashflow
- —
- DSCR
- —
- Eligible?
- —
No personal income docs; deal must DSCR.
Hard money
10% down · 12.0% · 12mo
- Down + closing
- —
- Monthly P&I
- —
- Monthly cashflow
- —
- DSCR
- —
- Eligible?
- —
Short-term bridge; refi at stabilization.
Listing history 18 events
-
2026-06-21days on market $2,000,000 Active 65 DOM
-
2026-06-18days on market $2,000,000 Active 62 DOM
-
2026-06-17days on market $2,000,000 Active 61 DOM
-
2026-06-16days on market $2,000,000 Active 60 DOM
-
2026-06-15days on market $2,000,000 Active 59 DOM
-
2026-06-13days on market $2,000,000 Active 57 DOM
-
2026-06-09days on market $2,000,000 Active 53 DOM
-
2026-06-08days on market $2,000,000 Active 52 DOM
-
2026-06-07days on market $2,000,000 Active 51 DOM
-
2026-06-04days on market $2,000,000 Active 48 DOM
-
2026-06-03days on market $2,000,000 Active 47 DOM
-
2026-06-02days on market $2,000,000 Active 46 DOM
-
2026-06-01days on market $2,000,000 Active 45 DOM
-
2026-05-31days on market $2,000,000 Active 44 DOM
-
2026-04-17$2,000,000 Active 1743-char remark
Show marketing remark (1743 chars)
In the same family for 73 years and proudly standing tall for nearly 100 years in the highly acclaimed Beverly Grove neighborhood, this pedigree Italian Renaissance-style fourplex is both a testament and a love letter to early Los Angeles architecture. Designed by Architect Horatio Bishop, most notable as a leading pioneer architect of Cathay Circle, the property boasts a commanding yet romantic curb appeal that is further enhanced by its perfect positioning on a tree-lined street, full of character rich historic properties. Available for the first time in decades, the current stewards of the property have undergone a meticulous, multi-year restoration, striking the impeccable balance of original historical charm and modern amenities that today's tenants desire. Upon arrival, an elegant entry displays period-correct terracotta & hand-painted tiles, original lights, historic doors, and rod iron details throughout. Comprising four generously sized two-bedroom, one-bathroom units, each offers charming kitchens, Art Deco bathrooms, hardwood floors, and stunning casement windows with alluring features such as in-unit washer/dryer hookups and patios or balconies. Other capital improvements include a copper re-pipe and newer interior & exterior paint. Boasting a walk-score of 80, tenants of the community will enjoy nearby amenities such as Whole Foods, The Grove, LACMA, The Peterson Museum, Beverly Center, and & The El Rey Theater. The location also offers close proximity to public transportation, including the future Metro Purple Line Extension, which will provide access to both the West Side and Downtown Los Angeles (DTLA). The offering at 6366 Orange Street is a legacy transfer decades in the making.
-
2025-10-17Active
-
2025-09-15price
-
2025-06-06Active
ⓘ Source: listings_history table (triggers on properties + properties_extension) + one-shot
backfill from property_details.listing_events for pre-trigger history.
Climate risk First Street
- Flood 1/10 Low FEMA zone X (unshaded) · 0% chance over 30 yrs
- Wildfire 1/10 Low
- Heat 6/10 Major 7 d/yr ≥88°F today · 21 d/yr by 30 yrs out
- Wind 1/10 Low
- Air quality 5/10 Major 7 unhealthy d/yr today · 7 by 30 yrs out
Nearby sold comps map
Loading sold comps map…
Walkable amenities ~0.75 mi
Loading nearby amenities…
Taxation est. · year 1
- Rental income
- $194,640
- − Mortgage interest
- −$112,031
- − Property taxes
- −$30,000
- − Insurance
- −$10,000
- − Repairs & maintenance
- −$15,571
- − Management
- −$15,571
- − Depreciation
- −$58,182
- Taxable loss
- −$46,715
- Est. tax savings @ 24.0%
- +$11,212
- After-tax cash flow
- $-881/yr
For passive investors: Depreciation is non-cash, so a rental often shows a tax loss while cash-flowing — sheltering income. Rental losses are passive: they offset passive income freely, and up to $25,000/yr can offset ordinary (W-2) income if you actively participate and your MAGI is under $100k (phasing out to $0 by $150k); unused losses carry forward. On sale, claimed depreciation is recaptured at up to 25%, and gains may owe capital-gains tax (a 1031 exchange can defer both). Figures are a year-1 estimate at your 24.0% rate — not tax advice; consult a CPA.
Schools (NCES district)
- District
- Los Angeles Unified
- NCES district ID
- 0622710
- Math proficiency
- 29% ▼ -4.00%
- Reading proficiency
- 54% ▲ 10.00%
- Median HH income
- $50,403
- Composite
- 35.67/100
- National rank
- #4875
- State rank
- #223 of 517 in CA
Livability — Los Angeles
- Score
- 68/100
- State rank
- #273
- US rank
- #9237
Category grades
Schools grade is shown separately in the Schools card above.
Census & demographics
- Census place
- Los Angeles, CA
- County
- Los Angeles County · 9,444,647 people
- City population
- 3,838,149
- Metro
- Los Angeles-Long Beach-Anaheim, CA
- Population (ZIP)
- 21,476
- Household income
- $103,495
- Rent vs Own
- Severe rent burden
- 2888.0
Population outlook (Los Angeles County) Hauer SSP2
- Today (2025)
- 10,940,515 people
- By 2030
- 11,256,481 · +2.9%
- By 2040
- 11,729,929 · +7.2%
- By 2050
- 11,948,407 · +9.2%
- By 2075
- 11,818,114 · +8.0%
- By 2100
- 10,842,928 · -0.9%
Race, ethnicity, and origin ACS 2023
- Neighborhood character
- Predominantly White (73%)
- Race & ethnicity
- White 73% Two or more races 9% Asian 8% Hispanic / Latino 8% Black 5%
- Hispanic origin (detail)
- Mexican 3%
- Common ancestry
- Romanian 5% Scotch-Irish 4% Lithuanian 3%
- Foreign-born
- 27% · Canada, China, South Korea
- Languages at home
- 74% English-only · Other Indo-European 7% Spanish 5% Russian/Polish/Slavic 2%
Political lean MEDSL · Los Angeles
- 2024 margin
- Solid D (+32.9) · D 64.8% · R 31.9% · Other 3.3%
- 2008→2024 swing
- -7.4pp toward R · 2008: 40.4pp · 2024: 32.9pp
- All cycles
- 2024: D+32.9 2020: D+44.2 2016: D+48.0 2012: D+40.0 2008: D+40.4
Not yet ingested
- Civics
- —
Market trends
- HPI YoY
- ▲ 6.25%
- Current HPI
- 500.5893
- Rent YoY
- ▲ 0.14%
- Metro
- Los Angeles-Long Beach-Anaheim, CA
- State GDP YoY
- ▲ 3.21%
- F500 in state
- 116
Industry mix (Fortune 500 HQ in CA)
| Industry | F500 HQs | Revenue |
|---|---|---|
| Technology | 27 | $1,492B |
|
||
| Financial Services | 3 | $174B |
|
||
| Retail | 3 | $44B |
|
||
| Insurance | 3 | $26B |
|
||
| Media / Entertainment | 2 | $115B |
|
||
| Pharmaceuticals / Biotech | 2 | $62B |
|
||
Price history
4 events — show timeline
- 2026-04-17 Listed $2,000,000 TheMLS
- 2025-10-17 Listed — TheMLS
- 2025-09-15 Price Changed — TheMLS
- 2025-06-06 Listed — TheMLS
Property tax history
+1.9%/yrLatest (2025): $2,927 · +3.7% YoY. Source: county tax records.
Cash-flow waterfall
monthlySold comps — $/sqft
last 12 mo · ≤1 miLoading sold comps…