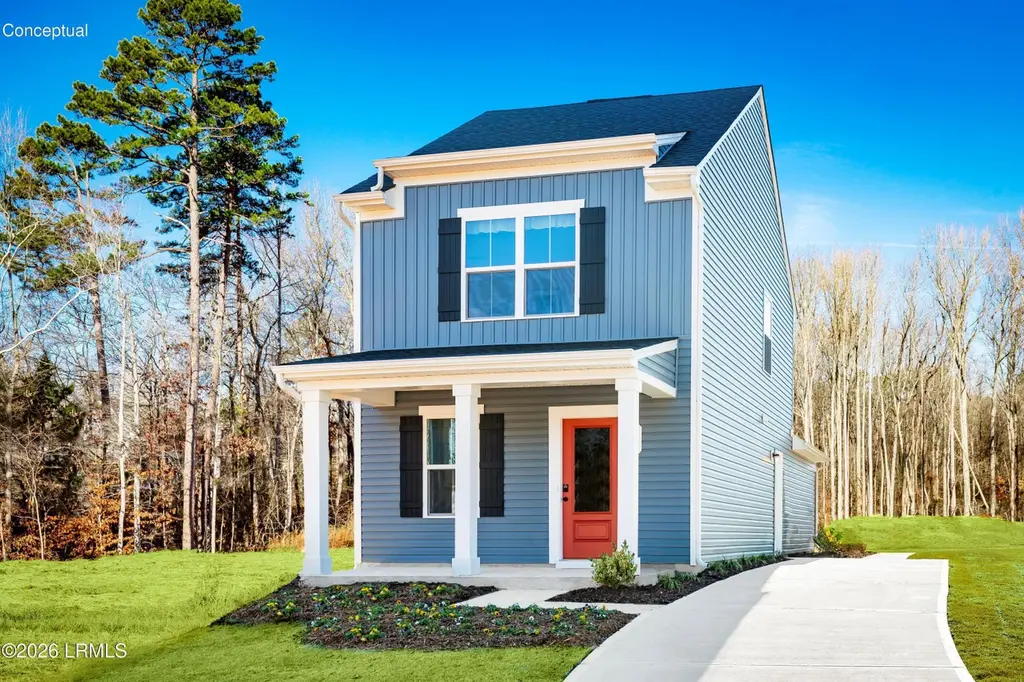
175 Castle St · Hardeeville, SC
Flood risk No data
- FEMA flood zone
- —
- Chance of flooding over 30 yrs
- —
- Est. flood insurance / yr
- —
Fire risk No data
- Est. fire insurance / yr
- —
Heat risk No data
- Hot days now (above threshold)
- —
- Hot days in 30 yrs
- —
Wind risk No data
- Chance of severe wind over 30 yrs
- —
Air-quality risk No data
- Unhealthy air days now
- —
- Unhealthy air days in 30 yrs
- —
Risk factors via First Street. Map © Google.
Why this score? — see what drove the D- grade
The composite is a weighted blend of 9 inputs, each scored 0–100. Each bar is that input's sub-score; the figure is the points it added to the 100-point composite (weight × sub-score).
- Appreciation +10.0/10.0
- Cash flow +8.0/30.0
- ARV discount +7.5/15.0
- Livability +3.2/5.0
- Condition / age +2.5/5.0
- DSCR +2.1/10.0
- Rent growth +2.1/5.0
- Schools +1.4/10.0
- 1% rule +1.1/10.0
$297,990
🖨 Deal sheet (PDF) 📄 Offer letter ✓ Due diligence
Listing remarks
* * This home is TO BE BUILT * * The Reese floor plan in Royal Oaks offers effortless main-level living with an open-concept layout connecting the great room and gourmet kitchen with a center island. A first-floor owner's suite features a walk-in closet and en suite bath, while two upstairs bedrooms also include walk-in closets and share a full bath. Relax on the inviting front porch or take advantage of the community pool. Conveniently located between Savannah and Bluffton, this coastal home includes ALL GE appliances, all exterior lawn maintenance, a community pool, and a 3-year membership to the Hardeeville Rec Center! Your new home is waiting in Royal Oaks!
Key facts
- Community pool
- Walk-in closet
- Gourmet kitchen
Tags
Property features AI
Finance
- Other: Parcel: 029-46a-10-127
- HOA & community: HOA/POA fee applies
Exterior
- Parking: No attached garage
- Security: Smoke detector(s)
- Utilities: Public sewer
- Home design: Frame construction with vinyl siding; Slab foundation
- Construction: Frame and vinyl siding construction; Slab foundation
- Exterior features: Lawn maintenance; Community pool; Residential zoning
Interior
- Kitchen: Dishwasher; Disposal; Microwave; Refrigerator
- Bathrooms: 2 full bathrooms and 1 half bathroom (3 total)
- Heating & cooling: Natural gas heating; Central electric air conditioning
- Interior features: Smoke detectors
- Laundry & utility: Washer and dryer included
Neighborhood map
What this means for you Summary
Snapshot
- This is a 3-bed/2.5-bath land listed at $298k.
Deal economics
- At list price, monthly cash flow is $-302 ($-4k/yr) — negative.
- To cash-flow at today's rent, offer at most $245k (17.9% below list).
- To meet the 1% rule (rent ≥ 1% of price), the offer needs to be $182k (39.0% below list).
- Recommended offer: $182k (39.0% below list) — sets the bar for 1% rule.
- Cap rate 5.1% vs local median 3.6% in Hardeeville — top-decile yield for the area; either an underpriced asset or a hidden risk that comps aren't pricing in. Stress-test before assuming the spread holds.
Location & tenants
- Location reads 65/100 on livability (#136 in SC) — a middle-class / working-renter tenant base. Strengths: health & safety A+, crime B+, housing B+; Watch: schools F, amenities F, commute F.
- Jasper 01 (rural): math 12% / reading 22% proficiency, ranked #77 of 80 in SC (top 96%) — low school quality limits family demand, transient renter base, plan for 1-2y turnover; 78% free/reduced lunch — lower-income household profile, screen leases tightly.
- Market conditions: Rents soft (-1.7%/yr); 503 active listings in the ZIP; 2 comparable units currently listed for rent nearby; 1,385 units permitted in Jasper County in 2024 (0 in 5+ unit buildings).
Forward outlook
- In year one you build about $32k of equity ($2k loan paydown + $30k appreciation (10.0% local appreciation)).
- Jasper County population projected at +46% by 2050 — long-run rental-demand tailwind backs the buy-and-hold thesis.
- By year 2, paydown + projected appreciation supports a ~$51k cash-out refi (75% LTV) — recoverable capital for the next deal without selling this one.
Negotiation context
- It's been on market 65 days — a 6% lower offer ($280k) is reasonable based on typical stale-listing flexibility.
Questions for the listing agent
- What do current leases actually rent for vs. the listed asking? Can we see a recent rent roll and the last 12 months of T-12 income?
- It's been on market 65 days. Have you received any prior offers? Is the seller open to a 39% concession, seller financing, or rate buy-down credit?
- Why hasn't it sold? Are there any deal-killer items the seller is aware of (foundation, flood, title, zoning, code violations)?
- Is there a deadline driving the sale (1031 exchange, divorce, estate, relocation)? That informs how much negotiation room exists.
- Schools are F-rated, which usually means shorter tenancies and higher turnover. Who's the typical renter profile here, and what's been the actual vacancy rate?
- The area grade is low — what's the realistic commute time and amenity access for the typical tenant pool here? Any planned neighborhood developments (good or bad) we should know about?
- What's the average days-on-market for RENTAL listings here right now (not sales)? A rising rental-DOM trend means longer vacancies and softer asking-rent achievability than the comps imply.
- What's the recent tenant-quality profile in this submarket — average credit score on applications, eviction rate, late-payment / NSF rate, and stable-employment percentage? A property-management company in the area should have these aggregated.
- How much new for-sale + rental construction is in the pipeline within 1–3 miles? Heavy new supply typically softens prices + rents 12–24 months out; constrained supply supports both.
Investment metrics
- 1% rule
- 0.61% ✗
- Cap rate
- 5.08%
- Cash-on-cash
- -4.35%
- DSCR
- 0.81
- GRM
- 13.7
CMA / ARV
No comps found within radius.
Projected returns pro-forma
10.0% appreciation · 0.0% rent growth · sell at horizon
- IRR
- 20.5%
- Equity multiple
- 2.65×
- Total profit
- $137,547
- Equity at exit
- $268,453
- IRR
- 18.2%
- Equity multiple
- 5.92×
- Total profit
- $410,308
- Equity at exit
- $578,929
Cash invested: $83,437 (down + closing). Projections, not guarantees.
Landlord ↔ Tenant lean methodology
- Overall (STATE)
- 90 Strongly Landlord-Friendly
- State South Carolina
- 90 Strongly Landlord-Friendly · R+6
- County
- — inherits STATE
- City
- — inherits STATE
ZIP-level market 29927
- Home prices YoY
- 18.8%
- Rents YoY
- -1.7%
- Active inventory
- 503
- Price-to-rent
- 13.7×
Monthly cashflow live
- Estimated rent
- $1,819 medium interval (Pro) →
- Mortgage (P&I)
- −$1,563
- Tax from tax record
- −$52 /mo · $625/yr
- Insurance
- −$124
- HOA
- −$0
- Vacancy / Maint / Mgmt
- −$382
- Net cashflow
- $-302
Break-even live
Sensitivity live
| Price | -10% $-134 | -5% $-218 | +0% $-302 | +5% $-726 | +10% $-829 |
|---|---|---|---|---|---|
| Rent | -10% $-446 | -5% $-374 | +0% $-302 | +5% $-230 | +10% $-159 |
| Rate | -1.0pp $-152 | -0.5pp $-226 | base $-302 | +0.5pp $-379 | +1.0pp $-458 |
UW: 25.0% down · 7.5% · 30yr · 1.5% tax · 5.0% vac · 8.0% maint · 8.0% mgmt
Financing live
Cash to close
- Down payment
- $74,498
- Closing costs
- $8,940
- Reserves months
- —
- Total cash needed
- —
Loan-product check · same deal, 3 products live
Conventional
25% down · 7.5% · 30yr
- Down + closing
- —
- Monthly P&I
- —
- Monthly cashflow
- —
- DSCR
- —
- Eligible?
- —
Personal DTI + credit; lowest rate.
DSCR
20% down · 8.5% · 30yr
- Down + closing
- —
- Monthly P&I
- —
- Monthly cashflow
- —
- DSCR
- —
- Eligible?
- —
No personal income docs; deal must DSCR.
Hard money
10% down · 12.0% · 12mo
- Down + closing
- —
- Monthly P&I
- —
- Monthly cashflow
- —
- DSCR
- —
- Eligible?
- —
Short-term bridge; refi at stabilization.
Rent comps 2 comps
| Address | Beds | Baths | Sqft | Rent | $/sqft | DOM | Units | Dist |
|---|---|---|---|---|---|---|---|---|
| 118 Garr Ln Unit F-102 Hardeeville, SC | 3.0 | 1.0 | 1100 | $1,545 | $1.40 | 22d | 1 | 0.51mi |
| 47 Thatcher Rd Hardeeville, SC | 1.0–4.0 | 1.0–2.5 | 1127 | $1,067 | $0.95 | 14d | 2 | 1.30mi |
Listing history 17 events
-
2026-06-18days on market $297,990 Active 65 DOM
-
2026-06-17days on market $297,990 Active 64 DOM
-
2026-06-16days on market $297,990 Active 63 DOM
-
2026-06-15days on market $297,990 Active 62 DOM
-
2026-06-14days on market $297,990 Active 60 DOM
-
2026-06-13days on market $297,990 Active 59 DOM
-
2026-06-10days on market $297,990 Active 57 DOM
-
2026-06-09days on market $297,990 Active 56 DOM
-
2026-06-08days on market $297,990 Active 55 DOM
-
2026-06-07days on market $297,990 Active 54 DOM
-
2026-06-03days on market $297,990 Active 50 DOM
-
2026-06-02days on market $297,990 Active 49 DOM
-
2026-06-01days on market $297,990 Active 48 DOM
-
2026-05-31days on market $297,990 Active 47 DOM
-
2026-05-30days on market $297,990 Active 46 DOM
-
2026-05-20price $297,990
-
2026-04-14$299,990 Active
ⓘ Source: listings_history table (triggers on properties + properties_extension) + one-shot
backfill from property_details.listing_events for pre-trigger history.
Tax reassessment forecast SC · Resets to sale price
- Current annual tax
- $625 · $52/mo
- Projected year-2 tax
- $1,699 · $142/mo
- Expected delta
- +$1,073/yr (+$89/mo · 171.7%)
ⓘ Screening estimate from a state-policy table — verify with the county assessor before closing.
Nearby sold comps map
Loading sold comps map…
Walkable amenities ~0.75 mi
Loading nearby amenities…
Taxation est. · year 1
- Rental income
- $21,824
- − Mortgage interest
- −$16,692
- − Property taxes
- −$625
- − Insurance
- −$1,490
- − Repairs & maintenance
- −$1,746
- − Management
- −$1,746
- − Depreciation
- −$8,669
- Taxable loss
- −$9,144
- Est. tax savings @ 24.0%
- +$2,195
- After-tax cash flow
- $-1,432/yr
For passive investors: Depreciation is non-cash, so a rental often shows a tax loss while cash-flowing — sheltering income. Rental losses are passive: they offset passive income freely, and up to $25,000/yr can offset ordinary (W-2) income if you actively participate and your MAGI is under $100k (phasing out to $0 by $150k); unused losses carry forward. On sale, claimed depreciation is recaptured at up to 25%, and gains may owe capital-gains tax (a 1031 exchange can defer both). Figures are a year-1 estimate at your 24.0% rate — not tax advice; consult a CPA.
Schools (NCES district)
- District
- Jasper 01
- NCES district ID
- 4502520
- Math proficiency
- 12% ▼ -11.00%
- Reading proficiency
- 22% ▼ -5.00%
- Median HH income
- $37,878
- Composite
- 14.23/100
- National rank
- #9450
- State rank
- #77 of 80 in SC
Livability — Hardeeville
- Score
- 65/100
- State rank
- #136
- US rank
- #13105
Category grades
Schools grade is shown separately in the Schools card above.
Census & demographics
- Census place
- Hardeeville, SC
- County
- Jasper County · 26,362 people
- City population
- 11,373
- Metro
- Hilton Head Island-Bluffton, SC
- Population (ZIP)
- 11,373
- Household income
- $72,821
- Rent vs Own
- Severe rent burden
- 337.0
Population outlook (Jasper County) Hauer SSP2
- Today (2025)
- 34,428 people
- By 2030
- 37,718 · +9.6%
- By 2040
- 44,061 · +28.0%
- By 2050
- 50,302 · +46.1%
- By 2075
- 66,869 · +94.2%
- By 2100
- 110,455 · +220.8%
Race, ethnicity, and origin ACS 2023
- Neighborhood character
- Diverse neighborhood (Simpson 0.68)
- Race & ethnicity
- White 41% Hispanic / Latino 29% Black 27% Two or more races 14%
- Hispanic origin (detail)
- Mexican 14% Puerto Rican 3%
- Common ancestry
- Iranian 2% Slovak 2% Romanian 1%
- Foreign-born
- 16% · Canada, Jamaica
- Languages at home
- 71% English-only · Spanish 26% Russian/Polish/Slavic 1%
Political lean MEDSL · Jasper
- 2024 margin
- Lean R (+9.6) · D 44.7% · R 54.3% · Other 1.0%
- 2008→2024 swing
- -32.5pp toward R · 2008: 22.9pp · 2024: -9.6pp
- All cycles
- 2024: R+9.6 2020: D+0.8 2016: D+11.9 2012: D+15.6 2008: D+22.9
Not yet ingested
- Civics
- —
Market trends
- HPI YoY
- ▲ 60.81%
- Current HPI
- 384.6071
- Rent YoY
- ▼ -1.68%
- Metro
- Hilton Head Island-Bluffton, SC
- State GDP YoY
- ▲ 4.51%
- F500 in state
- 2
Industry mix (Fortune 500 HQ in SC)
| Industry | F500 HQs | Revenue |
|---|---|---|
| Packaging | 1 | $7B |
|
||
Price history
-0.7% since first listed2 events — show timeline
- 2026-05-20 Price Changed $297,990 LRMLS
- 2026-04-14 Listed $299,990 LRMLS
Cash-flow waterfall
monthlySold comps — $/sqft
last 12 mo · ≤1 miLoading sold comps…