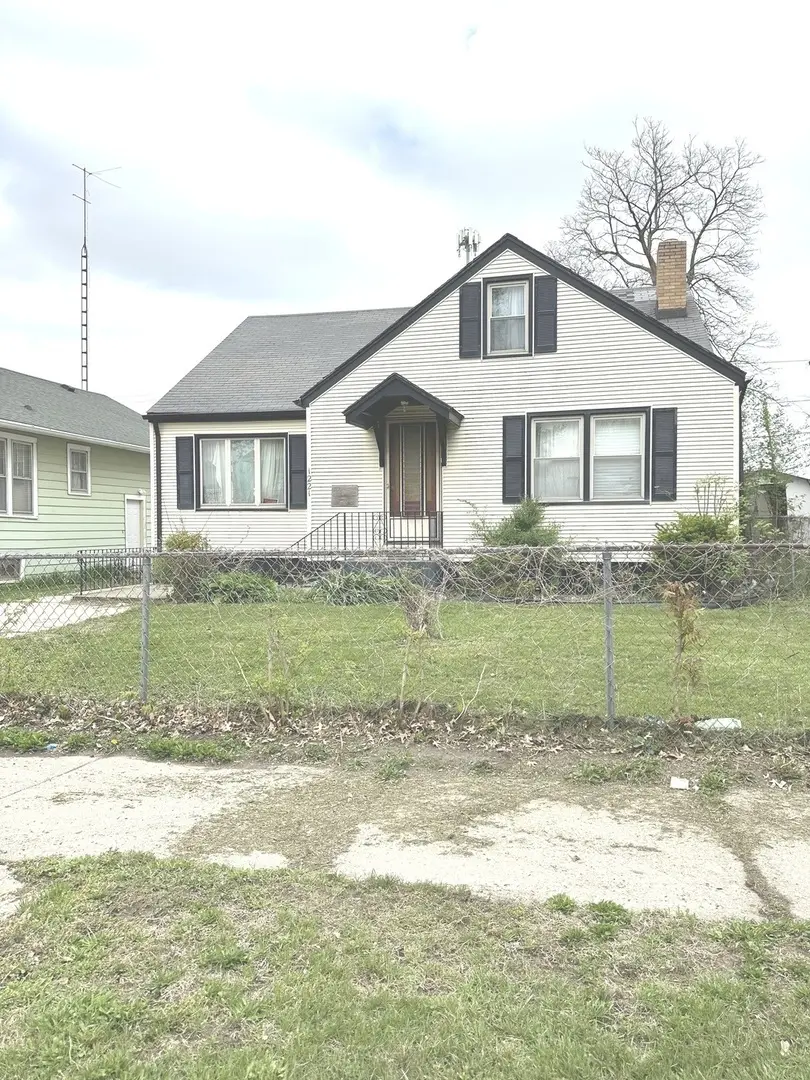
1221 E Chestnut St · Kankakee, IL
Flood risk 1/10 · Minimal
- FEMA flood zone
- X (unshaded)
- Chance of flooding over 30 yrs
- 0.0%
- Est. flood insurance / yr
- $473 – $860
Fire risk 1/10 · Minimal
- Est. fire insurance / yr
- $804 – $1,492
Heat risk 3/10 · Minor
- Hot days now (above 104°F)
- 7 days/yr
- Hot days in 30 yrs
- 16 days/yr
Wind risk 2/10 · Minimal
- Chance of severe wind over 30 yrs
- 1.0%
Air-quality risk 3/10 · Minor
- Unhealthy air days now
- 2 days/yr
- Unhealthy air days in 30 yrs
- 3 days/yr
Risk factors via First Street. Map © Google.
Why this score? — see what drove the C+ grade
The composite is a weighted blend of 9 inputs, each scored 0–100. Each bar is that input's sub-score; the figure is the points it added to the 100-point composite (weight × sub-score).
- Cash flow +30.0/30.0
- 1% rule +10.0/10.0
- DSCR +10.0/10.0
- Rent growth +3.6/5.0
- Livability +3.1/5.0
- Condition / age +2.5/5.0
- ARV discount +1.1/15.0
- Schools +0.8/10.0
- Appreciation +0.0/10.0
$79,585
🖨 Deal sheet 📄 Offer letter ✓ Due diligence
Listing remarks
I am pleased to share a new listing for a move-in ready 1.5-story gem. This property boasts 3 bedrooms, 1 bath, and 1,950 sq. ft. of living space with a full unfinished basement waiting for the right imagination. The home features a spacious living room, dining area, and den, plus an opportunity that is perfect for customization. An expansive 2.5-car garage completes this ideal home. Please note that the property is being sold as-is where is. Handyman special, move in and start the TLC. Don't miss out on this!!!
Key facts
- 5,625 sq ft lot
- 2 garage spots
- Built 1972
Property features AI
Finance
- Other: Parcel number on file
- Financial info: Special service area not required
- HOA & community: No master association fee required
Exterior
- Parking: Detached owned garage (2 garage spaces, 2 total parking spaces)
- Utilities: Public water; Public sewer
- Home design: Detached single-family home; 1.5-story design; Fee simple ownership; Built before 1978
- Construction: Vinyl siding exterior; Estimated age 51–60 years
- Exterior features: Lot dimensions approximately 45 x 125; Lot smaller than 0.25 acre; School bus service and commuter transit access
Interior
- Kitchen: Kitchen on main level
- Bedrooms: Three bedrooms (Master on main; one bedroom on main; one bedroom on second level)
- Flooring: Carpet in family room
- Bathrooms: One full bathroom; One half bathroom
- Heating & cooling: Natural gas heating
- Interior features: Seven total rooms; Unfinished full basement
- Laundry & utility: Laundry room
Neighborhood map
What this means for you Summary
Snapshot
- This is a 3-bed/1.5-bath other listed at $80k.
Deal economics
- At list price, monthly cash flow is $711 ($9k/yr) — positive.
- The deal already cash-flows at list — no discount required.
- Meets the 1% rule at list price ($2k rent vs $80k).
- Recommended offer: $77k (3.0% below list) — sets the bar for market timing.
- Cap rate 17.0% vs local median 5.8% in Kankakee — top-decile yield for the area; either an underpriced asset or a hidden risk that comps aren't pricing in. Stress-test before assuming the spread holds.
Location & tenants
- Location reads 62/100 on livability (#832 in IL) — a middle-class / working-renter tenant base. Strengths: commute A+, cost of living A+, housing A; Watch: schools F, crime F, amenities F.
- Kankakee SD 111 (urban): math 6% / reading 13% proficiency, ranked #584 of 620 in IL (top 94%) — low school quality limits family demand, transient renter base, plan for 1-2y turnover; 78% free/reduced lunch — lower-income household profile, screen leases tightly.
- Market conditions: Rents rising fast (+4.4%/yr); 115 active listings in the ZIP; 1 comparable units currently listed for rent nearby; 145 units permitted in Kankakee County in 2024 (5 in 5+ unit buildings).
- This rent runs 33% of the median local income ($58k/yr) — at the standard rent-burdened threshold; future hikes will face affordability resistance.
Forward outlook
- Local home prices are declining (-3.0%/yr); year-one equity from $550 of loan paydown is wiped out by about $2k of value loss. Plan a longer hold.
- Kankakee County population projected at -19% by 2050 — secular population decline; favor cash flow + early exit over multi-decade hold.
- At projected returns (-3.0% appreciation + 4.4% rent growth), your $22k cash investment doubles in ~3 years — after that, you're playing with house money.
Negotiation context
- It's been on market 52 days — a 3% lower offer ($77k) is reasonable based on typical stale-listing flexibility.
- 3 sale attempts; this cycle's ask has dropped $10k (11%) from the opening price — seller is motivated, your offer sets the floor, not the list.
Questions for the listing agent
- It's been on market 52 days. Have you received any prior offers? Is the seller open to a 3% concession, seller financing, or rate buy-down credit?
- Built in 1972 — when were the roof, HVAC, electrical panel, plumbing, and water heater last replaced?
- Is there a deadline driving the sale (1031 exchange, divorce, estate, relocation)? That informs how much negotiation room exists.
- Schools are F-rated, which usually means shorter tenancies and higher turnover. Who's the typical renter profile here, and what's been the actual vacancy rate?
- Crime grade is F in this area — have there been break-ins, vandalism, or insurance claims at this property in the last 3 years? What carrier currently insures it and at what premium?
- What's the average days-on-market for RENTAL listings here right now (not sales)? A rising rental-DOM trend means longer vacancies and softer asking-rent achievability than the comps imply.
- What's the recent tenant-quality profile in this submarket — average credit score on applications, eviction rate, late-payment / NSF rate, and stable-employment percentage? A property-management company in the area should have these aggregated.
- How much new for-sale + rental construction is in the pipeline within 1–3 miles? Heavy new supply typically softens prices + rents 12–24 months out; constrained supply supports both.
Investment metrics
- 1% rule
- 2.00% ✓
- Cap rate
- 17.01%
- Cash-on-cash
- 38.26%
- DSCR
- 2.70
- GRM
- 4.2
CMA / ARV
- ARV (median comp)
- $69,627
- List price
- $79,585
- Delta
- 14.30%
- Verdict
- OVERPRICED
- Comps
- 20 within 1.0 mi
Projected returns pro-forma
-3.0% appreciation · 4.38% rent growth · sell at horizon
- IRR
- 35.9%
- Equity multiple
- 2.55×
- Total profit
- $34,630
- Equity at exit
- $11,866
- IRR
- 43.3%
- Equity multiple
- 5.40×
- Total profit
- $98,006
- Equity at exit
- $6,881
Cash invested: $22,284 (down + closing). Projections, not guarantees.
Landlord ↔ Tenant lean methodology
- Overall (STATE)
- 43 Moderately Tenant-Leaning
- State Illinois
- 43 Moderately Tenant-Leaning · D+7
- County
- — inherits STATE
- City
- — inherits STATE
ZIP-level market 60901
- Home prices YoY
- -32.5%
- Rents YoY
- 4.4%
- Active inventory
- 115
- Price-to-rent
- 4.2×
Monthly cashflow live
- Estimated rent
- $1,596 medium interval (Pro) →
- Mortgage (P&I)
- −$417
- Tax est. 1.5%
- −$99 /mo · $1,194/yr
- Insurance
- −$33
- HOA
- −$0
- Vacancy / Maint / Mgmt
- −$335
- Net cashflow
- $711
Break-even live
UW: 25.0% down · 7.5% · 30yr · 1.5% tax · 5.0% vac · 8.0% maint · 8.0% mgmt
Financing live
Cash to close
- Down payment
- $19,896
- Closing costs
- $2,388
- Reserves months
- —
- Total cash needed
- —
Loan-product check · same deal, 3 products live
Conventional
25% down · 7.5% · 30yr
- Down + closing
- —
- Monthly P&I
- —
- Monthly cashflow
- —
- DSCR
- —
- Eligible?
- —
Personal DTI + credit; lowest rate.
DSCR
20% down · 8.5% · 30yr
- Down + closing
- —
- Monthly P&I
- —
- Monthly cashflow
- —
- DSCR
- —
- Eligible?
- —
No personal income docs; deal must DSCR.
Hard money
10% down · 12.0% · 12mo
- Down + closing
- —
- Monthly P&I
- —
- Monthly cashflow
- —
- DSCR
- —
- Eligible?
- —
Short-term bridge; refi at stabilization.
Rent comps 1 comps
| Address | Beds | Baths | Sqft | Rent | $/sqft | DOM | Units | Dist |
|---|---|---|---|---|---|---|---|---|
| 932 S Washington Ave Kankakee, IL | 4.0 | 1.5 | 2000 | $1,500 | $0.75 | 43d | 1 | 1.30mi |
Listing history 19 events
-
2026-06-15statusdays on market $79,585 Pending 52 DOM
-
2026-06-14days on market $79,585 Active 51 DOM
-
2026-06-13days on market $79,585 Active 50 DOM
-
2026-06-10days on market $79,585 Active 48 DOM
-
2026-06-09days on market $79,585 Active 47 DOM
-
2026-06-08days on market $79,585 Active 46 DOM
-
2026-06-07days on market $79,585 Active 45 DOM
-
2026-06-03days on market $79,585 Active 41 DOM
-
2026-06-02days on market $79,585 Active 40 DOM
-
2026-06-01days on market $79,585 Active 39 DOM
-
2026-05-31days on market $79,585 Active 38 DOM
-
2026-05-30days on market $79,585 Active 37 DOM
-
2026-05-15status Active 528-char remark
-
2026-05-15price $79,585 528-char remark
-
2026-05-07historical Contingent - Continue to Show 528-char remark
-
2026-04-23$89,585 Active 528-char remark
-
2026-04-21historical
-
2026-03-29price
-
2026-01-13Active
ⓘ Source: listings_history table (triggers on properties + properties_extension) + one-shot
backfill from property_details.listing_events for pre-trigger history.
Climate risk First Street
- Flood 1/10 Low FEMA zone X (unshaded) · 0% chance over 30 yrs
- Wildfire 1/10 Low
- Heat 3/10 Moderate 7 d/yr ≥104°F today · 16 d/yr by 30 yrs out
- Wind 2/10 Low 100% chance of damaging wind over 30 yrs
- Air quality 3/10 Moderate 2 unhealthy d/yr today · 3 by 30 yrs out
Nearby sold comps map
Loading sold comps map…
Walkable amenities ~0.75 mi
Loading nearby amenities…
Taxation est. · year 1
- Rental income
- $19,148
- − Mortgage interest
- −$4,458
- − Property taxes
- −$1,194
- − Insurance
- −$398
- − Repairs & maintenance
- −$1,532
- − Management
- −$1,532
- − Depreciation
- −$2,315
- Taxable income
- $7,719
- Est. tax owed @ 24.0%
- −$1,853
- After-tax cash flow
- $6,674/yr
For passive investors: Depreciation is non-cash, so a rental often shows a tax loss while cash-flowing — sheltering income. Rental losses are passive: they offset passive income freely, and up to $25,000/yr can offset ordinary (W-2) income if you actively participate and your MAGI is under $100k (phasing out to $0 by $150k); unused losses carry forward. On sale, claimed depreciation is recaptured at up to 25%, and gains may owe capital-gains tax (a 1031 exchange can defer both). Figures are a year-1 estimate at your 24.0% rate — not tax advice; consult a CPA.
Schools (NCES district)
- District
- Kankakee SD 111
- NCES district ID
- 1720760
- Math proficiency
- 6% ▼ -7.00%
- Reading proficiency
- 13% ▼ -6.00%
- Median HH income
- $37,968
- Composite
- 8.03/100
- National rank
- #9921
- State rank
- #584 of 620 in IL
Livability — Kankakee
- Score
- 62/100
- State rank
- #832
- US rank
- #16432
Category grades
Schools grade is shown separately in the Schools card above.
Census & demographics
- Census place
- Kankakee, IL
- County
- Kankakee County · 61,801 people
- City population
- 33,128
- Metro
- Kankakee, IL
- Population (ZIP)
- 33,128
- Household income
- $58,309
- Rent vs Own
- Severe rent burden
- 1317.0
Population outlook (Kankakee County) Hauer SSP2
- Today (2025)
- 105,479 people
- By 2030
- 101,792 · -3.5%
- By 2040
- 93,479 · -11.4%
- By 2050
- 85,061 · -19.4%
- By 2075
- 67,314 · -36.2%
- By 2100
- 52,439 · -50.3%
Race, ethnicity, and origin ACS 2023
- Neighborhood character
- Diverse neighborhood (Simpson 0.65)
- Race & ethnicity
- White 47% Black 30% Hispanic / Latino 19% Two or more races 7%
- Hispanic origin (detail)
- Mexican 16%
- Common ancestry
- Lithuanian 4% Romanian 4% Slovak 1%
- Foreign-born
- 10% · Canada
- Languages at home
- 82% English-only · Spanish 16%
Political lean MEDSL · Kankakee
- 2024 margin
- Strong R (+20.8) · D 38.7% · R 59.5% · Other 1.8%
- 2008→2024 swing
- -25.4pp toward R · 2008: 4.6pp · 2024: -20.8pp
- All cycles
- 2024: R+20.8 2020: R+16.5 2016: R+13.3 2012: R+3.4 2008: D+4.6
Not yet ingested
- Civics
- —
Market trends
- HPI YoY
- ▼ -92.12%
- Current HPI
- 190.8755
- Rent YoY
- ▲ 4.38%
- Metro
- Kankakee, IL
- State GDP YoY
- ▲ 1.59%
- F500 in state
- 60
Industry mix (Fortune 500 HQ in IL)
| Industry | F500 HQs | Revenue |
|---|---|---|
| Insurance | 4 | $201B |
|
||
| Consumer Goods | 4 | $87B |
|
||
| Industrial Machinery | 3 | $64B |
|
||
| Healthcare | 2 | $55B |
|
||
| Retail / Pharmacy | 1 | $148B |
|
||
| Agriculture / Food | 1 | $86B |
|
||
Price history
-11.2% since first listed8 events — show timeline
- 2026-06-15 Pending — MRED as Distributed by MLS Grid
- 2026-05-15 Relisted — MRED as Distributed by MLS Grid
- 2026-05-15 Price Changed $79,585 MRED as Distributed by MLS Grid
- 2026-05-07 Contingent — MRED as Distributed by MLS Grid
- 2026-04-23 Listed $89,585 MRED as Distributed by MLS Grid
- 2026-04-21 Listing Removed — MRED as Distributed by MLS Grid
- 2026-03-29 Price Changed — MRED as Distributed by MLS Grid
- 2026-01-13 Listed — MRED as Distributed by MLS Grid
Property tax history
+20.9%/yrLatest (2025): $4,253 · +6.3% YoY. Source: county tax records.
Cash-flow waterfall
monthlySold comps — $/sqft
last 12 mo · ≤1 miLoading sold comps…