 Multi-family
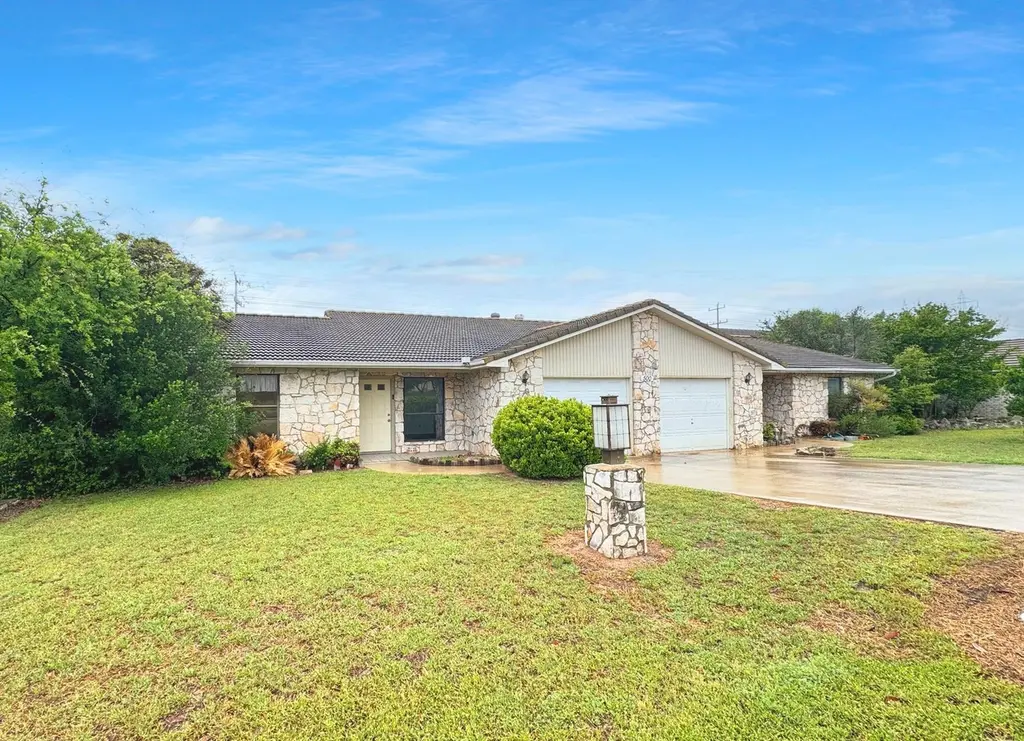
500 Hi Circle Cir W · Horseshoe Bay, TX
Flood risk 1/10 · Minimal
- FEMA flood zone
- X (unshaded)
- Chance of flooding over 30 yrs
- 0.0%
- Est. flood insurance / yr
- $507 – $1,088
Fire risk 5/10 · Moderate
- Est. fire insurance / yr
- $1,222 – $2,270
Heat risk 8/10 · Major
- Hot days now (above 106°F)
- 7 days/yr
- Hot days in 30 yrs
- 23 days/yr
Wind risk 6/10 · Moderate
- Chance of severe wind over 30 yrs
- 56.0%
Air-quality risk 1/10 · Minimal
- Unhealthy air days now
- 0 days/yr
- Unhealthy air days in 30 yrs
- 0 days/yr
Risk factors via First Street. Map © Google.
Why this score? — see what drove the F grade
The composite is a weighted blend of 9 inputs, each scored 0–100. Each bar is that input's sub-score; the figure is the points it added to the 100-point composite (weight × sub-score).
- Cash flow +11.2/30.0
- Appreciation +5.5/10.0
- Schools +3.5/10.0
- DSCR +3.3/10.0
- Livability +3.3/5.0
- 1% rule +3.0/10.0
- Rent growth +2.5/5.0
- Condition / age +2.5/5.0
- ARV discount +0.3/15.0
$495,000
🖨 Deal sheet (PDF) 📄 Offer letter ✓ Due diligence
Multi-family units
County records classify this as Multi-Family (2-4 Unit). Listing-text estimate: 1 unit. estimate disagrees with records
Listing remarks
Positioned in the heart of Horseshoe Bay, this duplex offers flexibility for full-time living, weekend use, or investment potential. Just off FM 2147 and minutes to Hwy 71, the property is just moments from the Horseshoe Bay Resort, placing world-class golf, marina access, dining, and resort-style amenities within easy reach. Each unit features 2 bedrooms and 1.5 baths with a functional, comfortable layout. Open-concept living and dining areas flow into the kitchens, while bedrooms provide privacy for residents or guests. Natural light fills the interiors and covered back patios offer a relaxed setting to enjoy the surrounding Hill Country. Ideal as a primary residence with income potential
Key facts
- Year round boating
- Golf courses
- Lake lbj
Tags
Property features AI
Finance
- Other: Located in the Horseshoe Bay P subdivision
- HOA & community: Community park
Exterior
- Parking: Attached garage with garage door opener (1 car)
- Utilities: Public water; Public sewer
- Home design: Single family residence; Single-story; Accessible entrance
- Construction: Wood siding and stone exterior; Composition roof; Slab foundation; Built as residential single family
- Exterior features: Covered patio/porch; Rain gutters; Cleared lot
Interior
- Kitchen: Dishwasher; Disposal; Electric range; Refrigerator
- Flooring: Tile; Vinyl
- Bathrooms: 2 full bathrooms; 2 half bathrooms
- Heating & cooling: Central heating (electric); Central air; Ceiling fan(s)
- Interior features: Vaulted ceilings; Fireplace
- Laundry & utility: Washer hookup; Electric dryer hookup; Electric water heater
Neighborhood map
What this means for you Summary
Snapshot
- This is a 4-bed/3.0-bath multifamily listed at $495k.
Deal economics
- At list price, monthly cash flow is $-192 ($-2k/yr) — negative.
- To cash-flow at today's rent, offer at most $461k (6.8% below list).
- To meet the 1% rule (rent ≥ 1% of price), the offer needs to be $394k (20.3% below list).
- Recommended offer: $394k (20.3% below list) — sets the bar for 1% rule.
- Cap rate 5.8% vs local median 1.0% in Horseshoe Bay — top-decile yield for the area; either an underpriced asset or a hidden risk that comps aren't pricing in. Stress-test before assuming the spread holds.
Location & tenants
- Location reads 66/100 on livability (#625 in TX) — a middle-class / working-renter tenant base. Strengths: crime A+, employment A-, housing A-; Watch: schools C-, amenities F, commute F.
- Llano ISD (town): math 40% / reading 43% proficiency, ranked #359 of 826 in TX (top 44%) — families likely to look elsewhere, expect single-tenant / working-renter base with shorter leases.
- Market conditions: 1223 active listings in the ZIP; 11 comparable units currently listed for rent nearby; rentals lingering (median 45d on market — plan ~5-8 weeks vacancy on turnover, expect pricing pressure); 55% of comp listings sitting > 30 days — soft ceiling on asking rent; solid renter incomes; 121 units permitted in Llano County in 2024 (0 in 5+ unit buildings).
- At $3,943/mo this rent would consume 52% of the median local household income ($91k/yr) (locally 45% of renters already pay >50% of income on rent) — very limited rent-growth headroom before tenants either downsize or default.
Forward outlook
- In year one you build about $8k of equity ($3k loan paydown + $5k appreciation (0.9% local appreciation)).
- Llano County population projected at +11% by 2050 — modest demand growth; plan on rents tracking national, not racing it.
- By year 5, paydown + projected appreciation supports a ~$38k cash-out refi (75% LTV) — recoverable capital for the next deal without selling this one.
Negotiation context
- It's been on market 56 days — a 3% lower offer ($480k) is reasonable based on typical stale-listing flexibility.
Risks & watch-outs
- Climate carrying-cost: major wind risk, 56% chance of damaging wind over 30y; moderate wildfire risk; extreme-heat days projected 7→23/yr by 2055 (HVAC capex compounding) — expect insurance premiums to compound above CPI over the hold.
Questions for the listing agent
- What do current leases actually rent for vs. the listed asking? Can we see a recent rent roll and the last 12 months of T-12 income?
- It's been on market 56 days. Have you received any prior offers? Is the seller open to a 20% concession, seller financing, or rate buy-down credit?
- Is there a deadline driving the sale (1031 exchange, divorce, estate, relocation)? That informs how much negotiation room exists.
- The area grade is low — what's the realistic commute time and amenity access for the typical tenant pool here? Any planned neighborhood developments (good or bad) we should know about?
- What's the average days-on-market for RENTAL listings here right now (not sales)? A rising rental-DOM trend means longer vacancies and softer asking-rent achievability than the comps imply.
- What's the recent tenant-quality profile in this submarket — average credit score on applications, eviction rate, late-payment / NSF rate, and stable-employment percentage? A property-management company in the area should have these aggregated.
- How much new apartment / multifamily construction is in the pipeline within 1–3 miles? Heavy new supply (>2% of stock underway) typically softens rents 12–24 months out; light construction supports rent growth.
Investment metrics
- 1% rule
- 0.80% ✗
- Cap rate
- 5.83%
- Cash-on-cash
- -1.66%
- DSCR
- 0.93
- GRM
- 10.5
CMA / ARV
- ARV (median comp)
- $426,346
- List price
- $495,000
- Delta
- 16.10%
- Verdict
- OVERPRICED
- Comps
- 2 within 1.0 mi
Projected returns pro-forma
0.95% appreciation · 3.0% rent growth · sell at horizon
- IRR
- -0.6%
- Equity multiple
- 0.97×
- Total profit
- $-4,275
- Equity at exit
- $167,578
- IRR
- 4.3%
- Equity multiple
- 1.52×
- Total profit
- $71,856
- Equity at exit
- $221,613
Cash invested: $138,600 (down + closing). Projections, not guarantees.
Landlord ↔ Tenant lean methodology
- Overall (STATE)
- 87 Strongly Landlord-Friendly
- State Texas
- 87 Strongly Landlord-Friendly · R+5
- County
- — inherits STATE
- City
- — inherits STATE
ZIP-level market 78657
- Home prices YoY
- 0.4%
- Active inventory
- 1223
- Price-to-rent
- 20.9×
Monthly cashflow live
- Estimated rent
- $3,943 high interval (Pro) →
- Mortgage (P&I)
- −$2,596
- Tax from tax record
- −$504 /mo · $6,053/yr
- Insurance
- −$206
- HOA
- −$0
- Vacancy / Maint / Mgmt
- −$828
- Net cashflow
- $-192
Break-even live
Sensitivity live
| Price | -10% $89 | -5% $-51 | +0% $-192 | +5% $-332 | +10% $-472 |
|---|---|---|---|---|---|
| Rent | -10% $-503 | -5% $-347 | +0% $-192 | +5% $-36 | +10% $120 |
| Rate | -1.0pp $58 | -0.5pp $-66 | base $-192 | +0.5pp $-320 | +1.0pp $-450 |
2-unit breakdown (identical units grouped — click to expand)
| Units | Beds | Baths | Est. rent |
|---|---|---|---|
| 2× units | 2 | 1.5 | $3,942 |
| #1 | 2 | 1.5 | $1,971 |
| #2 | 2 | 1.5 | $1,971 |
| Total (2 units) | $3,943 | ||
UW: 25.0% down · 7.5% · 30yr · 1.5% tax · 5.0% vac · 8.0% maint · 8.0% mgmt
Financing live
Cash to close
- Down payment
- $123,750
- Closing costs
- $14,850
- Reserves months
- —
- Total cash needed
- —
Loan-product check · same deal, 3 products live
Conventional
25% down · 7.5% · 30yr
- Down + closing
- —
- Monthly P&I
- —
- Monthly cashflow
- —
- DSCR
- —
- Eligible?
- —
Personal DTI + credit; lowest rate.
DSCR
20% down · 8.5% · 30yr
- Down + closing
- —
- Monthly P&I
- —
- Monthly cashflow
- —
- DSCR
- —
- Eligible?
- —
No personal income docs; deal must DSCR.
Hard money
10% down · 12.0% · 12mo
- Down + closing
- —
- Monthly P&I
- —
- Monthly cashflow
- —
- DSCR
- —
- Eligible?
- —
Short-term bridge; refi at stabilization.
Rent comps 11 comps
| Address | Beds | Baths | Sqft | Rent | $/sqft | DOM | Units | Dist |
|---|---|---|---|---|---|---|---|---|
| 203 Hi Cir W Horseshoe Bay, TX | 3.0 | 2.0 | 1823 | $2,595 | $1.42 | 24d | 1 | 0.29mi |
| 106 Cross Bow Horseshoe Bay, TX | 3.0 | 3.0 | 1764 | $2,900 | $1.64 | 44d | 1 | 0.77mi |
| 717 Indian Paint Blvd Horseshoe Bay, TX | 3.0 | 3.5 | 2742 | $3,650 | $1.33 | 24d | 1 | 0.78mi |
| 512 Side Saddle Horseshoe Bay, TX | 4.0 | 3.0 | 1850 | $2,700 | $1.46 | 44d | 1 | 0.86mi |
| 820 Broken Arrow Horseshoe Bay, TX | 4.0 | 3.5 | 3328 | $4,590 | $1.38 | 44d | 1 | 0.92mi |
| 305 Fire Dance Horseshoe Bay, TX | 4.0 | 3.0 | 2416 | $3,800 | $1.57 | 44d | 1 | 0.96mi |
| 402 Hi Stirrup Horseshoe Bay, TX | 3.0 | 3.0 | 2038 | $2,200 | $1.08 | 44d | 1 | 0.98mi |
| 111 Lachite Horseshoe Bay, TX | 3.0 | 3.5 | 2811 | $3,800 | $1.35 | 5d | 1 | 1.11mi |
| 1406 Prospect Horseshoe Bay, TX | 3.0 | 2.0 | 1998 | $2,700 | $1.35 | 4d | 1 | 1.19mi |
| 1314 Clayton Nolen Dr Horseshoe Bay, TX | 3.0 | 2.0 | 1885 | $2,850 | $1.51 | 24d | 1 | 1.23mi |
| 102 Prairie Horseshoe Bay, TX | 3.0 | 2.0 | 2154 | $2,700 | $1.25 | 44d | 1 | 1.38mi |
Listing history 20 events
-
2026-06-18days on market $495,000 Active 56 DOM
-
2026-06-17days on market $495,000 Active 55 DOM
-
2026-06-16days on market $495,000 Active 54 DOM
-
2026-06-15days on market $495,000 Active 53 DOM
-
2026-06-14days on market $495,000 Active 51 DOM
-
2026-06-13days on market $495,000 Active 50 DOM
-
2026-06-10days on market $495,000 Active 48 DOM
-
2026-06-09days on market $495,000 Active 47 DOM
-
2026-06-08days on market $495,000 Active 46 DOM
-
2026-06-07days on market $495,000 Active 45 DOM
-
2026-06-05days on market $495,000 Active 42 DOM
-
2026-06-03days on market $495,000 Active 41 DOM
-
2026-06-02days on market $495,000 Active 40 DOM
-
2026-06-01days on market $495,000 Active 39 DOM
-
2026-05-31days on market $495,000 Active 38 DOM
-
2026-05-31days on market $495,000 Active 37 DOM
-
2026-04-23$495,000 Active 1161-char remark
-
2015-06-03soldstatus
-
2006-11-03soldstatus
-
2005-08-24soldstatus
ⓘ Source: listings_history table (triggers on properties + properties_extension) + one-shot
backfill from property_details.listing_events for pre-trigger history.
Tax reassessment forecast TX · Resets to sale price
- Current annual tax
- $6,053 · $504/mo
- Projected year-2 tax
- $9,058 · $755/mo
- Expected delta
- +$3,005/yr (+$250/mo · 49.7%)
ⓘ Screening estimate from a state-policy table — verify with the county assessor before closing.
Climate risk First Street
- Flood 1/10 Low FEMA zone X (unshaded) · 0% chance over 30 yrs
- Wildfire 5/10 Major
- Heat 8/10 Severe 7 d/yr ≥106°F today · 23 d/yr by 30 yrs out
- Wind 6/10 Major 56% chance of damaging wind over 30 yrs
- Air quality 1/10 Low 0 unhealthy d/yr today · 0 by 30 yrs out
Nearby sold comps map
Loading sold comps map…
Walkable amenities ~0.75 mi
Loading nearby amenities…
Taxation est. · year 1
- Rental income
- $47,316
- − Mortgage interest
- −$27,728
- − Property taxes
- −$6,053
- − Insurance
- −$2,475
- − Repairs & maintenance
- −$3,785
- − Management
- −$3,785
- − Depreciation
- −$14,400
- Taxable loss
- −$10,910
- Est. tax savings @ 24.0%
- +$2,618
- After-tax cash flow
- $320/yr
For passive investors: Depreciation is non-cash, so a rental often shows a tax loss while cash-flowing — sheltering income. Rental losses are passive: they offset passive income freely, and up to $25,000/yr can offset ordinary (W-2) income if you actively participate and your MAGI is under $100k (phasing out to $0 by $150k); unused losses carry forward. On sale, claimed depreciation is recaptured at up to 25%, and gains may owe capital-gains tax (a 1031 exchange can defer both). Figures are a year-1 estimate at your 24.0% rate — not tax advice; consult a CPA.
Schools (NCES district)
- District
- Llano ISD
- NCES district ID
- 4827810
- Math proficiency
- 40% ▼ -5.00%
- Reading proficiency
- 43% ▼ -5.00%
- Median HH income
- $46,746
- Composite
- 35.42/100
- National rank
- #4940
- State rank
- #359 of 826 in TX
Livability — Horseshoe Bay
- Score
- 66/100
- State rank
- #625
- US rank
- #11913
Category grades
Schools grade is shown separately in the Schools card above.
Census & demographics
- Census place
- Horseshoe Bay, TX
- County
- Llano County · 16,310 people
- City population
- 7,591
- Metro
- nan
- Population (ZIP)
- 7,591
- Household income
- $91,452
- Rent vs Own
- Severe rent burden
- 45.0
Population outlook (Llano County) Hauer SSP2
- Today (2025)
- 20,847 people
- By 2030
- 21,350 · +2.4%
- By 2040
- 22,281 · +6.9%
- By 2050
- 23,173 · +11.2%
- By 2075
- 25,526 · +22.4%
- By 2100
- 25,866 · +24.1%
Race, ethnicity, and origin ACS 2023
- Neighborhood character
- Predominantly White (80%)
- Race & ethnicity
- White 80% Hispanic / Latino 16% Two or more races 8% Asian 1%
- Hispanic origin (detail)
- Mexican 14%
- Common ancestry
- Slovak 3% Portuguese 3% Italian 2%
- Foreign-born
- 8% · Canada
- Languages at home
- 87% English-only · Spanish 12% Other Indo-European 1%
Political lean MEDSL · Llano
- 2024 margin
- Solid R (+60.9) · D 19.2% · R 80.0%
- 2008→2024 swing
- -8.6pp toward R · 2008: -52.2pp · 2024: -60.9pp
- All cycles
- 2024: R+60.9 2020: R+60.1 2016: R+62.2 2012: R+60.4 2008: R+52.2
Not yet ingested
- Civics
- —
Market trends
- HPI YoY
- ▲ 0.95%
- Current HPI
- 229.9918
- Rent YoY
- —
- Metro
- nan
- State GDP YoY
- ▲ 3.95%
- F500 in state
- 110
Industry mix (Fortune 500 HQ in TX)
| Industry | F500 HQs | Revenue |
|---|---|---|
| Energy | 16 | $1,198B |
|
||
| Technology | 5 | $198B |
|
||
| Engineering / Construction | 4 | $72B |
|
||
| Energy Services | 3 | $60B |
|
||
| Utilities | 3 | $41B |
|
||
| Healthcare | 2 | $330B |
|
||
Price history
4 events — show timeline
- 2026-04-23 Listed $495,000 HLMLS as distributed by MLS GRID
- 2015-06-03 Sold (Public Records) — Public Records
- 2006-11-03 Sold (Public Records) — Public Records
- 2005-08-24 Sold (Public Records) — Public Records
Property tax history
+6.3%/yrLatest (2025): $6,053 · +1.5% YoY. Source: county tax records.
Cash-flow waterfall
monthlySold comps — $/sqft
last 12 mo · ≤1 miLoading sold comps…