246 Center Green Meadow St SE · Gaines, MI
Flood risk No data
- FEMA flood zone
- —
- Chance of flooding over 30 yrs
- —
- Est. flood insurance / yr
- —
Fire risk No data
- Est. fire insurance / yr
- —
Heat risk No data
- Hot days now (above threshold)
- —
- Hot days in 30 yrs
- —
Wind risk No data
- Chance of severe wind over 30 yrs
- —
Air-quality risk No data
- Unhealthy air days now
- —
- Unhealthy air days in 30 yrs
- —
Risk factors via First Street. Map © Google.
Why this score? — see what drove the B grade
The composite is a weighted blend of 9 inputs, each scored 0–100. Each bar is that input's sub-score; the figure is the points it added to the 100-point composite (weight × sub-score).
- Cash flow +30.0/30.0
- 1% rule +10.0/10.0
- DSCR +10.0/10.0
- ARV discount +7.5/15.0
- Condition / age +3.8/5.0
- Schools +3.4/10.0
- Livability +3.0/5.0
- Rent growth +2.5/5.0
- Appreciation +0.0/10.0
$100,500
🖨 Deal sheet 📄 Offer letter ✓ Due diligence
Listing remarks MLS
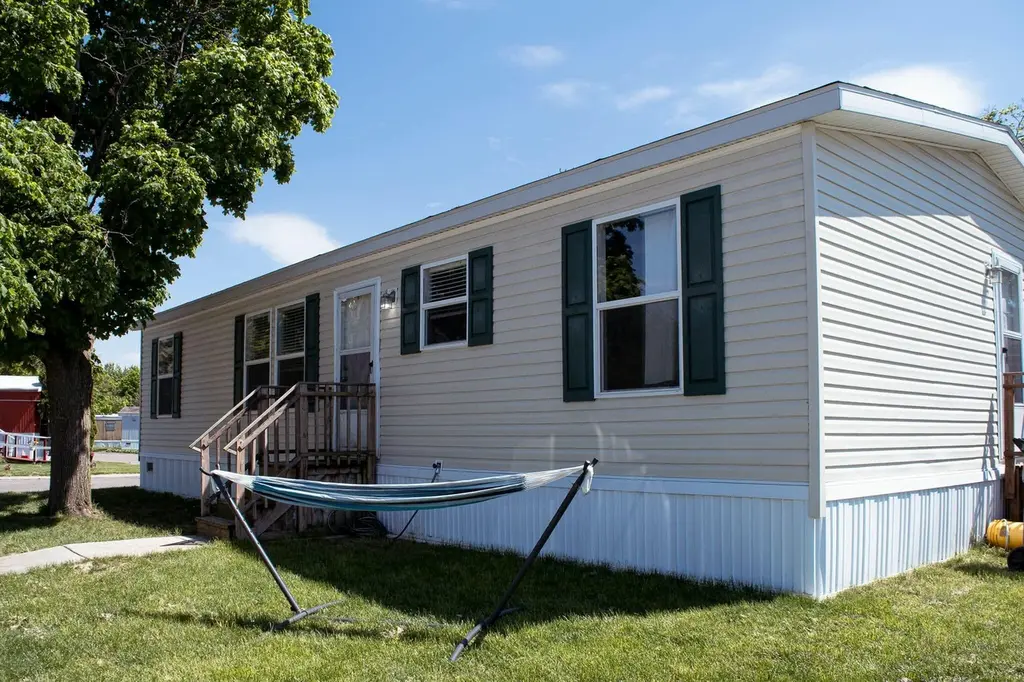
Welcome home to this well-maintained 2018 Clayton manufactured home located in the desirable Green Meadow Estates community in Grand Rapids, Michigan! Featuring 3 bedrooms, 2 full bathrooms, and a spacious open-concept layout, this home offers comfort, convenience, and affordability. Step inside to find brand-new carpet in the living room and all bedrooms, creating a fresh and inviting atmosphere. The large kitchen provides plenty of cabinet and counter space, making meal preparation and entertaining a breeze. The open floor plan seamlessly connects the kitchen, dining, and living areas, giving the home a spacious feel. Additional features:3 Bedrooms, 2 Full BathroomsLarge Open-Concept Living AreaNew Carpet in Bedrooms & Living RoomCentral Air Conditioning2018 Furnace & Water HeaterAffordable Utility CostsWasher & Dryer NegotiableMonthly Lot Rent: $633Must be approved by park prior to closing
Key facts
- Open floor plan
- New carpet
- Large kitchen
Tags
Property features AI
Finance
- HOA & community: Community clubhouse; Pets allowed; Playground; Has association
Exterior
- Utilities: Public water
- Home design: Ranch-style residence; Residential property; Built in 2018
- Construction: Vinyl siding
- Exterior features: Paved road access; Public water
Interior
- Kitchen: Dishwasher; Refrigerator
- Bathrooms: 2 full bathrooms
- Heating & cooling: Forced air heating; Has cooling
- Interior features: 8 total rooms; Dishwasher; Refrigerator; Slab basement
Neighborhood map
What this means for you Summary
Snapshot
- This is a 3-bed/2.0-bath manufactured listed at $100k. Condition is rated good.
Deal economics
- At list price, monthly cash flow is $647 ($8k/yr) — positive.
- The deal already cash-flows at list — no discount required.
- Meets the 1% rule at list price ($2k rent vs $100k).
- Cap rate 14.0% vs local median 2.7% in Gaines — top-decile yield for the area; either an underpriced asset or a hidden risk that comps aren't pricing in. Stress-test before assuming the spread holds.
Location & tenants
- Location reads 60/100 on livability (#583 in MI) — a middle-class / working-renter tenant base. Strengths: cost of living A+, housing A+; Watch: schools D+, employment D, crime F.
- Kentwood Public Schools (suburban): math 34% / reading 46% proficiency, ranked #206 of 540 in MI (top 38%) — families likely to look elsewhere, expect single-tenant / working-renter base with shorter leases.
- Market conditions: 109 active listings in the ZIP; 8 comparable units currently listed for rent nearby; rentals leasing fast (median 10d on market — plan ~1-2 weeks tenant-placement turnaround); 2,253 units permitted in Kent County in 2024 (969 in 5+ unit buildings).
- This rent runs 33% of the median local income ($62k/yr) — at the standard rent-burdened threshold; future hikes will face affordability resistance.
Forward outlook
- Local home prices are declining (-3.0%/yr); year-one equity from $695 of loan paydown is wiped out by about $3k of value loss. Plan a longer hold.
- Kent County population projected at +22% by 2050 — long-run rental-demand tailwind backs the buy-and-hold thesis.
- At projected returns (-3.0% appreciation + 3.0% rent growth), your $28k cash investment doubles in ~5 years — after that, you're playing with house money.
Negotiation context
- Only 10 days on market — expect competitive offers; lowballing is unlikely to land.
- 3 sale attempts with the ask held roughly flat each time — persistent listings suggest the price (not the market) is what's stuck; bring a comps-based counter.
Questions for the listing agent
- Is there a deadline driving the sale (1031 exchange, divorce, estate, relocation)? That informs how much negotiation room exists.
- Schools are D-rated, which usually means shorter tenancies and higher turnover. Who's the typical renter profile here, and what's been the actual vacancy rate?
- Crime grade is F in this area — have there been break-ins, vandalism, or insurance claims at this property in the last 3 years? What carrier currently insures it and at what premium?
- What's the average days-on-market for RENTAL listings here right now (not sales)? A rising rental-DOM trend means longer vacancies and softer asking-rent achievability than the comps imply.
- What's the recent tenant-quality profile in this submarket — average credit score on applications, eviction rate, late-payment / NSF rate, and stable-employment percentage? A property-management company in the area should have these aggregated.
- How much new for-sale + rental construction is in the pipeline within 1–3 miles? Heavy new supply typically softens prices + rents 12–24 months out; constrained supply supports both.
Investment metrics
- 1% rule
- 1.69% ✓
- Cap rate
- 14.02%
- Cash-on-cash
- 27.60%
- DSCR
- 2.23
- GRM
- 4.9
CMA / ARV
- ARV (on-the-fly)
- $51,000
- Comps found
- 3
Show comp detail 3 sales within ~0.75 mi
| Address | Dist | Beds/Ba | Sqft | Sold | Price | $/sf | Match |
|---|---|---|---|---|---|---|---|
| 244 Piedmont Dr SE | 0.12mi | 2/1.0 (-1) | 952 (-5%) | 0mo | $49,999 | $53 | 77 |
| 423 N Amber Dr SE | 0.24mi | 3/1.0 | 984 (-2%) | 13mo | $18,000 | $18 | 71 |
| 6516 Bayonet Ave SW | 0.63mi | 3/2.0 | 1,088 (+9%) | 10mo | $56,000 | $51 | 48 |
Match score weights: distance 35% · size 25% · config 20% · recency 20%. Top-matched comps best support the ARV.
Projected returns pro-forma
-3.0% appreciation · 3.0% rent growth · sell at horizon
- IRR
- 21.7%
- Equity multiple
- 1.89×
- Total profit
- $24,959
- Equity at exit
- $14,985
- IRR
- 29.8%
- Equity multiple
- 3.66×
- Total profit
- $74,914
- Equity at exit
- $8,689
Cash invested: $28,140 (down + closing). Projections, not guarantees.
Landlord ↔ Tenant lean methodology
- Overall (STATE)
- 62 Landlord-Friendly
- State Michigan
- 62 Landlord-Friendly · EVEN
- County
- — inherits STATE
- City
- — inherits STATE
ZIP-level market 49548
- Active inventory
- 109
- Price-to-rent
- 4.9×
Monthly cashflow live
- Estimated rent
- $1,698 high interval (Pro) →
- Mortgage (P&I)
- −$527
- Tax est. 1.5%
- −$126 /mo · $1,508/yr
- Insurance
- −$42
- HOA
- −$0
- Vacancy / Maint / Mgmt
- −$357
- Net cashflow
- $647
Break-even live
UW: 25.0% down · 7.5% · 30yr · 1.5% tax · 5.0% vac · 8.0% maint · 8.0% mgmt
Financing live
Cash to close
- Down payment
- $25,125
- Closing costs
- $3,015
- Reserves months
- —
- Total cash needed
- —
Loan-product check · same deal, 3 products live
Conventional
25% down · 7.5% · 30yr
- Down + closing
- —
- Monthly P&I
- —
- Monthly cashflow
- —
- DSCR
- —
- Eligible?
- —
Personal DTI + credit; lowest rate.
DSCR
20% down · 8.5% · 30yr
- Down + closing
- —
- Monthly P&I
- —
- Monthly cashflow
- —
- DSCR
- —
- Eligible?
- —
No personal income docs; deal must DSCR.
Hard money
10% down · 12.0% · 12mo
- Down + closing
- —
- Monthly P&I
- —
- Monthly cashflow
- —
- DSCR
- —
- Eligible?
- —
Short-term bridge; refi at stabilization.
Rent comps 8 comps
| Address | Beds | Baths | Sqft | Rent | $/sqft | DOM | Units | Dist |
|---|---|---|---|---|---|---|---|---|
| 6263 Division Ave S Grand Rapids, MI | 2.0–3.0 | 2.0 | 1200 | $1,579 | $1.32 | 2d | 1 | 0.29mi |
| 6471 Division Ave S Grand Rapids, MI | 2.0 | 1.0 | 728 | $1,399 | $1.92 | 10d | 1 | 0.40mi |
| 6500 Division Ave S Grand Rapids, MI | 2.0 | 1.0 | 784 | $1,399 | $1.78 | 10d | 1 | 0.44mi |
| 5790 Madison Ave SE Unit 5790 Grand Rapids, MI | 3.0 | 1.0 | 1300 | $1,795 | $1.38 | 10d | 1 | 0.61mi |
| 6700 Creekstone Ln SW Grand Rapids, MI | 2.0 | 1.0 | 1000 | $1,285 | $1.28 | 2d | 1 | 0.91mi |
| 1190 Fairbourne Dr SE Kentwood, MI | 2.0–3.0 | 2.5 | 1535 | $2,950 | $1.92 | 2d | 8 | 1.22mi |
| 7283 Division Ave S Grand Rapids, MI | 3.0 | 2.0 | 1152 | $1,514 | $1.31 | 21d | 1 | 1.25mi |
| 1244 Katrina Dr SE Grand Rapids, MI | 3.0 | 1.5 | 1144 | $1,885 | $1.65 | 14d | 1 | 1.50mi |
Listing history 9 events
-
2026-06-18days on market $100,500 Active 10 DOM
-
2026-06-17days on market $100,500 Active 9 DOM
-
2026-06-16days on market $100,500 Active 8 DOM
-
2026-06-15days on market $100,500 Active 7 DOM
-
2026-06-14days on market $100,500 Active 5 DOM
-
2026-06-13days on market $100,500 Active 4 DOM
-
2026-06-10days on market $100,500 Active 2 DOM
-
2026-06-09remarks 699-char remark
-
2026-06-09$100,500 Active 1 DOM
ⓘ Source: listings_history table (triggers on properties + properties_extension) + one-shot
backfill from property_details.listing_events for pre-trigger history.
Nearby sold comps map
Loading sold comps map…
Walkable amenities ~0.75 mi
Loading nearby amenities…
Taxation est. · year 1
- Rental income
- $20,380
- − Mortgage interest
- −$5,630
- − Property taxes
- −$1,508
- − Insurance
- −$502
- − Repairs & maintenance
- −$1,630
- − Management
- −$1,630
- − Depreciation
- −$2,924
- Taxable income
- $6,556
- Est. tax owed @ 24.0%
- −$1,574
- After-tax cash flow
- $6,193/yr
For passive investors: Depreciation is non-cash, so a rental often shows a tax loss while cash-flowing — sheltering income. Rental losses are passive: they offset passive income freely, and up to $25,000/yr can offset ordinary (W-2) income if you actively participate and your MAGI is under $100k (phasing out to $0 by $150k); unused losses carry forward. On sale, claimed depreciation is recaptured at up to 25%, and gains may owe capital-gains tax (a 1031 exchange can defer both). Figures are a year-1 estimate at your 24.0% rate — not tax advice; consult a CPA.
Condition & rehab AI · 12 photos
This 2018 Clayton manufactured home in Green Meadow Estates is in good condition with new flooring and cabinets. It offers a spacious open-concept layout and is ready for a fresh paint job and new carpet to further enhance its value.
Value-add opportunities
- Both Paint exterior — Fresh paint enhances curb appeal and value
- Both Replace carpet in living room and bedrooms — New carpet improves comfort and aesthetics
- Both Install new window treatments — New blinds or curtains can improve energy efficiency and aesthetics
Renovation cost estimate screening
Value-add ROI direction
- Both Paint exterior — Fresh paint enhances curb appeal and value ↑
- Both Replace carpet in living room and bedrooms — New carpet improves comfort and aesthetics ↑
- Both Install new window treatments — New blinds or curtains can improve energy efficiency and aesthetics ↑
ⓘ Cost ranges are severity-bucket heuristics (US national rule-of-thumb). Get contractor quotes + a written scope before underwriting a rehab budget.
Schools (NCES district)
- District
- Kentwood Public Schools
- NCES district ID
- 2620340
- Math proficiency
- 34% ▼ -4.00%
- Reading proficiency
- 46% ▼ -3.00%
- Median HH income
- $48,962
- Composite
- 34.35/100
- National rank
- #5226
- State rank
- #206 of 540 in MI
Livability — Gaines
- Score
- 60/100
- State rank
- #583
- US rank
- #18809
Category grades
Schools grade is shown separately in the Schools card above.
Census & demographics
- Census place
- Cutlerville, MI
- County
- Kent County · 533,805 people
- City population
- 26,427
- Metro
- Grand Rapids-Kentwood, MI
- Population (ZIP)
- 34,777
- Household income
- $61,636
- Rent vs Own
- Severe rent burden
- 781.0
Population outlook (Kent County) Hauer SSP2
- Today (2025)
- 712,484 people
- By 2030
- 748,618 · +5.1%
- By 2040
- 814,777 · +14.4%
- By 2050
- 868,556 · +21.9%
- By 2075
- 966,487 · +35.7%
- By 2100
- 967,975 · +35.9%
Race, ethnicity, and origin ACS 2023
- Neighborhood character
- Diverse neighborhood (Simpson 0.68)
- Race & ethnicity
- White 49% Hispanic / Latino 22% Two or more races 16% Black 15% Asian 6% Native American 1%
- Hispanic origin (detail)
- Mexican 15% Puerto Rican 4%
- Common ancestry
- Iranian 10% Romanian 4% Lithuanian 2%
- Foreign-born
- 13% · Canada, Vietnam, China
- Languages at home
- 78% English-only · Spanish 14% Vietnamese 2% French/Haitian/Cajun 1%
Political lean MEDSL · Kent
- 2024 margin
- Lean D (+5.4) · D 51.8% · R 46.5% · Other 1.7%
- 2008→2024 swing
- +4.8pp toward D · 2008: 0.5pp · 2024: 5.4pp
- All cycles
- 2024: D+5.4 2020: D+6.1 2016: R+3.1 2012: R+7.9 2008: D+0.5
Not yet ingested
- Civics
- —
Market trends
- HPI YoY
- ▼ -208.41%
- Current HPI
- 325.8096
- Rent YoY
- —
- Metro
- Grand Rapids-Kentwood, MI
- State GDP YoY
- ▲ 1.37%
- F500 in state
- 28
Industry mix (Fortune 500 HQ in MI)
| Industry | F500 HQs | Revenue |
|---|---|---|
| Automotive Parts | 3 | $48B |
|
||
| Automotive | 2 | $372B |
|
||
| Chemicals | 1 | $45B |
|
||
| Automotive Retail | 1 | $29B |
|
||
| Healthcare / Medical Devices | 1 | $23B |
|
||
| Automotive Technology | 1 | $20B |
|
||
Price history
+0.0% since first listed3 events — show timeline
- 2026-06-07 Listed $100,500 MiRealSource-MiMLS
- 2026-06-07 Listed $100,500 REALCOMP
- 2026-06-07 Listed $100,500 SW Michigan MLS
Cash-flow waterfall
monthlySold comps — $/sqft
last 12 mo · ≤1 miLoading sold comps…