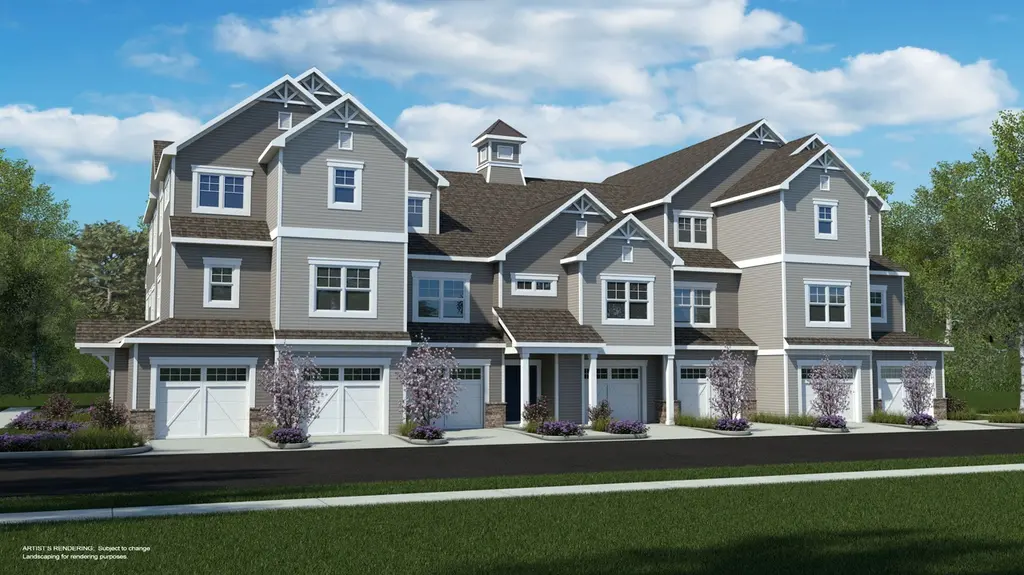
24671 Merlot Dr · Lewes, DE
Flood risk 1/10 · Minimal
- FEMA flood zone
- X (unshaded)
- Chance of flooding over 30 yrs
- 0.0%
- Est. flood insurance / yr
- $473 – $860
Fire risk 1/10 · Minimal
- Est. fire insurance / yr
- $476 – $884
Heat risk 8/10 · Major
- Hot days now (above 101°F)
- 7 days/yr
- Hot days in 30 yrs
- 18 days/yr
Wind risk 8/10 · Major
- Chance of severe wind over 30 yrs
- 80.0%
Air-quality risk 2/10 · Minimal
- Unhealthy air days now
- 1 days/yr
- Unhealthy air days in 30 yrs
- 1 days/yr
Risk factors via First Street. Map © Google.
Why this score? — see what drove the D- grade
The composite is a weighted blend of 9 inputs, each scored 0–100. Each bar is that input's sub-score; the figure is the points it added to the 100-point composite (weight × sub-score).
- ARV discount +15.0/15.0
- Cash flow +6.8/30.0
- Schools +4.2/10.0
- Livability +3.4/5.0
- Rent growth +2.7/5.0
- Condition / age +2.5/5.0
- DSCR +1.0/10.0
- 1% rule +0.9/10.0
- Appreciation +0.0/10.0
$449,000
🖨 Deal sheet 📄 Offer letter ✓ Due diligence
Listing remarks MLS
Beautiful 2,325 square foot Carriage Home in sought after Vineyards in Lewes, Delaware. Ready now! Many upgrades (LVP flooring-Upgraded white cabinets throughout - Granite in kitchen - Stainless Steel Appliances and so much more!) - 3rd floor with Private Elevator and 1 car garage. A must see.
Key facts
- Carriage home
- Private elevator
- Parking
Tags
Neighborhood map
What this means for you Summary
Snapshot
- This is a 3-bed/3.0-bath condo listed at $449k.
Deal economics
- At list price, monthly cash flow is $-705 ($-8k/yr) — negative.
- To cash-flow at today's rent, offer at most $354k (21.1% below list).
- To meet the 1% rule (rent ≥ 1% of price), the offer needs to be $265k (41.1% below list).
- Recommended offer: $265k (41.1% below list) — sets the bar for 1% rule.
- Cap rate 4.4% vs local median 1.7% in Lewes — top-decile yield for the area; either an underpriced asset or a hidden risk that comps aren't pricing in. Stress-test before assuming the spread holds.
Location & tenants
- Location reads 67/100 on livability (#40 in DE) — a middle-class / working-renter tenant base. Strengths: crime A+, employment A+, health & safety A+; Watch: commute F, cost of living F.
- Cape Henlopen School District (town): math 42% / reading 55% proficiency, ranked #5 of 26 in DE (top 19%) — families likely to look elsewhere, expect single-tenant / working-renter base with shorter leases.
- Market conditions: Rents flat; 818 active listings in the ZIP; 6 comparable units currently listed for rent nearby; rentals lingering (median 44d on market — plan ~5-8 weeks vacancy on turnover, expect pricing pressure); 50% of comp listings sitting > 30 days — soft ceiling on asking rent; solid renter incomes; 4,354 units permitted in Sussex County in 2024 (344 in 5+ unit buildings).
- This rent runs 33% of the median local income ($97k/yr) — at the standard rent-burdened threshold; future hikes will face affordability resistance.
Forward outlook
- Local home prices are declining (-3.0%/yr); year-one equity from $3k of loan paydown is wiped out by about $13k of value loss. Plan a longer hold.
- Sussex County population projected at +25% by 2050 — long-run rental-demand tailwind backs the buy-and-hold thesis.
Negotiation context
- It's been on market 104 days — a 9% lower offer ($409k) is reasonable based on typical stale-listing flexibility.
Risks & watch-outs
- Climate carrying-cost: severe wind risk, 80% chance of damaging wind over 30y; extreme-heat days projected 7→18/yr by 2055 (HVAC capex compounding) — expect insurance premiums to compound above CPI over the hold.
Questions for the listing agent
- What do current leases actually rent for vs. the listed asking? Can we see a recent rent roll and the last 12 months of T-12 income?
- It's been on market 104 days. Have you received any prior offers? Is the seller open to a 41% concession, seller financing, or rate buy-down credit?
- What does the HOA fee cover, when was the last increase, and are there any pending special assessments or reserve-fund shortfalls?
- Any open or pending special assessments — roof, HVAC, plumbing, elevator, façade? What's the per-unit balance and payoff schedule, and is the seller paying it off at close or rolling it to the buyer?
- Why hasn't it sold? Are there any deal-killer items the seller is aware of (foundation, flood, title, zoning, code violations)?
- Is there a deadline driving the sale (1031 exchange, divorce, estate, relocation)? That informs how much negotiation room exists.
- Schools are B-rated — typically a magnet for longer-tenancy family renters. What's the average tenant stay here, and is there a school-zone premium baked into asking?
- The area grade is low — what's the realistic commute time and amenity access for the typical tenant pool here? Any planned neighborhood developments (good or bad) we should know about?
- What's the average days-on-market for RENTAL listings here right now (not sales)? A rising rental-DOM trend means longer vacancies and softer asking-rent achievability than the comps imply.
- What's the recent tenant-quality profile in this submarket — average credit score on applications, eviction rate, late-payment / NSF rate, and stable-employment percentage? A property-management company in the area should have these aggregated.
- How much new apartment / multifamily construction is in the pipeline within 1–3 miles? Heavy new supply (>2% of stock underway) typically softens rents 12–24 months out; light construction supports rent growth.
Investment metrics
- 1% rule
- 0.59% ✗
- Cap rate
- 4.41%
- Cash-on-cash
- -6.73%
- DSCR
- 0.70
- GRM
- 14.1
CMA / ARV
- ARV (median comp)
- $583,416
- List price
- $449,000
- Delta
- -23.04%
- Verdict
- UNDERPRICED
- Comps
- 20 within 1.0 mi
Projected returns pro-forma
-3.0% appreciation · 0.77% rent growth · sell at horizon
- IRR
- -30.2%
- Equity multiple
- 0.02×
- Total profit
- $-123,647
- Equity at exit
- $66,947
- IRR
- -43.3%
- Equity multiple
- -0.50×
- Total profit
- $-188,918
- Equity at exit
- $38,821
Cash invested: $125,720 (down + closing). Projections, not guarantees.
Landlord ↔ Tenant lean methodology
- Overall (STATE)
- 70 Landlord-Friendly
- State Delaware
- 70 Landlord-Friendly · D+7
- County
- — inherits STATE
- City
- — inherits STATE
ZIP-level market 19958
- Rents YoY
- 0.8%
- Active inventory
- 818
- Price-to-rent
- 14.1×
Monthly cashflow live
- Estimated rent
- $2,645 high interval (Pro) →
- Mortgage (P&I)
- −$2,355
- Tax from tax record
- −$86 /mo · $1,027/yr
- Insurance
- −$187
- HOA est. from 2 same-building comps
- −$168
- Vacancy / Maint / Mgmt
- −$556
- Net cashflow
- $-705
Break-even live
UW: 25.0% down · 7.5% · 30yr · 1.5% tax · 5.0% vac · 8.0% maint · 8.0% mgmt
Financing live
Cash to close
- Down payment
- $112,250
- Closing costs
- $13,470
- Reserves months
- —
- Total cash needed
- —
Loan-product check · same deal, 3 products live
Conventional
25% down · 7.5% · 30yr
- Down + closing
- —
- Monthly P&I
- —
- Monthly cashflow
- —
- DSCR
- —
- Eligible?
- —
Personal DTI + credit; lowest rate.
DSCR
20% down · 8.5% · 30yr
- Down + closing
- —
- Monthly P&I
- —
- Monthly cashflow
- —
- DSCR
- —
- Eligible?
- —
No personal income docs; deal must DSCR.
Hard money
10% down · 12.0% · 12mo
- Down + closing
- —
- Monthly P&I
- —
- Monthly cashflow
- —
- DSCR
- —
- Eligible?
- —
Short-term bridge; refi at stabilization.
Rent comps 6 comps
| Address | Beds | Baths | Sqft | Rent | $/sqft | DOM | Units | Dist |
|---|---|---|---|---|---|---|---|---|
| 20141 Riesling Ln #306 Lewes, DE | 2.0 | 2.0 | 1600 | $2,600 | $1.62 | 43d | 1 | 0.08mi |
| 17432 Slipper Shell Way #5 Lewes, DE | 3.0 | 2.0 | 1840 | $2,150 | $1.17 | 21d | 1 | 0.73mi |
| 17010 Minos Conaway Rd Lewes, DE | 3.0 | 2.0 | 1600 | $2,500 | $1.56 | 43d | 1 | 0.79mi |
| 33731 Freeport Dr Lewes, DE | 3.0 | 2.5 | 2300 | $3,295 | $1.43 | 13d | 1 | 1.22mi |
| 18 Greystone Dr Lewes, DE | 3.0 | 2.5 | 2114 | $2,875 | $1.36 | 21d | 1 | 1.27mi |
| 33176 Denton St Lewes, DE | 4.0 | 3.5 | 1800 | $2,650 | $1.47 | 43d | 1 | 1.37mi |
HOA detail condo
- Monthly dues
- $0 · $0/yr
- Assessments
- None detected in remarks — confirm with the listing agent.
Listing history 18 events
-
2026-06-18days on market $449,000 Active 104 DOM
-
2026-06-17days on market $449,000 Active 103 DOM
-
2026-06-16days on market $449,000 Active 102 DOM
-
2026-06-15days on market $449,000 Active 101 DOM
-
2026-06-14days on market $449,000 Active 99 DOM
-
2026-06-13days on market $449,000 Active 98 DOM
-
2026-06-10days on market $449,000 Active 96 DOM
-
2026-06-09days on market $449,000 Active 95 DOM
-
2026-06-08days on market $449,000 Active 94 DOM
-
2026-06-07days on market $449,000 Active 93 DOM
-
2026-06-05days on market $449,000 Active 90 DOM
-
2026-06-03days on market $449,000 Active 89 DOM
-
2026-06-02days on market $449,000 Active 88 DOM
-
2026-06-01days on market $449,000 Active 87 DOM
-
2026-05-31days on market $449,000 Active 86 DOM
-
2026-05-30days on market $449,000 Active 85 DOM
-
2026-04-06price $449,000 294-char remark
Show marketing remark (294 chars)
Beautiful 2,325 square foot Carriage Home in sought after Vineyards in Lewes, Delaware. Ready now! Many upgrades (LVP flooring-Upgraded white cabinets throughout - Granite in kitchen - Stainless Steel Appliances and so much more!) - 3rd floor with Private Elevator and 1 car garage. A must see.
-
2026-03-06$455,900 Active 294-char remark
Show marketing remark (294 chars)
Beautiful 2,325 square foot Carriage Home in sought after Vineyards in Lewes, Delaware. Ready now! Many upgrades (LVP flooring-Upgraded white cabinets throughout - Granite in kitchen - Stainless Steel Appliances and so much more!) - 3rd floor with Private Elevator and 1 car garage. A must see.
ⓘ Source: listings_history table (triggers on properties + properties_extension) + one-shot
backfill from property_details.listing_events for pre-trigger history.
Tax reassessment forecast DE · Partial reset (capped growth)
- Current annual tax
- $1,027 · $86/mo
- Projected year-2 tax
- $1,816 · $151/mo
- Expected delta
- +$788/yr (+$66/mo · 76.8%)
ⓘ Screening estimate from a state-policy table — verify with the county assessor before closing.
Climate risk First Street
- Flood 1/10 Low FEMA zone X (unshaded) · 0% chance over 30 yrs
- Wildfire 1/10 Low
- Heat 8/10 Severe 7 d/yr ≥101°F today · 18 d/yr by 30 yrs out
- Wind 8/10 Severe 80% chance of damaging wind over 30 yrs
- Air quality 2/10 Low 1 unhealthy d/yr today · 1 by 30 yrs out
Nearby sold comps map
Loading sold comps map…
Walkable amenities ~0.75 mi
Loading nearby amenities…
Taxation est. · year 1
- Rental income
- $31,744
- − Mortgage interest
- −$25,151
- − Property taxes
- −$1,027
- − Insurance
- −$2,245
- − Repairs & maintenance
- −$2,539
- − Management
- −$2,539
- − HOA
- −$2,016
- − Depreciation
- −$13,062
- Taxable loss
- −$16,836
- Est. tax savings @ 24.0%
- +$4,041
- After-tax cash flow
- $-4,425/yr
For passive investors: Depreciation is non-cash, so a rental often shows a tax loss while cash-flowing — sheltering income. Rental losses are passive: they offset passive income freely, and up to $25,000/yr can offset ordinary (W-2) income if you actively participate and your MAGI is under $100k (phasing out to $0 by $150k); unused losses carry forward. On sale, claimed depreciation is recaptured at up to 25%, and gains may owe capital-gains tax (a 1031 exchange can defer both). Figures are a year-1 estimate at your 24.0% rate — not tax advice; consult a CPA.
Schools (NCES district)
- District
- Cape Henlopen School District
- NCES district ID
- 1000170
- Math proficiency
- 42% ▼ -14.00%
- Reading proficiency
- 55% ▼ -10.00%
- Median HH income
- $60,196
- Composite
- 42.47/100
- National rank
- #3214
- State rank
- #5 of 26 in DE
Livability — Lewes
- Score
- 67/100
- State rank
- #40
- US rank
- #11077
Category grades
Schools grade is shown separately in the Schools card above.
Census & demographics
- County
- Sussex County · 82,708 people
- City population
- 31,938
- Metro
- Salisbury, MD-DE
- Population (ZIP)
- 31,938
- Household income
- $97,197
- Rent vs Own
- Severe rent burden
- 545.0
Population outlook (Sussex County) Hauer SSP2
- Today (2025)
- 248,853 people
- By 2030
- 264,464 · +6.3%
- By 2040
- 290,980 · +16.9%
- By 2050
- 311,259 · +25.1%
- By 2075
- 352,488 · +41.6%
- By 2100
- 367,406 · +47.6%
Race, ethnicity, and origin ACS 2023
- Neighborhood character
- Predominantly White (88%)
- Race & ethnicity
- White 88% Two or more races 6% Hispanic / Latino 4% Black 2% Asian 2%
- Common ancestry
- Romanian 6% Slovak 3% Italian 2%
- Foreign-born
- 6% · Canada
- Languages at home
- 93% English-only · Spanish 3% Other Indo-European 1% Russian/Polish/Slavic 1%
Political lean MEDSL · Sussex
- 2024 margin
- R (+11.0) · D 43.9% · R 54.9% · Other 1.2%
- 2008→2024 swing
- -2.4pp toward R · 2008: -8.6pp · 2024: -11.0pp
- All cycles
- 2024: R+11.0 2020: R+11.2 2016: R+22.0 2012: R+13.0 2008: R+8.6
Not yet ingested
- Civics
- —
Market trends
- HPI YoY
- ▼ -204.07%
- Current HPI
- 299.0736
- Rent YoY
- ▲ 0.77%
- Metro
- Salisbury, MD-DE
- State GDP YoY
- —
- F500 in state
- 0
Price history
-1.5% since first listed2 events — show timeline
- 2026-04-06 Price Changed $449,000 Zillow
- 2026-03-06 Listed $455,900 Zillow
Property tax history
-29.1%/yrLatest (2025): $1,027 · -29.1% YoY. Source: county tax records.
Cash-flow waterfall
monthlySold comps — $/sqft
last 12 mo · ≤1 miLoading sold comps…