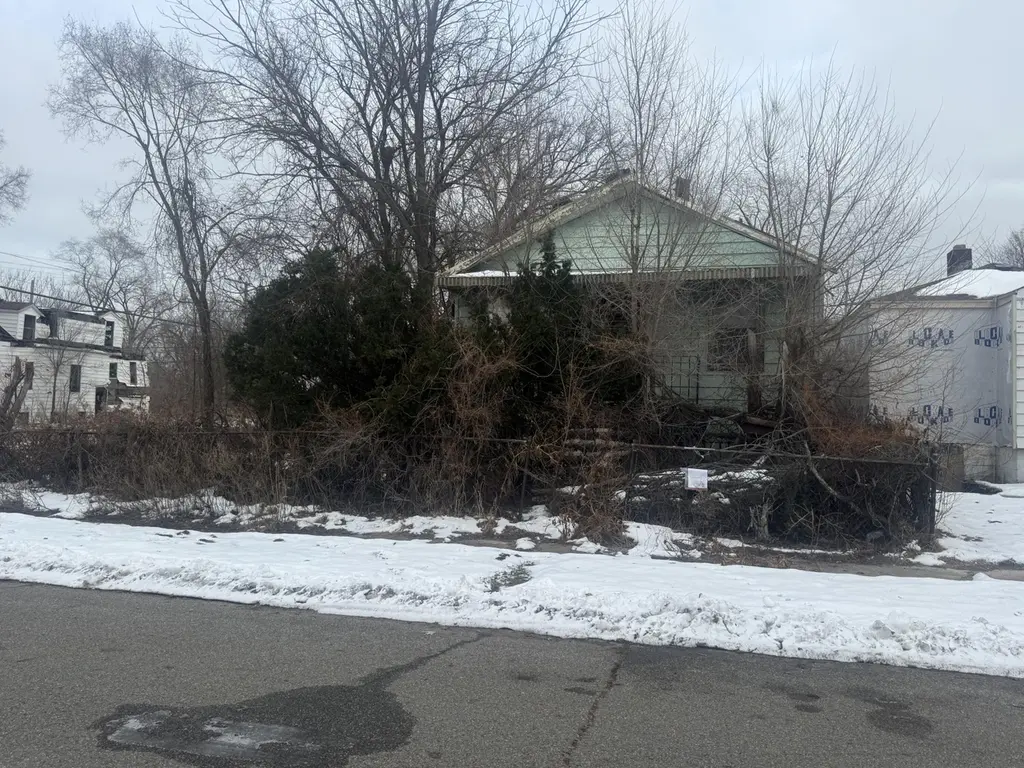
2409 Pennsylvania St · Gary, IN
Flood risk 1/10 · Minimal
- FEMA flood zone
- X (unshaded)
- Chance of flooding over 30 yrs
- 0.0%
- Est. flood insurance / yr
- $507 – $1,088
Fire risk 1/10 · Minimal
- Est. fire insurance / yr
- $717 – $1,331
Heat risk 3/10 · Minor
- Hot days now (above 102°F)
- 7 days/yr
- Hot days in 30 yrs
- 15 days/yr
Wind risk 2/10 · Minimal
- Chance of severe wind over 30 yrs
- —
Air-quality risk 4/10 · Minor
- Unhealthy air days now
- 6 days/yr
- Unhealthy air days in 30 yrs
- 7 days/yr
Risk factors via First Street. Map © Google.
Why this score? — see what drove the D+ grade
The composite is a weighted blend of 9 inputs, each scored 0–100. Each bar is that input's sub-score; the figure is the points it added to the 100-point composite (weight × sub-score).
- Cash flow +15.0/30.0
- ARV discount +7.5/15.0
- Appreciation +5.5/10.0
- 1% rule +5.0/10.0
- DSCR +5.0/10.0
- Livability +3.7/5.0
- Rent growth +2.5/5.0
- Condition / age +2.5/5.0
- Schools +0.5/10.0
$14,900
🖨 Deal sheet (PDF) 📄 Offer letter ✓ Due diligence
Listing remarks MLS
This duplex presents a prime opportunity for investors, flippers, or buy-and-hold buyers ready to take on a full renovation or complete tear-down project. Each unit offers a functional layout, providing flexibility for rental income, house hacking, or redevelopment to maximize value. Conveniently located near local schools, major highways for easy commuting, the beautiful Indiana Dunes National Park, and the popular Hard Rock Casino Northern Indiana, this property offers strong location appeal. Whether you choose to renovate, rebuild, or hold for future development, this is a project with serious upside for the right buyer. Bring your vision and unlock the potential this duplex has to offer!
Key facts
- Full renovation
- Functional layout
- Rental income
Tags
Neighborhood map
What this means for you Summary
Snapshot
- This is a 1-bed/1.0-bath townhouse listed at $15k.
Deal economics
- At list price, monthly cash flow is $735 ($9k/yr) — positive.
- The deal already cash-flows at list — no discount required.
- Meets the 1% rule at list price ($1k rent vs $15k).
- Recommended offer: $14k (6.0% below list) — sets the bar for market timing.
- Cap rate 65.5% vs local median 9.1% in Gary — top-decile yield for the area; either an underpriced asset or a hidden risk that comps aren't pricing in. Stress-test before assuming the spread holds.
Location & tenants
- Location reads 73/100 on livability (#105 in IN) — a middle-class / working-renter tenant base. Strengths: commute A+, cost of living A+, housing A+; Watch: schools F, crime F, employment F.
- Gary Community School Corporation (urban): math 3% / reading 11% proficiency, ranked #299 of 301 in IN (top 99%) — low school quality limits family demand, transient renter base, plan for 1-2y turnover; 80% free/reduced lunch — lower-income household profile, screen leases tightly.
- Market conditions: 122 active listings in the ZIP; 8 comparable units currently listed for rent nearby; rentals leasing fast (median 2d on market — plan ~1-2 weeks tenant-placement turnaround); lower-income renter base — watch delinquency; 1,642 units permitted in Lake County in 2024 (14 in 5+ unit buildings).
- This rent runs 45% of the median local income ($29k/yr) — at the standard rent-burdened threshold; future hikes will face affordability resistance.
Forward outlook
- In year one you build about $249 of equity ($103 loan paydown + $146 appreciation (1.0% local appreciation)).
- Lake County population projected to shrink 7% by 2050 — rents likely to lag national; underwrite the cash flow, not the appreciation.
- At projected returns (1.0% appreciation + 3.0% rent growth), your $4k cash investment doubles in ~1 year — after that, you're playing with house money.
Negotiation context
- It's been on market 62 days — a 6% lower offer ($14k) is reasonable based on typical stale-listing flexibility.
- 2 sale attempts with the ask held roughly flat each time — persistent listings suggest the price (not the market) is what's stuck; bring a comps-based counter.
Risks & watch-outs
- Watch-outs: built in 1947 — expect roof / HVAC / electrical / plumbing capex.
Questions for the listing agent
- It's been on market 62 days. Have you received any prior offers? Is the seller open to a 6% concession, seller financing, or rate buy-down credit?
- Built in 1947 — when were the roof, HVAC, electrical panel, plumbing, and water heater last replaced?
- Why hasn't it sold? Are there any deal-killer items the seller is aware of (foundation, flood, title, zoning, code violations)?
- Is there a deadline driving the sale (1031 exchange, divorce, estate, relocation)? That informs how much negotiation room exists.
- Schools are F-rated, which usually means shorter tenancies and higher turnover. Who's the typical renter profile here, and what's been the actual vacancy rate?
- Crime grade is F in this area — have there been break-ins, vandalism, or insurance claims at this property in the last 3 years? What carrier currently insures it and at what premium?
- The area grade is low — what's the realistic commute time and amenity access for the typical tenant pool here? Any planned neighborhood developments (good or bad) we should know about?
- What's the average days-on-market for RENTAL listings here right now (not sales)? A rising rental-DOM trend means longer vacancies and softer asking-rent achievability than the comps imply.
- What's the recent tenant-quality profile in this submarket — average credit score on applications, eviction rate, late-payment / NSF rate, and stable-employment percentage? A property-management company in the area should have these aggregated.
- How much new for-sale + rental construction is in the pipeline within 1–3 miles? Heavy new supply typically softens prices + rents 12–24 months out; constrained supply supports both.
Investment metrics
- 1% rule
- 7.10% ✓
- Cap rate
- 65.51%
- Cash-on-cash
- 211.49%
- DSCR
- 10.41
- GRM
- 1.2
CMA / ARV
No comps found within radius.
Projected returns pro-forma
0.98% appreciation · 3.0% rent growth · sell at horizon
- IRR
- —
- Equity multiple
- 12.29×
- Total profit
- $47,109
- Equity at exit
- $5,071
- IRR
- —
- Equity multiple
- 25.97×
- Total profit
- $104,162
- Equity at exit
- $6,726
Cash invested: $4,172 (down + closing). Projections, not guarantees.
Landlord ↔ Tenant lean methodology
- Overall (STATE)
- 90 Strongly Landlord-Friendly
- State Indiana
- 90 Strongly Landlord-Friendly · R+11
- County
- — inherits STATE
- City
- — inherits STATE
ZIP-level market 46407
- Home prices YoY
- 0.4%
- Active inventory
- 122
- Price-to-rent
- 1.2×
Monthly cashflow live
- Estimated rent
- $1,058 high interval (Pro) →
- Mortgage (P&I)
- −$78
- Tax from tax record
- −$17 /mo · $198/yr
- Insurance
- −$6
- HOA
- −$0
- Vacancy / Maint / Mgmt
- −$222
- Net cashflow
- $735
Break-even live
Sensitivity live
| Price | -10% $744 | -5% $739 | +0% $735 | +5% $731 | +10% $727 |
|---|---|---|---|---|---|
| Rent | -10% $652 | -5% $693 | +0% $735 | +5% $777 | +10% $819 |
| Rate | -1.0pp $743 | -0.5pp $739 | base $735 | +0.5pp $731 | +1.0pp $727 |
UW: 25.0% down · 7.5% · 30yr · 1.5% tax · 5.0% vac · 8.0% maint · 8.0% mgmt
Financing live
Cash to close
- Down payment
- $3,725
- Closing costs
- $447
- Reserves months
- —
- Total cash needed
- —
Loan-product check · same deal, 3 products live
Conventional
25% down · 7.5% · 30yr
- Down + closing
- —
- Monthly P&I
- —
- Monthly cashflow
- —
- DSCR
- —
- Eligible?
- —
Personal DTI + credit; lowest rate.
DSCR
20% down · 8.5% · 30yr
- Down + closing
- —
- Monthly P&I
- —
- Monthly cashflow
- —
- DSCR
- —
- Eligible?
- —
No personal income docs; deal must DSCR.
Hard money
10% down · 12.0% · 12mo
- Down + closing
- —
- Monthly P&I
- —
- Monthly cashflow
- —
- DSCR
- —
- Eligible?
- —
Short-term bridge; refi at stabilization.
Rent comps 8 comps
| Address | Beds | Baths | Sqft | Rent | $/sqft | DOM | Units | Dist |
|---|---|---|---|---|---|---|---|---|
| 2453 Prospect St Gary, IN | 2.0 | 1.0 | 704 | $1,095 | $1.56 | 2d | 1 | 0.28mi |
| 2355 Rhode Island St Gary, IN | 2.0 | 1.0 | 701 | $1,095 | $1.56 | 44d | 1 | 0.38mi |
| 2378 Jackson St Gary, IN | 2.0 | 1.0 | 672 | $1,050 | $1.56 | 2d | 1 | 0.56mi |
| 2572-76 Van Buren Pl Gary, IN | 2.0 | 1.0 | 700 | $1,025 | $1.46 | 2d | 1 | 0.65mi |
| 837 W 27th Ave Unit A Gary, IN | 2.0 | 1.0 | 750 | $1,150 | $1.53 | 2d | 1 | 0.84mi |
| 837 W 27th Ave Unit B Gary, IN | 1.0 | 1.0 | 750 | $950 | $1.27 | 2d | 1 | 0.84mi |
| 1316 Delaware St Unit 2 Gary, IN | 2.0 | 1.0 | 700 | $950 | $1.36 | 21d | 1 | 1.00mi |
| 1843 Illinois St Gary, IN | 2.0 | 1.0 | 725 | $1,200 | $1.66 | 17d | 1 | 1.06mi |
Listing history 19 events
-
2026-06-21days on market $14,900 Active 62 DOM
-
2026-06-18days on market $14,900 Active 59 DOM
-
2026-06-17days on market $14,900 Active 58 DOM
-
2026-06-16days on market $14,900 Active 57 DOM
-
2026-06-15days on market $14,900 Active 56 DOM
-
2026-06-13days on market $14,900 Active 54 DOM
-
2026-06-13days on market $14,900 Active 53 DOM
-
2026-06-09days on market $14,900 Active 50 DOM
-
2026-06-08days on market $14,900 Active 49 DOM
-
2026-06-07days on market $14,900 Active 48 DOM
-
2026-06-04days on market $14,900 Active 45 DOM
-
2026-06-03days on market $14,900 Active 44 DOM
-
2026-06-02days on market $14,900 Active 43 DOM
-
2026-06-01days on market $14,900 Active 42 DOM
-
2026-05-31days on market $14,900 Active 41 DOM
-
2026-04-20$14,900 Active 700-char remark
Show marketing remark (700 chars)
This duplex presents a prime opportunity for investors, flippers, or buy-and-hold buyers ready to take on a full renovation or complete tear-down project. Each unit offers a functional layout, providing flexibility for rental income, house hacking, or redevelopment to maximize value. Conveniently located near local schools, major highways for easy commuting, the beautiful Indiana Dunes National Park, and the popular Hard Rock Casino Northern Indiana, this property offers strong location appeal. Whether you choose to renovate, rebuild, or hold for future development, this is a project with serious upside for the right buyer. Bring your vision and unlock the potential this duplex has to offer!
-
2026-04-08historical
-
2026-01-20price $19,400
-
2025-12-22$22,900 Active
ⓘ Source: listings_history table (triggers on properties + properties_extension) + one-shot
backfill from property_details.listing_events for pre-trigger history.
Tax reassessment forecast IN · Partial reset (capped growth)
- Current annual tax
- $198 · $17/mo
- Projected year-2 tax
- $198 · $17/mo
- Expected delta
- $0/yr ($0/mo · 0.0%)
ⓘ Screening estimate from a state-policy table — verify with the county assessor before closing.
Climate risk First Street
- Flood 1/10 Low FEMA zone X (unshaded) · 0% chance over 30 yrs
- Wildfire 1/10 Low
- Heat 3/10 Moderate 7 d/yr ≥102°F today · 15 d/yr by 30 yrs out
- Wind 2/10 Low
- Air quality 4/10 Moderate 6 unhealthy d/yr today · 7 by 30 yrs out
Nearby sold comps map
Loading sold comps map…
Walkable amenities ~0.75 mi
Loading nearby amenities…
Taxation est. · year 1
- Rental income
- $12,701
- − Mortgage interest
- −$835
- − Property taxes
- −$198
- − Insurance
- −$74
- − Repairs & maintenance
- −$1,016
- − Management
- −$1,016
- − Depreciation
- −$433
- Taxable income
- $9,128
- Est. tax owed @ 24.0%
- −$2,191
- After-tax cash flow
- $6,633/yr
For passive investors: Depreciation is non-cash, so a rental often shows a tax loss while cash-flowing — sheltering income. Rental losses are passive: they offset passive income freely, and up to $25,000/yr can offset ordinary (W-2) income if you actively participate and your MAGI is under $100k (phasing out to $0 by $150k); unused losses carry forward. On sale, claimed depreciation is recaptured at up to 25%, and gains may owe capital-gains tax (a 1031 exchange can defer both). Figures are a year-1 estimate at your 24.0% rate — not tax advice; consult a CPA.
Schools (NCES district)
- District
- Gary Community School Corporation
- NCES district ID
- 1803870
- Math proficiency
- 3% ▼ -10.00%
- Reading proficiency
- 11% ▼ -6.00%
- Median HH income
- $27,739
- Composite
- 4.98/100
- National rank
- #10039
- State rank
- #299 of 301 in IN
Livability — Gary
- Score
- 73/100
- State rank
- #105
- US rank
- #5592
Category grades
Schools grade is shown separately in the Schools card above.
Census & demographics
- Census place
- Gary, IN
- County
- Lake County · 422,878 people
- City population
- 63,701
- Metro
- Chicago-Naperville-Elgin, IL-IN-WI
- Population (ZIP)
- 8,577
- Household income
- $28,526
- Rent vs Own
- Severe rent burden
- 392.0
Population outlook (Lake County) Hauer SSP2
- Today (2025)
- 484,026 people
- By 2030
- 478,091 · -1.2%
- By 2040
- 462,974 · -4.3%
- By 2050
- 449,894 · -7.1%
- By 2075
- 436,169 · -9.9%
- By 2100
- 426,607 · -11.9%
Race, ethnicity, and origin ACS 2023
- Neighborhood character
- Predominantly Black (91%)
- Race & ethnicity
- Black 91% Hispanic / Latino 3% White 2% Two or more races 1%
- Common ancestry
- Romanian 1%
- Foreign-born
- 1% · Canada
- Languages at home
- 97% English-only · Spanish 1% Russian/Polish/Slavic 1% French/Haitian/Cajun 1%
Political lean MEDSL · Lake
- 2024 margin
- Lean D (+5.6) · D 52.1% · R 46.5% · Other 1.5%
- 2008→2024 swing
- -28.6pp toward R · 2008: 34.3pp · 2024: 5.6pp
- All cycles
- 2024: D+5.6 2020: D+15.1 2016: D+20.6 2012: D+31.0 2008: D+34.3
Not yet ingested
- Civics
- —
Market trends
- HPI YoY
- ▲ 0.98%
- Current HPI
- 253.2856
- Rent YoY
- —
- Metro
- Chicago-Naperville-Elgin, IL-IN-WI
- State GDP YoY
- ▲ 2.90%
- F500 in state
- 18
Industry mix (Fortune 500 HQ in IN)
| Industry | F500 HQs | Revenue |
|---|---|---|
| Industrial Machinery | 2 | $37B |
|
||
| Healthcare | 1 | $177B |
|
||
| Pharmaceuticals | 1 | $45B |
|
||
| Metals / Steel | 1 | $18B |
|
||
| Agriculture | 1 | $17B |
|
||
| Packaging | 1 | $12B |
|
||
Price history
-34.9% since first listed4 events — show timeline
- 2026-04-20 Listed $14,900 NIRA MLS as Distributed by MLS Grid
- 2026-04-08 Listing Removed — NIRA MLS as Distributed by MLS Grid
- 2026-01-20 Price Changed $19,400 NIRA MLS as Distributed by MLS Grid
- 2025-12-22 Listed $22,900 NIRA MLS as Distributed by MLS Grid
Property tax history
-20.4%/yrLatest (2024): $198 · -0.5% YoY. Source: county tax records.
Cash-flow waterfall
monthlySold comps — $/sqft
last 12 mo · ≤1 miLoading sold comps…