419 Cambridge Dr · Bismarck, ND
Flood risk 1/10 · Minimal
- FEMA flood zone
- X (shaded)
- Chance of flooding over 30 yrs
- 0.0%
- Est. flood insurance / yr
- $473 – $860
Fire risk 3/10 · Minor
- Est. fire insurance / yr
- $1,289 – $2,393
Heat risk 2/10 · Minimal
- Hot days now (above 97°F)
- 7 days/yr
- Hot days in 30 yrs
- 12 days/yr
Wind risk 2/10 · Minimal
- Chance of severe wind over 30 yrs
- —
Air-quality risk 4/10 · Minor
- Unhealthy air days now
- 5 days/yr
- Unhealthy air days in 30 yrs
- 5 days/yr
Risk factors via First Street. Map © Google.
Why this score? — see what drove the D+ grade
The composite is a weighted blend of 9 inputs, each scored 0–100. Each bar is that input's sub-score; the figure is the points it added to the 100-point composite (weight × sub-score).
- Cash flow +15.0/30.0
- ARV discount +10.2/15.0
- 1% rule +5.0/10.0
- DSCR +5.0/10.0
- Livability +4.0/5.0
- Schools +3.7/10.0
- Rent growth +3.2/5.0
- Condition / age +2.5/5.0
- Appreciation +0.0/10.0
$24,900
🖨 Deal sheet 📄 Offer letter ✓ Due diligence
Listing remarks MLS
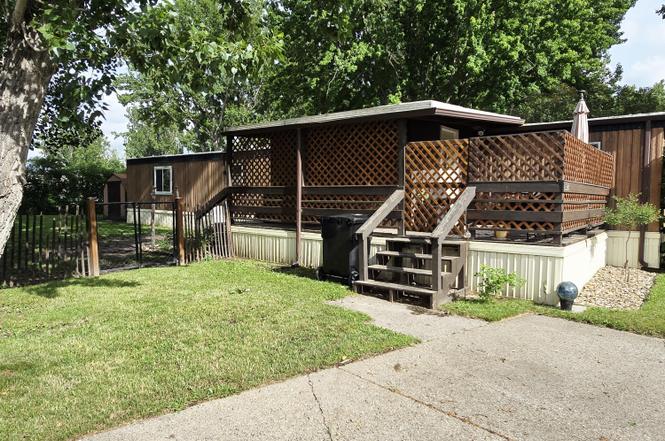
Updated home in Tatley Meadows Park - features master bedroom suite with garden tub and walk-in closet. Updates include: counters and back splash in kitchen, light fixtures, flooring and new heat tape. Spacious yard has a newly painted 8x12 shed and covered deck. Park approval is required.
Key facts
- Walk-in closet
- Large backyard
- 8x12 storage shed
Tags
Property features AI
Finance
- Other: Monthly association fee amount: $636
- HOA & community: Has homeowners association; Community amenities include a playground and pool; Monthly association fee; Association fee covers trash and water
Exterior
- Parking: Off-street parking; Driveway; Concrete surface; No garage (see remarks)
- Utilities: Public water; Public sewer
- Home design: Manufactured home (single wide); Residential property; Rectangular lot; Lot is rented
- Construction: Metal siding
- Exterior features: Deck; Enclosed deck/porch; Porch; Shed(s); No other exterior features listed
Interior
- Kitchen: Dishwasher; Electric range; Range hood; Refrigerator
- Bedrooms: 9 total rooms (bedroom count not specified)
- Bathrooms: 2 full bathrooms
- Heating & cooling: Central air conditioning; Forced air heating; Natural gas heating
- Interior features: Walk-in closet(s); Window treatments; See remarks for additional interior details
- Laundry & utility: No basement
Neighborhood map
What this means for you Summary
Snapshot
- This is a 3-bed/2.0-bath manufactured listed at $25k.
Deal economics
- At list price, monthly cash flow is $726 ($9k/yr) — positive.
- The deal already cash-flows at list — no discount required.
- Meets the 1% rule at list price ($2k rent vs $25k).
- Cap rate 41.3% vs local median 3.1% in Bismarck — top-decile yield for the area; either an underpriced asset or a hidden risk that comps aren't pricing in. Stress-test before assuming the spread holds.
Location & tenants
- Location reads 79/100 on livability (#5 in ND, #2,213 nationally) — a middle-class / working-renter tenant base. Strengths: housing A+, health & safety A+, cost of living A; Watch: crime C-, amenities D+, commute F.
- Bismarck 1 (urban): math 41% / reading 42% proficiency, ranked #25 of 53 in ND (top 47%) — families likely to look elsewhere, expect single-tenant / working-renter base with shorter leases; only 19% free/reduced lunch — higher-income household profile.
- Market conditions: Rents rising (+2.8%/yr); 258 active listings in the ZIP; 7 comparable units currently listed for rent nearby; rentals at typical pace (median 21d on market — plan ~3-4 weeks tenant-placement turnaround); solid renter incomes; 259 units permitted in Burleigh County in 2024 (0 in 5+ unit buildings).
Forward outlook
- Local home prices are declining (-3.0%/yr); year-one equity from $172 of loan paydown is wiped out by about $747 of value loss. Plan a longer hold.
- Burleigh County population projected at +61% by 2050 — long-run rental-demand tailwind backs the buy-and-hold thesis.
- At projected returns (-3.0% appreciation + 2.8% rent growth), your $7k cash investment doubles in ~1 year — after that, you're playing with house money.
Negotiation context
- Only 2 days on market — expect competitive offers; lowballing is unlikely to land.
- 5 sale attempts since 10y ago with the ask held roughly flat each time — persistent listings suggest the price (not the market) is what's stuck; bring a comps-based counter.
Risks & watch-outs
- Watch-outs: HOA is 33% of rent.
Questions for the listing agent
- What does the HOA fee cover, when was the last increase, and are there any pending special assessments or reserve-fund shortfalls?
- Is there a deadline driving the sale (1031 exchange, divorce, estate, relocation)? That informs how much negotiation room exists.
- Schools are B-rated — typically a magnet for longer-tenancy family renters. What's the average tenant stay here, and is there a school-zone premium baked into asking?
- The area grade is low — what's the realistic commute time and amenity access for the typical tenant pool here? Any planned neighborhood developments (good or bad) we should know about?
- What's the average days-on-market for RENTAL listings here right now (not sales)? A rising rental-DOM trend means longer vacancies and softer asking-rent achievability than the comps imply.
- What's the recent tenant-quality profile in this submarket — average credit score on applications, eviction rate, late-payment / NSF rate, and stable-employment percentage? A property-management company in the area should have these aggregated.
- How much new for-sale + rental construction is in the pipeline within 1–3 miles? Heavy new supply typically softens prices + rents 12–24 months out; constrained supply supports both.
Investment metrics
- 1% rule
- 7.72% ✓
- Cap rate
- 41.30%
- Cash-on-cash
- 125.04%
- DSCR
- 6.56
- GRM
- 1.1
CMA / ARV
- ARV (on-the-fly)
- $26,460
- Comps found
- 4
Show comp detail 4 sales within ~0.75 mi
| Address | Dist | Beds/Ba | Sqft | Sold | Price | $/sf | Match |
|---|---|---|---|---|---|---|---|
| 522 Sherwood Ln | 0.11mi | 3/1.0 | 952 (-3%) | 6mo | $27,000 | $28 | 82 |
| 305 Dover Dr | 0.20mi | 3/1.5 | 980 (0%) | 12mo | $8,000 | $8 | 79 |
| 528 Sherwood Ln | 0.15mi | 2/1.0 (-1) | 1,064 (+9%) | 8mo | $8,000 | $8 | 63 |
| 606 Yorkshire Ln | 0.37mi | 2/1.0 (-1) | 980 (0%) | 22mo | $26,000 | $27 | 56 |
Match score weights: distance 35% · size 25% · config 20% · recency 20%. Top-matched comps best support the ARV.
Projected returns pro-forma
-3.0% appreciation · 2.81% rent growth · sell at horizon
- IRR
- —
- Equity multiple
- 7.06×
- Total profit
- $42,277
- Equity at exit
- $3,713
- IRR
- —
- Equity multiple
- 14.85×
- Total profit
- $96,558
- Equity at exit
- $2,153
Cash invested: $6,972 (down + closing). Projections, not guarantees.
Landlord ↔ Tenant lean methodology
- Overall (STATE)
- 82 Strongly Landlord-Friendly
- State North Dakota
- 82 Strongly Landlord-Friendly · R+20
- County
- — inherits STATE
- City
- — inherits STATE
ZIP-level market 58504
- Rents YoY
- 2.8%
- Active inventory
- 258
- Price-to-rent
- 1.1×
Monthly cashflow live
- Estimated rent
- $1,921 high interval (Pro) →
- Mortgage (P&I)
- −$131
- Tax from tax record
- −$14 /mo · $174/yr
- Insurance
- −$10
- HOA
- −$636
- Vacancy / Maint / Mgmt
- −$403
- Net cashflow
- $726
Break-even live
UW: 25.0% down · 7.5% · 30yr · 1.5% tax · 5.0% vac · 8.0% maint · 8.0% mgmt
Financing live
Cash to close
- Down payment
- $6,225
- Closing costs
- $747
- Reserves months
- —
- Total cash needed
- —
Loan-product check · same deal, 3 products live
Conventional
25% down · 7.5% · 30yr
- Down + closing
- —
- Monthly P&I
- —
- Monthly cashflow
- —
- DSCR
- —
- Eligible?
- —
Personal DTI + credit; lowest rate.
DSCR
20% down · 8.5% · 30yr
- Down + closing
- —
- Monthly P&I
- —
- Monthly cashflow
- —
- DSCR
- —
- Eligible?
- —
No personal income docs; deal must DSCR.
Hard money
10% down · 12.0% · 12mo
- Down + closing
- —
- Monthly P&I
- —
- Monthly cashflow
- —
- DSCR
- —
- Eligible?
- —
Short-term bridge; refi at stabilization.
Rent comps 7 comps
| Address | Beds | Baths | Sqft | Rent | $/sqft | DOM | Units | Dist |
|---|---|---|---|---|---|---|---|---|
| 119 Irvine Loop Bismarck, ND | 3.0 | 1.0–2.0 | 974 | $2,400 | $2.46 | 21d | 1 | 0.17mi |
| 100 Santa Fe Ave Unit 1204 Bismarck, ND | 2.0 | 2.0 | 976 | $1,525 | $1.56 | 21d | 1 | 0.22mi |
| 100 Santa Fe Ave Unit 2210 Bismarck, ND | 2.0 | 2.0 | 1039 | $1,595 | $1.54 | 21d | 1 | 0.22mi |
| 2900 Kamrose Dr Bismarck, ND | 3.0 | 1.0–2.0 | 1040 | $2,580 | $2.48 | 21d | 33 | 0.32mi |
| 109 W Burleigh Ave Bismarck, ND | 1.0–3.0 | 1.0–2.0 | 1050 | $1,395 | $1.33 | 21d | 1 | 0.68mi |
| 2130 S 12th St Bismarck, ND | 1.0–3.0 | 1.0–2.0 | 1152 | $1,980 | $1.72 | 21d | 12 | 1.17mi |
| 2020 S 12th St Bismarck, ND | 3.0 | 1.0–2.0 | 1185 | $1,955 | $1.65 | 21d | 19 | 1.22mi |
HOA detail
- Monthly dues
- $636 · $7,632/yr
Listing history 2 events
-
2026-06-19days on market $24,900 Active 2 DOM
-
2026-06-18$24,900 Active 1 DOM
ⓘ Source: listings_history table (triggers on properties + properties_extension) + one-shot
backfill from property_details.listing_events for pre-trigger history.
Tax reassessment forecast ND · Resets to sale price
- Current annual tax
- $174 · $14/mo
- Projected year-2 tax
- $244 · $20/mo
- Expected delta
- +$70/yr (+$6/mo · 40.2%)
ⓘ Screening estimate from a state-policy table — verify with the county assessor before closing.
Climate risk First Street
- Flood 1/10 Low FEMA zone X (shaded) · 0% chance over 30 yrs
- Wildfire 3/10 Moderate
- Heat 2/10 Low 7 d/yr ≥97°F today · 12 d/yr by 30 yrs out
- Wind 2/10 Low
- Air quality 4/10 Moderate 5 unhealthy d/yr today · 5 by 30 yrs out
Nearby sold comps map
Loading sold comps map…
Walkable amenities ~0.75 mi
Loading nearby amenities…
Taxation est. · year 1
- Rental income
- $23,057
- − Mortgage interest
- −$1,395
- − Property taxes
- −$174
- − Insurance
- −$124
- − Repairs & maintenance
- −$1,845
- − Management
- −$1,845
- − HOA
- −$7,632
- − Depreciation
- −$724
- Taxable income
- $9,318
- Est. tax owed @ 24.0%
- −$2,236
- After-tax cash flow
- $6,481/yr
For passive investors: Depreciation is non-cash, so a rental often shows a tax loss while cash-flowing — sheltering income. Rental losses are passive: they offset passive income freely, and up to $25,000/yr can offset ordinary (W-2) income if you actively participate and your MAGI is under $100k (phasing out to $0 by $150k); unused losses carry forward. On sale, claimed depreciation is recaptured at up to 25%, and gains may owe capital-gains tax (a 1031 exchange can defer both). Figures are a year-1 estimate at your 24.0% rate — not tax advice; consult a CPA.
Schools (NCES district)
- District
- Bismarck 1
- NCES district ID
- 3800014
- Math proficiency
- 41% ▼ -5.00%
- Reading proficiency
- 42% ▼ -6.00%
- Median HH income
- $60,649
- Composite
- 36.76/100
- National rank
- #4577
- State rank
- #25 of 53 in ND
Livability — Bismarck
- Score
- 79/100
- State rank
- #5
- US rank
- #2213
Category grades
Schools grade is shown separately in the Schools card above.
Census & demographics
- Census place
- Bismarck, ND
- County
- Burleigh County · 97,300 people
- City population
- 97,300
- Metro
- Bismarck, ND
- Population (ZIP)
- 30,212
- Household income
- $85,637
- Rent vs Own
- Severe rent burden
- 400.0
Population outlook (Burleigh County) Hauer SSP2
- Today (2025)
- 119,359 people
- By 2030
- 133,047 · +11.5%
- By 2040
- 161,545 · +35.3%
- By 2050
- 191,960 · +60.8%
- By 2075
- 274,569 · +130.0%
- By 2100
- 350,910 · +194.0%
Race, ethnicity, and origin ACS 2023
- Neighborhood character
- Predominantly White (84%)
- Race & ethnicity
- White 84% Native American 8% Two or more races 5% Hispanic / Latino 4%
- Common ancestry
- Portuguese 13% Scotch-Irish 5% Romanian 2%
- Foreign-born
- 2% · Canada
- Languages at home
- 97% English-only · Spanish 2%
Political lean MEDSL · Burleigh
- 2024 margin
- Solid R (+43.2) · D 27.5% · R 70.7% · Other 1.8%
- 2008→2024 swing
- -19.7pp toward R · 2008: -23.6pp · 2024: -43.2pp
- All cycles
- 2024: R+43.2 2020: R+40.2 2016: R+46.1 2012: R+32.1 2008: R+23.6
Not yet ingested
- Civics
- —
Market trends
- HPI YoY
- ▼ -158.70%
- Current HPI
- 210.0651
- Rent YoY
- ▲ 2.81%
- Metro
- Bismarck, ND
- State GDP YoY
- ▲ 2.09%
- F500 in state
- 2
Industry mix (Fortune 500 HQ in ND)
| Industry | F500 HQs | Revenue |
|---|---|---|
| Utilities / Construction | 1 | $6B |
|
||
Price history
-26.5% since first listed9 events — show timeline
- 2026-06-17 Listed $24,900 GNMLS
- 2024-09-10 Price Changed $28,000 GNMLS
- 2024-08-23 Relisted — GNMLS
- 2024-08-20 Pending — GNMLS
- 2024-08-08 Listed $29,900 GNMLS
- 2018-01-12 Sold (MLS) — GNMLS
- 2017-02-18 Listed $22,900 GNMLS
- 2017-02-10 Sold (MLS) — GNMLS
- 2016-12-27 Listed $33,900 GNMLS
Cash-flow waterfall
monthlySold comps — $/sqft
last 12 mo · ≤1 miLoading sold comps…