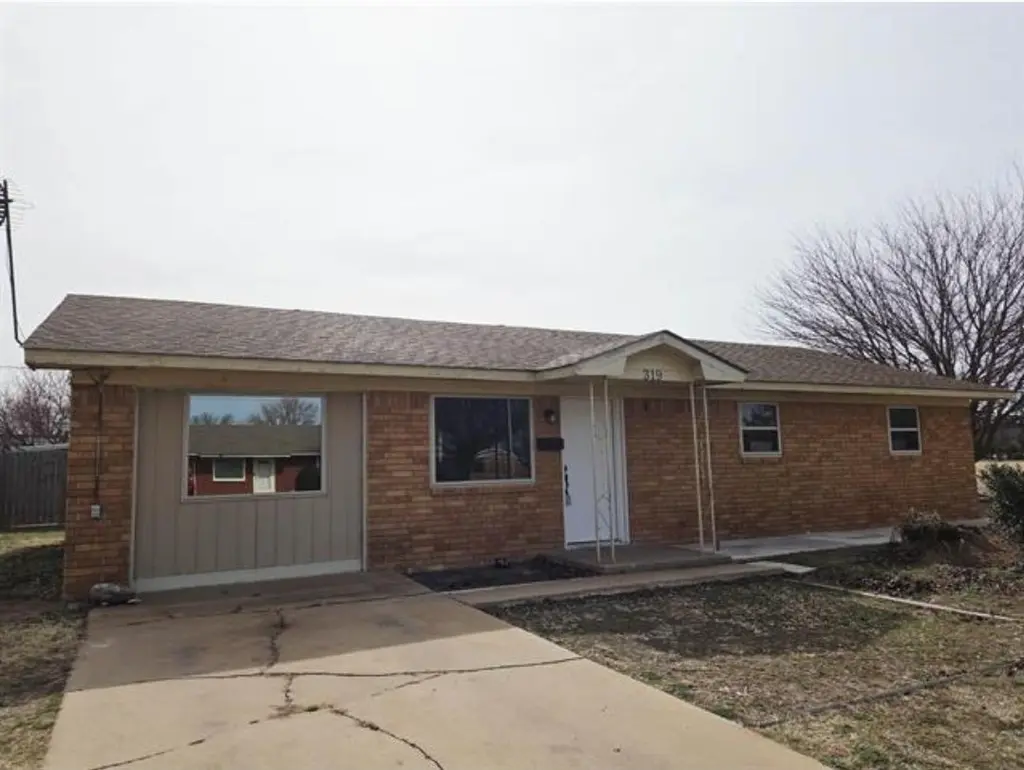
319 W Ash St · Fairview, OK
Flood risk 1/10 · Minimal
- FEMA flood zone
- X (shaded)
- Chance of flooding over 30 yrs
- 0.0%
- Est. flood insurance / yr
- $507 – $1,088
Fire risk 5/10 · Moderate
- Est. fire insurance / yr
- $2,463 – $4,575
Heat risk 6/10 · Moderate
- Hot days now (above 108°F)
- 7 days/yr
- Hot days in 30 yrs
- 18 days/yr
Wind risk 2/10 · Minimal
- Chance of severe wind over 30 yrs
- 1.0%
Air-quality risk 2/10 · Minimal
- Unhealthy air days now
- 0 days/yr
- Unhealthy air days in 30 yrs
- 1 days/yr
Risk factors via First Street. Map © Google.
Why this score? — see what drove the C- grade
The composite is a weighted blend of 9 inputs, each scored 0–100. Each bar is that input's sub-score; the figure is the points it added to the 100-point composite (weight × sub-score).
- Cash flow +18.9/30.0
- ARV discount +8.6/15.0
- DSCR +6.0/10.0
- Appreciation +4.7/10.0
- 1% rule +4.2/10.0
- Livability +3.6/5.0
- Schools +3.0/10.0
- Rent growth +2.5/5.0
- Condition / age +2.5/5.0
$103,000
🖨 Deal sheet 📄 Offer letter ✓ Due diligence
Listing remarks
3 Bed, 1.5 Bath with office/bonus area. This home has newer vinyl windows throughout. Updated bathrooms. New carpet. New roof May 2026. This house has so much potential. Come check it out today!
Key facts
- Newer vinyl windows
- New carpet
- Updated bathrooms
Tags
Property features AI
Exterior
- Utilities: Public water; Public sewer
- Home design: Single-family residence; Single-story
- Construction: Brick veneer construction; Composition roof; Built area: 1,026 above-grade finished square feet
- Exterior features: Wood fencing; Shed on the property; Corner lot
Interior
- Flooring: Concrete
- Bathrooms: 1 full bathroom; 1 half bathroom
- Heating & cooling: Central heating (natural gas); Central air conditioning
- Interior features: Concrete flooring; Central heating and cooling
Neighborhood map
What this means for you Summary
Snapshot
- This is a 3-bed/2.0-bath single-family listed at $103k.
Deal economics
- At list price, monthly cash flow is $106 ($1k/yr) — positive.
- The deal already cash-flows at list — no discount required.
- To meet the 1% rule (rent ≥ 1% of price), the offer needs to be $95k (8.2% below list).
- Recommended offer: $95k (8.2% below list) — sets the bar for 1% rule.
Location & tenants
- Location reads 72/100 on livability (#22 in OK) — a middle-class / working-renter tenant base. Strengths: crime A+, cost of living A+, housing A+; Watch: schools C-, health & safety C-, amenities F.
- Fairview (rural): math 34% / reading 35% proficiency, ranked #40 of 270 in OK (top 15%) — families likely to look elsewhere, expect single-tenant / working-renter base with shorter leases.
- Market conditions: 11 active listings in the ZIP; 2 units permitted in Major County in 2024 (0 in 5+ unit buildings).
Forward outlook
- In year one you build about $84 of equity ($712 loan paydown + $-628 appreciation (-0.6% local appreciation)).
- Major County population projected at +19% by 2050 — long-run rental-demand tailwind backs the buy-and-hold thesis.
Negotiation context
- Only 8 days on market — expect competitive offers; lowballing is unlikely to land.
- Current owner paid $65k; list at $103k implies a 58% gain — meaningful room to come down on a strong offer.
Risks & watch-outs
- Climate carrying-cost: moderate wildfire risk; extreme-heat days projected 7→18/yr by 2055 (HVAC capex compounding) — expect insurance premiums to compound above CPI over the hold.
Questions for the listing agent
- Built in 1969 — when were the roof, HVAC, electrical panel, plumbing, and water heater last replaced?
- Is there a deadline driving the sale (1031 exchange, divorce, estate, relocation)? That informs how much negotiation room exists.
- What's the average days-on-market for RENTAL listings here right now (not sales)? A rising rental-DOM trend means longer vacancies and softer asking-rent achievability than the comps imply.
- What's the recent tenant-quality profile in this submarket — average credit score on applications, eviction rate, late-payment / NSF rate, and stable-employment percentage? A property-management company in the area should have these aggregated.
- How much new for-sale + rental construction is in the pipeline within 1–3 miles? Heavy new supply typically softens prices + rents 12–24 months out; constrained supply supports both.
Investment metrics
- 1% rule
- 0.92% ✗
- Cap rate
- 7.53%
- Cash-on-cash
- 4.40%
- DSCR
- 1.20
- GRM
- 9.1
CMA / ARV
- ARV (on-the-fly)
- $105,678
- Comps found
- 2
Show comp detail 2 sales within ~0.75 mi
| Address | Dist | Beds/Ba | Sqft | Sold | Price | $/sf | Match |
|---|---|---|---|---|---|---|---|
| 402 W Cherry | 0.10mi | 3/2.0 | 1,069 (+4%) | 1mo | $110,000 | $103 | 88 |
| 606 N 8th Ave | 0.49mi | 2/1.0 (-1) | 1,032 (+1%) | 12mo | $89,900 | $87 | 57 |
Match score weights: distance 35% · size 25% · config 20% · recency 20%. Top-matched comps best support the ARV.
Projected returns pro-forma
-0.61% appreciation · 3.0% rent growth · sell at horizon
- IRR
- 0.6%
- Equity multiple
- 1.03×
- Total profit
- $785
- Equity at exit
- $26,808
- IRR
- 6.7%
- Equity multiple
- 1.68×
- Total profit
- $19,556
- Equity at exit
- $29,844
Cash invested: $28,840 (down + closing). Projections, not guarantees.
Landlord ↔ Tenant lean methodology
- Overall (STATE)
- 83 Strongly Landlord-Friendly
- State Oklahoma
- 83 Strongly Landlord-Friendly · R+20
- County
- — inherits STATE
- City
- — inherits STATE
ZIP-level market 73737
- Home prices YoY
- -0.3%
- Active inventory
- 11
- Price-to-rent
- 9.1×
Monthly cashflow live
- Estimated rent
- $945 medium interval (Pro) →
- Mortgage (P&I)
- −$540
- Tax from tax record
- −$58 /mo · $695/yr
- Insurance
- −$43
- HOA
- −$0
- Vacancy / Maint / Mgmt
- −$199
- Net cashflow
- $106
Break-even live
UW: 25.0% down · 7.5% · 30yr · 1.5% tax · 5.0% vac · 8.0% maint · 8.0% mgmt
Financing live
Cash to close
- Down payment
- $25,750
- Closing costs
- $3,090
- Reserves months
- —
- Total cash needed
- —
Loan-product check · same deal, 3 products live
Conventional
25% down · 7.5% · 30yr
- Down + closing
- —
- Monthly P&I
- —
- Monthly cashflow
- —
- DSCR
- —
- Eligible?
- —
Personal DTI + credit; lowest rate.
DSCR
20% down · 8.5% · 30yr
- Down + closing
- —
- Monthly P&I
- —
- Monthly cashflow
- —
- DSCR
- —
- Eligible?
- —
No personal income docs; deal must DSCR.
Hard money
10% down · 12.0% · 12mo
- Down + closing
- —
- Monthly P&I
- —
- Monthly cashflow
- —
- DSCR
- —
- Eligible?
- —
Short-term bridge; refi at stabilization.
Listing history 7 events
-
2026-06-18days on market $103,000 Active 8 DOM
-
2026-06-17days on market $103,000 Active 7 DOM
-
2026-06-16days on market $103,000 Active 6 DOM
-
2026-06-15days on market $103,000 Active 5 DOM
-
2026-06-13days on market $103,000 Active 3 DOM
-
2026-06-12remarks 195-char remark
-
2026-06-12$103,000 Active 2 DOM
ⓘ Source: listings_history table (triggers on properties + properties_extension) + one-shot
backfill from property_details.listing_events for pre-trigger history.
Tax reassessment forecast OK · Resets to sale price
- Current annual tax
- $695 · $58/mo
- Projected year-2 tax
- $927 · $77/mo
- Expected delta
- +$232/yr (+$19/mo · 33.4%)
ⓘ Screening estimate from a state-policy table — verify with the county assessor before closing.
Climate risk First Street
- Flood 1/10 Low FEMA zone X (shaded) · 0% chance over 30 yrs
- Wildfire 5/10 Major
- Heat 6/10 Major 7 d/yr ≥108°F today · 18 d/yr by 30 yrs out
- Wind 2/10 Low 100% chance of damaging wind over 30 yrs
- Air quality 2/10 Low 0 unhealthy d/yr today · 1 by 30 yrs out
Nearby sold comps map
Loading sold comps map…
Walkable amenities ~0.75 mi
Loading nearby amenities…
Taxation est. · year 1
- Rental income
- $11,344
- − Mortgage interest
- −$5,770
- − Property taxes
- −$695
- − Insurance
- −$515
- − Repairs & maintenance
- −$908
- − Management
- −$908
- − Depreciation
- −$2,996
- Taxable loss
- −$447
- Est. tax savings @ 24.0%
- +$107
- After-tax cash flow
- $1,377/yr
For passive investors: Depreciation is non-cash, so a rental often shows a tax loss while cash-flowing — sheltering income. Rental losses are passive: they offset passive income freely, and up to $25,000/yr can offset ordinary (W-2) income if you actively participate and your MAGI is under $100k (phasing out to $0 by $150k); unused losses carry forward. On sale, claimed depreciation is recaptured at up to 25%, and gains may owe capital-gains tax (a 1031 exchange can defer both). Figures are a year-1 estimate at your 24.0% rate — not tax advice; consult a CPA.
Schools (NCES district)
- District
- Fairview
- NCES district ID
- 4011280
- Math proficiency
- 34% ▼ -6.00%
- Reading proficiency
- 35% ▼ -8.00%
- Median HH income
- $47,230
- Composite
- 29.67/100
- National rank
- #6464
- State rank
- #40 of 270 in OK
Livability — Fairview
- Score
- 72/100
- State rank
- #22
- US rank
- #5863
Category grades
Schools grade is shown separately in the Schools card above.
Census & demographics
- Census place
- Fairview, OK
- Population (ZIP)
- 3,618
Population outlook (Major County) Hauer SSP2
- Today (2025)
- 8,197 people
- By 2030
- 8,447 · +3.0%
- By 2040
- 9,030 · +10.2%
- By 2050
- 9,753 · +19.0%
- By 2075
- 12,114 · +47.8%
- By 2100
- 13,913 · +69.7%
Race, ethnicity, and origin ACS 2023
- Neighborhood character
- Predominantly White (83%)
- Race & ethnicity
- White 83% Two or more races 11% Hispanic / Latino 9% Native American 2%
- Hispanic origin (detail)
- Mexican 8%
- Common ancestry
- Iranian 4% Romanian 4% Portuguese 2%
- Foreign-born
- 1% · Canada
- Languages at home
- 96% English-only · Spanish 4%
Political lean MEDSL · Major
- 2024 margin
- Solid R (+79.4) · D 9.4% · R 88.8% · Other 1.8%
- 2008→2024 swing
- -9.0pp toward R · 2008: -70.3pp · 2024: -79.4pp
- All cycles
- 2024: R+79.4 2020: R+79.7 2016: R+77.4 2012: R+71.6 2008: R+70.3
Not yet ingested
- Civics
- —
Market trends
- HPI YoY
- ▼ -0.61%
- Current HPI
- 180.6875
- Rent YoY
- —
- Metro
- —
- State GDP YoY
- ▲ 1.55%
- F500 in state
- 6
Industry mix (Fortune 500 HQ in OK)
| Industry | F500 HQs | Revenue |
|---|---|---|
| Energy | 3 | $48B |
|
||
Price history
+77.6% since first listed4 events — show timeline
- 2026-06-10 Listed $103,000 NWOAR
- 2026-03-19 Price Changed $87,500 NWOAR
- 2013-04-26 Sold (Public Records) $65,100 Public Records
- 2011-12-01 Sold (Public Records) $58,000 Public Records
Property tax history
+1.9%/yrLatest (2025): $695 · -4.4% YoY. Source: county tax records.
Cash-flow waterfall
monthlySold comps — $/sqft
last 12 mo · ≤1 miLoading sold comps…