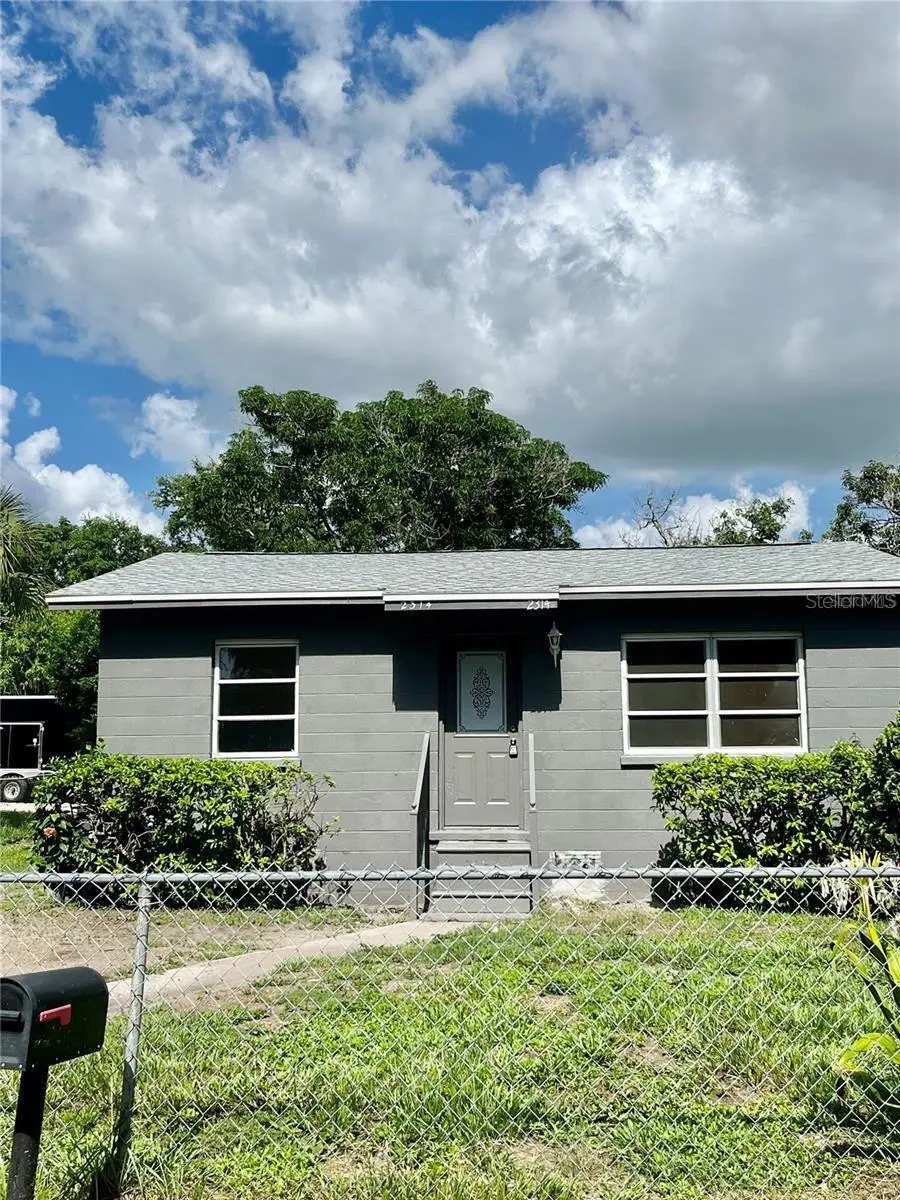
2314 N Osprey Ave · Sarasota, FL
Flood risk 1/10 · Minimal
- FEMA flood zone
- X (unshaded)
- Chance of flooding over 30 yrs
- 0.0%
- Est. flood insurance / yr
- $507 – $1,088
Fire risk 1/10 · Minimal
- Est. fire insurance / yr
- $947 – $1,759
Heat risk 10/10 · Severe
- Hot days now (above 107°F)
- 7 days/yr
- Hot days in 30 yrs
- 30 days/yr
Wind risk 10/10 · Severe
- Chance of severe wind over 30 yrs
- 99.0%
Air-quality risk 2/10 · Minimal
- Unhealthy air days now
- 1 days/yr
- Unhealthy air days in 30 yrs
- 1 days/yr
Risk factors via First Street. Map © Google.
Why this score? — see what drove the D grade
The composite is a weighted blend of 9 inputs, each scored 0–100. Each bar is that input's sub-score; the figure is the points it added to the 100-point composite (weight × sub-score).
- Cash flow +13.4/30.0
- ARV discount +7.5/15.0
- Schools +5.4/10.0
- DSCR +4.1/10.0
- Livability +4.0/5.0
- 1% rule +3.1/10.0
- Condition / age +2.5/5.0
- Rent growth +1.7/5.0
- Appreciation +0.0/10.0
$255,000
🖨 Deal sheet 📄 Offer letter ✓ Due diligence
Listing remarks MLS
Location! Location! The seller is highly motivated and encourages you to bring all offers. This updated 3-bedroom, 1-bath concrete home features several key improvements, including roof, HVAC system, LED lighting, flooring, and fresh paint throughout. The kitchen and bathroom were previously updated. Additionally, the property includes a fully fenced yard. The home is conveniently located near downtown Main Street, the Ringling Museum, and the Sarasota Bradenton Airport.
Key facts
- 7,125 sq ft lot
- Built 1959
- Listed 80 days
Neighborhood map
What this means for you Summary
Snapshot
- This is a 3-bed/1.0-bath single-family listed at $255k.
Deal economics
- At list price, monthly cash flow is $7 ($82/yr) — positive.
- The deal already cash-flows at list — no discount required.
- To meet the 1% rule (rent ≥ 1% of price), the offer needs to be $206k (19.0% below list).
- Recommended offer: $206k (19.0% below list) — sets the bar for 1% rule.
Location & tenants
- Location reads 80/100 on livability (#121 in FL, #1,854 nationally) — a professional / high-income tenant draw. Strengths: amenities A+, health & safety A+, commute A; Watch: crime F.
- Sarasota (urban): math 63% / reading 63% proficiency, ranked #7 of 73 in FL (top 10%) — acceptable for families but not a draw, mixed tenant base, ~2y average lease.
- Market conditions: Rents falling (-3.1%/yr); 268 active listings in the ZIP; 7,466 units permitted in Sarasota County in 2024 (2,138 in 5+ unit buildings).
- This rent runs 43% of the median local income ($57k/yr) — at the standard rent-burdened threshold; future hikes will face affordability resistance.
Forward outlook
- Local home prices are declining (-3.0%/yr); year-one equity from $2k of loan paydown is wiped out by about $8k of value loss. Plan a longer hold.
- Sarasota County population projected at +20% by 2050 — long-run rental-demand tailwind backs the buy-and-hold thesis.
Negotiation context
- It's been on market 80 days — a 6% lower offer ($240k) is reasonable based on typical stale-listing flexibility.
- 9 sale attempts since 6y ago with the ask held roughly flat each time — persistent listings suggest the price (not the market) is what's stuck; bring a comps-based counter.
- Current owner paid $156k; list at $255k implies a 63% gain — meaningful room to come down on a strong offer.
Risks & watch-outs
- Watch-outs: built in 1959 — expect roof / HVAC / electrical / plumbing capex.
- Climate carrying-cost: severe wind risk, 99% chance of damaging wind over 30y; extreme-heat days projected 7→30/yr by 2055 (HVAC capex compounding) — expect insurance premiums to compound above CPI over the hold.
Questions for the listing agent
- It's been on market 80 days. Have you received any prior offers? Is the seller open to a 19% concession, seller financing, or rate buy-down credit?
- Built in 1959 — when were the roof, HVAC, electrical panel, plumbing, and water heater last replaced?
- Why hasn't it sold? Are there any deal-killer items the seller is aware of (foundation, flood, title, zoning, code violations)?
- Is there a deadline driving the sale (1031 exchange, divorce, estate, relocation)? That informs how much negotiation room exists.
- Schools are B-rated — typically a magnet for longer-tenancy family renters. What's the average tenant stay here, and is there a school-zone premium baked into asking?
- Crime grade is F in this area — have there been break-ins, vandalism, or insurance claims at this property in the last 3 years? What carrier currently insures it and at what premium?
- The area grade is low — what's the realistic commute time and amenity access for the typical tenant pool here? Any planned neighborhood developments (good or bad) we should know about?
- What's the average days-on-market for RENTAL listings here right now (not sales)? A rising rental-DOM trend means longer vacancies and softer asking-rent achievability than the comps imply.
- What's the recent tenant-quality profile in this submarket — average credit score on applications, eviction rate, late-payment / NSF rate, and stable-employment percentage? A property-management company in the area should have these aggregated.
- How much new for-sale + rental construction is in the pipeline within 1–3 miles? Heavy new supply typically softens prices + rents 12–24 months out; constrained supply supports both.
Investment metrics
- 1% rule
- 0.81% ✗
- Cap rate
- 6.33%
- Cash-on-cash
- 0.12%
- DSCR
- 1.01
- GRM
- 10.3
CMA / ARV
No comps found within radius.
Projected returns pro-forma
-3.0% appreciation · 0.0% rent growth · sell at horizon
- IRR
- -19.3%
- Equity multiple
- 0.34×
- Total profit
- $-46,988
- Equity at exit
- $38,021
- IRR
- -19.2%
- Equity multiple
- 0.10×
- Total profit
- $-63,957
- Equity at exit
- $22,048
Cash invested: $71,400 (down + closing). Projections, not guarantees.
Landlord ↔ Tenant lean methodology
- Overall (STATE)
- 87 Strongly Landlord-Friendly
- State Florida
- 87 Strongly Landlord-Friendly · R+3
- County
- — inherits STATE
- City
- — inherits STATE
ZIP-level market 34234
- Rents YoY
- -3.1%
- Active inventory
- 268
- Price-to-rent
- 10.3×
Monthly cashflow live
- Estimated rent
- $2,065 medium interval (Pro) →
- Mortgage (P&I)
- −$1,337
- Tax from tax record
- −$181 /mo · $2,171/yr
- Insurance
- −$106
- HOA
- −$0
- Vacancy / Maint / Mgmt
- −$434
- Net cashflow
- $7
Break-even live
UW: 25.0% down · 7.5% · 30yr · 1.5% tax · 5.0% vac · 8.0% maint · 8.0% mgmt
Financing live
Cash to close
- Down payment
- $63,750
- Closing costs
- $7,650
- Reserves months
- —
- Total cash needed
- —
Loan-product check · same deal, 3 products live
Conventional
25% down · 7.5% · 30yr
- Down + closing
- —
- Monthly P&I
- —
- Monthly cashflow
- —
- DSCR
- —
- Eligible?
- —
Personal DTI + credit; lowest rate.
DSCR
20% down · 8.5% · 30yr
- Down + closing
- —
- Monthly P&I
- —
- Monthly cashflow
- —
- DSCR
- —
- Eligible?
- —
No personal income docs; deal must DSCR.
Hard money
10% down · 12.0% · 12mo
- Down + closing
- —
- Monthly P&I
- —
- Monthly cashflow
- —
- DSCR
- —
- Eligible?
- —
Short-term bridge; refi at stabilization.
Listing history 39 events
-
2026-06-18days on market $255,000 Active 80 DOM
-
2026-06-17days on market $255,000 Active 79 DOM
-
2026-06-16days on market $255,000 Active 78 DOM
-
2026-06-15days on market $255,000 Active 77 DOM
-
2026-06-13days on market $255,000 Active 75 DOM
-
2026-06-13days on market $255,000 Active 74 DOM
-
2026-06-10days on market $255,000 Active 72 DOM
-
2026-06-09days on market $255,000 Active 71 DOM
-
2026-06-08days on market $255,000 Active 70 DOM
-
2026-06-08days on market $255,000 Active 69 DOM
-
2026-06-05days on market $255,000 Active 66 DOM
-
2026-06-03days on market $255,000 Active 65 DOM
-
2026-06-02days on market $255,000 Active 64 DOM
-
2026-06-01days on market $255,000 Active 63 DOM
-
2026-05-31days on market $255,000 Active 62 DOM
-
2026-03-30$255,000 Active 475-char remark
Show marketing remark (475 chars)
Location! Location! The seller is highly motivated and encourages you to bring all offers. This updated 3-bedroom, 1-bath concrete home features several key improvements, including roof, HVAC system, LED lighting, flooring, and fresh paint throughout. The kitchen and bathroom were previously updated. Additionally, the property includes a fully fenced yard. The home is conveniently located near downtown Main Street, the Ringling Museum, and the Sarasota Bradenton Airport.
-
2024-10-28historical
-
2024-09-07price $235,000
-
2024-09-01price $239,499
-
2024-07-16$239,999 Active
-
2024-06-20soldstatus $156,000
-
2024-06-18soldstatus $156,000 Closed
-
2024-05-12status Pending
-
2024-05-01status Active
-
2024-05-01price $210,000
-
2024-04-30historical
-
2024-04-20status Active
-
2024-04-03status Pending
-
2024-02-06price $225,000
-
2023-12-26status Active
-
2023-12-22status Pending
-
2023-12-15status Active
-
2023-11-30status Pending
-
2023-10-30$236,000 Active
-
2021-05-04$189,900 Active
-
2020-09-11soldstatus $90,000
-
2020-09-08soldstatus $90,000 Sold
-
2020-06-29status Pending
-
2020-06-22$89,900 Active
ⓘ Source: listings_history table (triggers on properties + properties_extension) + one-shot
backfill from property_details.listing_events for pre-trigger history.
Tax reassessment forecast FL · Resets to sale price
- Current annual tax
- $2,171 · $181/mo
- Projected year-2 tax
- $2,171 · $181/mo
- Expected delta
- $0/yr ($0/mo · 0.0%)
ⓘ Screening estimate from a state-policy table — verify with the county assessor before closing.
Climate risk First Street
- Flood 1/10 Low FEMA zone X (unshaded) · 0% chance over 30 yrs
- Wildfire 1/10 Low
- Heat 10/10 Extreme 7 d/yr ≥107°F today · 30 d/yr by 30 yrs out
- Wind 10/10 Extreme 99% chance of damaging wind over 30 yrs
- Air quality 2/10 Low 1 unhealthy d/yr today · 1 by 30 yrs out
Nearby sold comps map
Loading sold comps map…
Walkable amenities ~0.75 mi
Loading nearby amenities…
Taxation est. · year 1
- Rental income
- $24,779
- − Mortgage interest
- −$14,284
- − Property taxes
- −$2,171
- − Insurance
- −$1,275
- − Repairs & maintenance
- −$1,982
- − Management
- −$1,982
- − Depreciation
- −$7,418
- Taxable loss
- −$4,334
- Est. tax savings @ 24.0%
- +$1,040
- After-tax cash flow
- $1,123/yr
For passive investors: Depreciation is non-cash, so a rental often shows a tax loss while cash-flowing — sheltering income. Rental losses are passive: they offset passive income freely, and up to $25,000/yr can offset ordinary (W-2) income if you actively participate and your MAGI is under $100k (phasing out to $0 by $150k); unused losses carry forward. On sale, claimed depreciation is recaptured at up to 25%, and gains may owe capital-gains tax (a 1031 exchange can defer both). Figures are a year-1 estimate at your 24.0% rate — not tax advice; consult a CPA.
Schools (NCES district)
- District
- Sarasota
- NCES district ID
- 1201680
- Math proficiency
- 63% ▼ -8.00%
- Reading proficiency
- 63% ▼ -3.00%
- Median HH income
- $51,167
- Composite
- 53.68/100
- National rank
- #1428
- State rank
- #7 of 73 in FL
Livability — Sarasota
- Score
- 80/100
- State rank
- #121
- US rank
- #1854
Category grades
Schools grade is shown separately in the Schools card above.
Census & demographics
- Census place
- Sarasota, FL
- County
- Sarasota County · 448,376 people
- Metro
- North Port-Sarasota-Bradenton, FL
- Population (ZIP)
- 22,986
- Household income
- $57,288
- Rent vs Own
- Severe rent burden
- 1306.0
Population outlook (Sarasota County) Hauer SSP2
- Today (2025)
- 452,380 people
- By 2030
- 474,175 · +4.8%
- By 2040
- 511,577 · +13.1%
- By 2050
- 541,467 · +19.7%
- By 2075
- 604,947 · +33.7%
- By 2100
- 621,965 · +37.5%
Race, ethnicity, and origin ACS 2023
- Neighborhood character
- Diverse neighborhood (Simpson 0.68)
- Race & ethnicity
- White 44% Black 31% Hispanic / Latino 20% Two or more races 14% Asian 1%
- Hispanic origin (detail)
- Mexican 8% Puerto Rican 1% Cuban 6% Dominican 1%
- Common ancestry
- Lithuanian 4% Hispanic 2% Romanian 1%
- Foreign-born
- 17% · Canada, Jamaica, China
- Languages at home
- 81% English-only · Spanish 17% French/Haitian/Cajun 1%
Political lean MEDSL · Sarasota
- 2024 margin
- R (+18.2) · D 40.5% · R 58.7%
- 2008→2024 swing
- -18.1pp toward R · 2008: -0.1pp · 2024: -18.2pp
- All cycles
- 2024: R+18.2 2020: R+10.4 2016: R+11.6 2012: R+7.4 2008: R+0.1
Not yet ingested
- Civics
- —
Market trends
- HPI YoY
- ▼ -229.06%
- Current HPI
- 305.6629
- Rent YoY
- ▼ -3.15%
- Metro
- North Port-Sarasota-Bradenton, FL
- State GDP YoY
- ▲ 3.28%
- F500 in state
- 36
Industry mix (Fortune 500 HQ in FL)
| Industry | F500 HQs | Revenue |
|---|---|---|
| Industrial Technology | 2 | $29B |
|
||
| Insurance | 2 | $17B |
|
||
| Retail | 1 | $60B |
|
||
| Technology Distribution | 1 | $58B |
|
||
| Homebuilding | 1 | $35B |
|
||
| Technology Manufacturing | 1 | $35B |
|
||
Price history
+183.6% since first listed24 events — show timeline
- 2026-03-30 Listed $255,000 Stellar MLS as Distributed by MLS Grid
- 2024-10-28 Listing Removed — Stellar MLS as Distributed by MLS Grid
- 2024-09-07 Price Changed $235,000 Stellar MLS as Distributed by MLS Grid
- 2024-09-01 Price Changed $239,499 Stellar MLS as Distributed by MLS Grid
- 2024-07-16 Listed $239,999 Stellar MLS as Distributed by MLS Grid
- 2024-06-20 Sold (Public Records) $156,000 Public Records
- 2024-06-18 Sold (MLS) $156,000 Stellar MLS as Distributed by MLS Grid
- 2024-05-12 Pending — Stellar MLS as Distributed by MLS Grid
- 2024-05-01 Relisted — Stellar MLS as Distributed by MLS Grid
- 2024-05-01 Price Changed $210,000 Stellar MLS as Distributed by MLS Grid
- 2024-04-30 Listing Removed — Stellar MLS as Distributed by MLS Grid
- 2024-04-20 Relisted — Stellar MLS as Distributed by MLS Grid
- 2024-04-03 Pending — Stellar MLS as Distributed by MLS Grid
- 2024-02-06 Price Changed $225,000 Stellar MLS as Distributed by MLS Grid
- 2023-12-26 Relisted — Stellar MLS as Distributed by MLS Grid
- 2023-12-22 Pending — Stellar MLS as Distributed by MLS Grid
- 2023-12-15 Relisted — Stellar MLS as Distributed by MLS Grid
- 2023-11-30 Pending — Stellar MLS as Distributed by MLS Grid
- 2023-10-30 Listed $236,000 Stellar MLS as Distributed by MLS Grid
- 2021-05-04 Listed $189,900 Stellar MLS as Distributed by MLS Grid
- 2020-09-11 Sold (Public Records) $90,000 Public Records
- 2020-09-08 Sold (MLS) $90,000 Stellar MLS as Distributed by MLS Grid
- 2020-06-29 Pending — Stellar MLS as Distributed by MLS Grid
- 2020-06-22 Listed $89,900 Stellar MLS as Distributed by MLS Grid
Property tax history
+22.9%/yrLatest (2025): $2,171 · +22.2% YoY. Source: county tax records.
Cash-flow waterfall
monthlySold comps — $/sqft
last 12 mo · ≤1 miLoading sold comps…