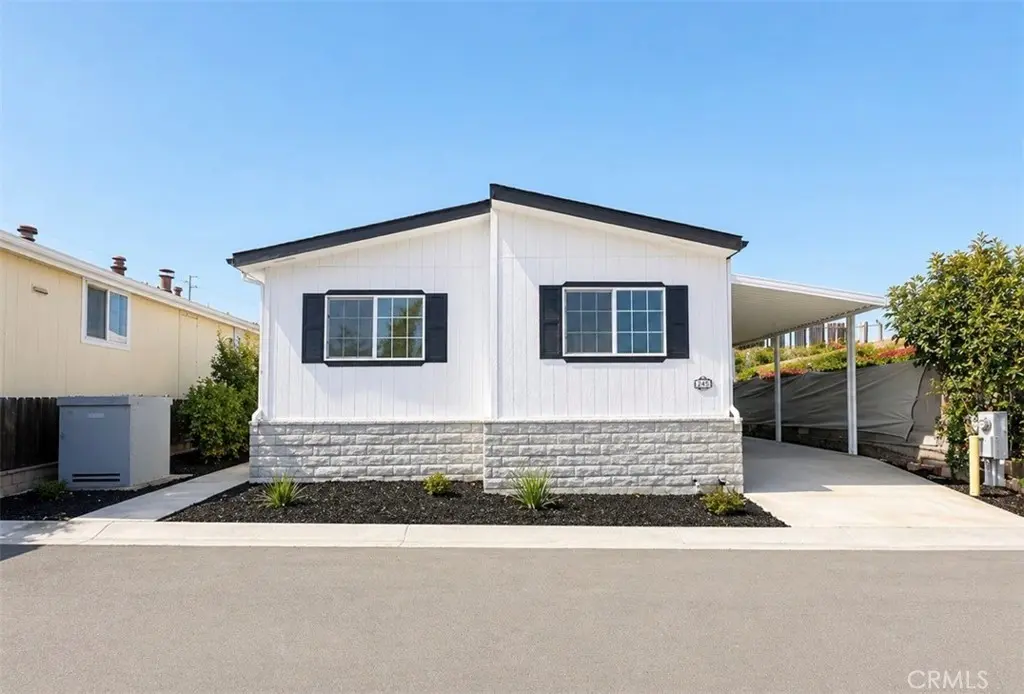
1638 Calavo Rd #63 · Fallbrook, CA
Flood risk 1/10 · Minimal
- FEMA flood zone
- X (unshaded)
- Chance of flooding over 30 yrs
- 0.0%
- Est. flood insurance / yr
- $507 – $1,088
Fire risk 6/10 · Moderate
- Est. fire insurance / yr
- $659 – $1,223
Heat risk 6/10 · Moderate
- Hot days now (above 94°F)
- 7 days/yr
- Hot days in 30 yrs
- 22 days/yr
Wind risk 1/10 · Minimal
- Chance of severe wind over 30 yrs
- —
Air-quality risk 4/10 · Minor
- Unhealthy air days now
- 5 days/yr
- Unhealthy air days in 30 yrs
- 6 days/yr
Risk factors via First Street. Map © Google.
Why this score? — see what drove the C+ grade
The composite is a weighted blend of 9 inputs, each scored 0–100. Each bar is that input's sub-score; the figure is the points it added to the 100-point composite (weight × sub-score).
- Cash flow +25.8/30.0
- ARV discount +10.8/15.0
- DSCR +8.6/10.0
- 1% rule +5.5/10.0
- Schools +3.9/10.0
- Condition / age +2.5/5.0
- Rent growth +2.4/5.0
- Livability +2.1/5.0
- Appreciation +0.0/10.0
$318,900
🖨 Deal sheet 📄 Offer letter ✓ Due diligence
Listing remarks MLS
Fixer upper home in Sunshine View Estates home needs flooring, home needs home needs TLC come with a vision for you to make it your own!
Key facts
- Community pool
- Built 1998
- Listed 49 days
Property features AI
Finance
- Other: Living area source: seller; Lot characterized as 0-1 unit per acre; Elevation units listed in feet; Parcel number on file
- HOA & community: Land lease of $860 (land lease community / park: Sunshine Park Estates)
Exterior
- Parking: Carport
- Utilities: Public sewer; District/public water
- Home design: Mobile home (double-wide); Mobile home remains on property; Single-story; Entry on level 1
- Construction: Mobile width 23 ft; Mobile length 56 ft; Year built source: public records
- Exterior features: Community pool; Located in a rural community
Interior
- Kitchen: Microwave; Gas range; Dishwasher; Quartz countertops
- Bedrooms: All bedrooms located on the main level
- Flooring: Vinyl flooring
- Bathrooms: 2 full bathrooms
- Heating & cooling: Central cooling; Central furnace; Fireplace
- Interior features: Ceiling fan; Front door entry; Single-level home (one story); All bedrooms on ground level
- Laundry & utility: Indoor laundry in a dedicated room
Neighborhood map
What this means for you Summary
Snapshot
- This is a 3-bed/2.0-bath manufactured listed at $319k.
Deal economics
- At list price, monthly cash flow is $769 ($9k/yr) — positive.
- The deal already cash-flows at list — no discount required.
- Meets the 1% rule at list price ($3k rent vs $319k).
- Recommended offer: $309k (3.0% below list) — sets the bar for market timing.
- Cap rate 9.2% vs local median 2.4% in Fallbrook — top-decile yield for the area; either an underpriced asset or a hidden risk that comps aren't pricing in. Stress-test before assuming the spread holds.
Location & tenants
- Location reads 42/100 on livability (#1,364 in CA) — a working-class tenant base; expect higher turnover. Watch: schools D+, crime D-, amenities F.
- Fallbrook Union High (suburban): math 32% / reading 58% proficiency, ranked #183 of 517 in CA (top 35%) — families likely to look elsewhere, expect single-tenant / working-renter base with shorter leases.
- Market conditions: Rents soft (-0.3%/yr); 345 active listings in the ZIP; 1 comparable units currently listed for rent nearby; high-income renter base; 11,759 units permitted in San Diego County in 2024 (7,244 in 5+ unit buildings).
- This rent runs 36% of the median local income ($111k/yr) — at the standard rent-burdened threshold; future hikes will face affordability resistance.
Forward outlook
- Local home prices are declining (-3.0%/yr); year-one equity from $2k of loan paydown is wiped out by about $10k of value loss. Plan a longer hold.
- San Diego County population projected at +20% by 2050 — long-run rental-demand tailwind backs the buy-and-hold thesis.
Negotiation context
- It's been on market 49 days — a 3% lower offer ($309k) is reasonable based on typical stale-listing flexibility.
- 4 sale attempts since 16y ago with the ask held roughly flat each time — persistent listings suggest the price (not the market) is what's stuck; bring a comps-based counter.
- Current owner paid $180k; list at $319k implies a 77% gain — meaningful room to come down on a strong offer.
Risks & watch-outs
- Climate carrying-cost: major wildfire risk; extreme-heat days projected 7→22/yr by 2055 (HVAC capex compounding) — expect insurance premiums to compound above CPI over the hold.
Questions for the listing agent
- It's been on market 49 days. Have you received any prior offers? Is the seller open to a 3% concession, seller financing, or rate buy-down credit?
- Is there a deadline driving the sale (1031 exchange, divorce, estate, relocation)? That informs how much negotiation room exists.
- Schools are D-rated, which usually means shorter tenancies and higher turnover. Who's the typical renter profile here, and what's been the actual vacancy rate?
- Crime grade is D in this area — have there been break-ins, vandalism, or insurance claims at this property in the last 3 years? What carrier currently insures it and at what premium?
- What's the average days-on-market for RENTAL listings here right now (not sales)? A rising rental-DOM trend means longer vacancies and softer asking-rent achievability than the comps imply.
- What's the recent tenant-quality profile in this submarket — average credit score on applications, eviction rate, late-payment / NSF rate, and stable-employment percentage? A property-management company in the area should have these aggregated.
- How much new for-sale + rental construction is in the pipeline within 1–3 miles? Heavy new supply typically softens prices + rents 12–24 months out; constrained supply supports both.
Investment metrics
- 1% rule
- 1.05% ✓
- Cap rate
- 9.19%
- Cash-on-cash
- 10.34%
- DSCR
- 1.46
- GRM
- 7.9
CMA / ARV
- ARV (on-the-fly)
- $344,112
- Comps found
- 1
Show comp detail 1 sale within ~0.75 mi
| Address | Dist | Beds/Ba | Sqft | Sold | Price | $/sf | Match |
|---|---|---|---|---|---|---|---|
| 1638 Calavo Rd #74 | 0.00mi | 3/2.0 | 1,231 (-4%) | 17mo | $329,900 | $268 | 79 |
Match score weights: distance 35% · size 25% · config 20% · recency 20%. Top-matched comps best support the ARV.
Projected returns pro-forma
-3.0% appreciation · 0.0% rent growth · sell at horizon
- IRR
- -3.9%
- Equity multiple
- 0.86×
- Total profit
- $-12,646
- Equity at exit
- $47,549
- IRR
- 2.4%
- Equity multiple
- 1.15×
- Total profit
- $13,536
- Equity at exit
- $27,573
Cash invested: $89,292 (down + closing). Projections, not guarantees.
Landlord ↔ Tenant lean methodology
- Overall (STATE)
- 18 Strongly Tenant-Friendly
- State California
- 18 Strongly Tenant-Friendly · D+13
- County
- — inherits STATE
- City
- — inherits STATE
ZIP-level market 92028
- Rents YoY
- -0.3%
- Active inventory
- 345
- Price-to-rent
- 7.9×
Monthly cashflow live
- Estimated rent
- $3,349 medium interval (Pro) →
- Mortgage (P&I)
- −$1,672
- Tax from tax record
- −$71 /mo · $853/yr
- Insurance
- −$133
- HOA
- −$0
- Vacancy / Maint / Mgmt
- −$703
- Net cashflow
- $769
Break-even live
UW: 25.0% down · 7.5% · 30yr · 1.5% tax · 5.0% vac · 8.0% maint · 8.0% mgmt
Financing live
Cash to close
- Down payment
- $79,725
- Closing costs
- $9,567
- Reserves months
- —
- Total cash needed
- —
Loan-product check · same deal, 3 products live
Conventional
25% down · 7.5% · 30yr
- Down + closing
- —
- Monthly P&I
- —
- Monthly cashflow
- —
- DSCR
- —
- Eligible?
- —
Personal DTI + credit; lowest rate.
DSCR
20% down · 8.5% · 30yr
- Down + closing
- —
- Monthly P&I
- —
- Monthly cashflow
- —
- DSCR
- —
- Eligible?
- —
No personal income docs; deal must DSCR.
Hard money
10% down · 12.0% · 12mo
- Down + closing
- —
- Monthly P&I
- —
- Monthly cashflow
- —
- DSCR
- —
- Eligible?
- —
Short-term bridge; refi at stabilization.
Rent comps 1 comps
| Address | Beds | Baths | Sqft | Rent | $/sqft | DOM | Units | Dist |
|---|---|---|---|---|---|---|---|---|
| 1732 Woodbrook Ln Fallbrook, CA | 2.0 | 2.0 | 1367 | $2,950 | $2.16 | 1d | 1 | 0.96mi |
Listing history 23 events
-
2026-06-18days on market $318,900 Active 49 DOM
-
2026-06-17days on market $318,900 Active 48 DOM
-
2026-06-16days on market $318,900 Active 47 DOM
-
2026-06-15days on market $318,900 Active 46 DOM
-
2026-06-13days on market $318,900 Active 44 DOM
-
2026-06-13days on market $318,900 Active 43 DOM
-
2026-06-09days on market $318,900 Active 40 DOM
-
2026-06-08days on market $318,900 Active 39 DOM
-
2026-06-07days on market $318,900 Active 38 DOM
-
2026-06-04days on market $318,900 Active 35 DOM
-
2026-06-03days on market $318,900 Active 34 DOM
-
2026-06-02days on market $318,900 Active 33 DOM
-
2026-06-01days on market $318,900 Active 32 DOM
-
2026-05-31days on market $318,900 Active 31 DOM
-
2026-04-30$318,900 Active
-
2026-03-12soldstatus $180,000 Closed Sale 136-char remark
Show marketing remark (136 chars)
Fixer upper home in Sunshine View Estates home needs flooring, home needs home needs TLC come with a vision for you to make it your own!
-
2026-02-26status Pending Sale 136-char remark
Show marketing remark (136 chars)
Fixer upper home in Sunshine View Estates home needs flooring, home needs home needs TLC come with a vision for you to make it your own!
-
2026-02-19price $235,000 136-char remark
Show marketing remark (136 chars)
Fixer upper home in Sunshine View Estates home needs flooring, home needs home needs TLC come with a vision for you to make it your own!
-
2026-01-27$265,000 Active 136-char remark
Show marketing remark (136 chars)
Fixer upper home in Sunshine View Estates home needs flooring, home needs home needs TLC come with a vision for you to make it your own!
-
2010-09-24historical
-
2010-09-23historical
-
2010-03-24$72,000 Active
-
2010-03-23$72,000
ⓘ Source: listings_history table (triggers on properties + properties_extension) + one-shot
backfill from property_details.listing_events for pre-trigger history.
Tax reassessment forecast CA · Resets to sale price
- Current annual tax
- $853 · $71/mo
- Projected year-2 tax
- $2,424 · $202/mo
- Expected delta
- +$1,571/yr (+$131/mo · 184.1%)
ⓘ Screening estimate from a state-policy table — verify with the county assessor before closing.
Climate risk First Street
- Flood 1/10 Low FEMA zone X (unshaded) · 0% chance over 30 yrs
- Wildfire 6/10 Major
- Heat 6/10 Major 7 d/yr ≥94°F today · 22 d/yr by 30 yrs out
- Wind 1/10 Low
- Air quality 4/10 Moderate 5 unhealthy d/yr today · 6 by 30 yrs out
Nearby sold comps map
Loading sold comps map…
Walkable amenities ~0.75 mi
Loading nearby amenities…
Taxation est. · year 1
- Rental income
- $40,186
- − Mortgage interest
- −$17,863
- − Property taxes
- −$853
- − Insurance
- −$1,594
- − Repairs & maintenance
- −$3,215
- − Management
- −$3,215
- − Depreciation
- −$9,277
- Taxable income
- $4,168
- Est. tax owed @ 24.0%
- −$1,000
- After-tax cash flow
- $8,231/yr
For passive investors: Depreciation is non-cash, so a rental often shows a tax loss while cash-flowing — sheltering income. Rental losses are passive: they offset passive income freely, and up to $25,000/yr can offset ordinary (W-2) income if you actively participate and your MAGI is under $100k (phasing out to $0 by $150k); unused losses carry forward. On sale, claimed depreciation is recaptured at up to 25%, and gains may owe capital-gains tax (a 1031 exchange can defer both). Figures are a year-1 estimate at your 24.0% rate — not tax advice; consult a CPA.
Schools (NCES district)
- District
- Fallbrook Union High
- NCES district ID
- 0613530
- Math proficiency
- 32% ▲ 11.00%
- Reading proficiency
- 58% ▲ 9.00%
- Median HH income
- $56,644
- Composite
- 39.17/100
- National rank
- #4025
- State rank
- #183 of 517 in CA
Livability — Fallbrook
- Score
- 42/100
- State rank
- #1364
- US rank
- #27057
Category grades
Schools grade is shown separately in the Schools card above.
Census & demographics
- Census place
- Fallbrook, CA
- County
- San Diego County · 3,178,799 people
- City population
- 52,227
- Metro
- San Diego-Chula Vista-Carlsbad, CA
- Population (ZIP)
- 52,227
- Household income
- $111,290
- Rent vs Own
- Severe rent burden
- 1384.0
Population outlook (San Diego County) Hauer SSP2
- Today (2025)
- 3,678,185 people
- By 2030
- 3,856,546 · +4.8%
- By 2040
- 4,171,407 · +13.4%
- By 2050
- 4,421,607 · +20.2%
- By 2075
- 4,831,599 · +31.4%
- By 2100
- 4,832,502 · +31.4%
Race, ethnicity, and origin ACS 2023
- Neighborhood character
- Diverse neighborhood (Simpson 0.59)
- Race & ethnicity
- White 48% Hispanic / Latino 42% Two or more races 21% Asian 4% Black 2% Native American 1%
- Hispanic origin (detail)
- Mexican 35%
- Common ancestry
- Slovak 2% Italian 2% Romanian 2%
- Foreign-born
- 21% · Canada, Vietnam, China
- Languages at home
- 66% English-only · Spanish 29% Tagalog/Filipino 1% Other Asian/Pacific 1%
Political lean MEDSL · San Diego
- 2024 margin
- D (+16.8) · D 56.9% · R 40.1% · Other 2.9%
- 2008→2024 swing
- +6.6pp toward D · 2008: 10.2pp · 2024: 16.8pp
- All cycles
- 2024: D+16.8 2020: D+22.8 2016: D+17.8 2012: D+5.1 2008: D+10.2
Not yet ingested
- Civics
- —
Market trends
- HPI YoY
- ▼ -533.50%
- Current HPI
- 320.7162
- Rent YoY
- ▼ -0.35%
- Metro
- San Diego-Chula Vista-Carlsbad, CA
- State GDP YoY
- ▲ 3.21%
- F500 in state
- 116
Industry mix (Fortune 500 HQ in CA)
| Industry | F500 HQs | Revenue |
|---|---|---|
| Technology | 27 | $1,492B |
|
||
| Financial Services | 3 | $174B |
|
||
| Retail | 3 | $44B |
|
||
| Insurance | 3 | $26B |
|
||
| Media / Entertainment | 2 | $115B |
|
||
| Pharmaceuticals / Biotech | 2 | $62B |
|
||
Price history
+342.9% since first listed9 events — show timeline
- 2026-04-30 Listed $318,900 CRMLS
- 2026-03-12 Sold (MLS) $180,000 CRMLS
- 2026-02-26 Pending — CRMLS
- 2026-02-19 Price Changed $235,000 CRMLS
- 2026-01-27 Listed $265,000 CRMLS
- 2010-09-24 Listing Removed — SDMLS
- 2010-09-23 Listing Removed — CRMLS
- 2010-03-24 Listed $72,000 SDMLS
- 2010-03-23 Listed $72,000 CRMLS
Property tax history
+1.7%/yrLatest (2013): $853 · +1.0% YoY. Source: county tax records.
Cash-flow waterfall
monthlySold comps — $/sqft
last 12 mo · ≤1 miLoading sold comps…