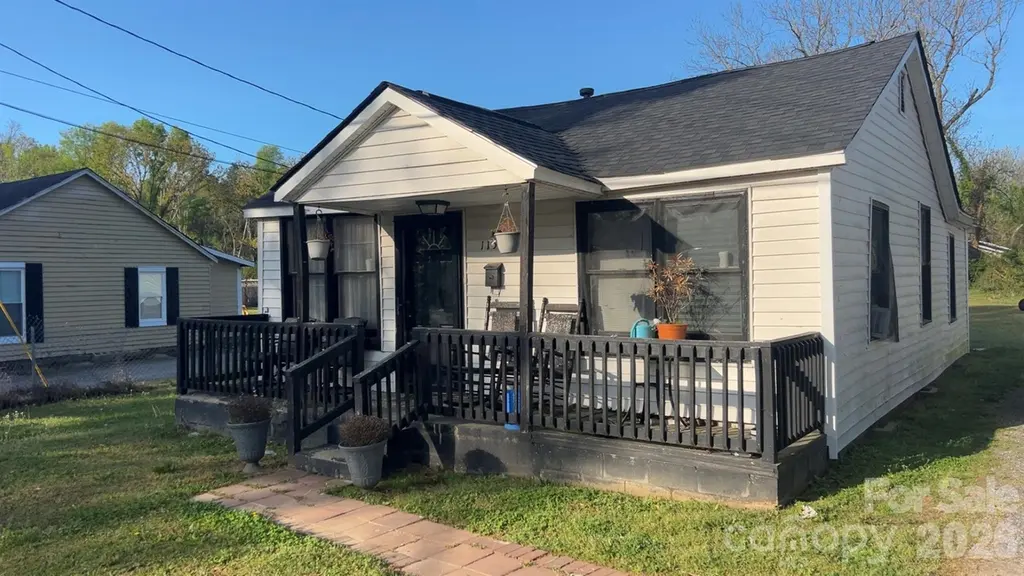
1152 Carolina Avenue Ext · Rock Hill, SC
Flood risk 1/10 · Minimal
- FEMA flood zone
- X (unshaded)
- Chance of flooding over 30 yrs
- 0.0%
- Est. flood insurance / yr
- $507 – $1,088
Fire risk 3/10 · Minor
- Est. fire insurance / yr
- $783 – $1,453
Heat risk 6/10 · Moderate
- Hot days now (above 105°F)
- 7 days/yr
- Hot days in 30 yrs
- 16 days/yr
Wind risk 6/10 · Moderate
- Chance of severe wind over 30 yrs
- 27.0%
Air-quality risk 3/10 · Minor
- Unhealthy air days now
- 2 days/yr
- Unhealthy air days in 30 yrs
- 3 days/yr
Risk factors via First Street. Map © Google.
Why this score? — see what drove the B+ grade
The composite is a weighted blend of 9 inputs, each scored 0–100. Each bar is that input's sub-score; the figure is the points it added to the 100-point composite (weight × sub-score).
- Cash flow +30.0/30.0
- ARV discount +15.0/15.0
- DSCR +10.0/10.0
- 1% rule +9.2/10.0
- Rent growth +3.9/5.0
- Schools +3.5/10.0
- Livability +3.5/5.0
- Condition / age +2.5/5.0
- Appreciation +0.0/10.0
$115,000
🖨 Deal sheet 📄 Offer letter ✓ Due diligence
Listing remarks
Investor Special BACK ON THE MARKET! 3/1 Can Easily Be Converted To A 4/2 Home On . 25acre Lot!
Key facts
- 0.25 acre lot
- Built 1930
- Listed 35 days
Property features AI
Finance
- HOA & community: No HOA
Exterior
- Parking: Driveway
- Utilities: City water; Public sewer
- Home design: Single-family residence (site built); One story; SF-5 zoning
- Construction: Vinyl exterior; Crawl space foundation; Site built construction
- Exterior features: Gravel and paved road access; Publicly maintained road
Interior
- Kitchen: No appliances listed for kitchen
- Bedrooms: 3 bedrooms on the main level
- Bathrooms: 1 full bathroom on the main level
- Heating & cooling: Natural gas heating; Window air conditioning units
- Interior features: 6 total rooms; No built-in appliances listed
- Laundry & utility: Washer hookup; Electric dryer hookup
Neighborhood map
What this means for you Summary
Snapshot
- This is a 3-bed/1.0-bath single-family listed at $115k.
Deal economics
- At list price, monthly cash flow is $499 ($6k/yr) — positive.
- The deal already cash-flows at list — no discount required.
- Meets the 1% rule at list price ($2k rent vs $115k).
- Recommended offer: $112k (3.0% below list) — sets the bar for market timing.
- Cap rate 11.5% vs local median 3.4% in Rock Hill — top-decile yield for the area; either an underpriced asset or a hidden risk that comps aren't pricing in. Stress-test before assuming the spread holds.
Location & tenants
- Location reads 70/100 on livability (#62 in SC) — a middle-class / working-renter tenant base. Strengths: cost of living A+, housing A+, health & safety A+; Watch: schools D+, employment D+, crime D-.
- York 03 (urban): math 36% / reading 47% proficiency, ranked #32 of 80 in SC (top 40%) — families likely to look elsewhere, expect single-tenant / working-renter base with shorter leases.
- Market conditions: Rents rising fast (+5.5%/yr); 348 active listings in the ZIP; 15 comparable units currently listed for rent nearby; rentals leasing fast (median 5d on market — plan ~1-2 weeks tenant-placement turnaround); 2,550 units permitted in York County in 2024 (350 in 5+ unit buildings).
Forward outlook
- Local home prices are declining (-3.0%/yr); year-one equity from $795 of loan paydown is wiped out by about $3k of value loss. Plan a longer hold.
- York County population projected at +44% by 2050 — long-run rental-demand tailwind backs the buy-and-hold thesis.
- At projected returns (-3.0% appreciation + 5.5% rent growth), your $32k cash investment doubles in ~6 years — after that, you're playing with house money.
Negotiation context
- It's been on market 35 days — a 3% lower offer ($112k) is reasonable based on typical stale-listing flexibility.
- 2 sale attempts with the ask held roughly flat each time — persistent listings suggest the price (not the market) is what's stuck; bring a comps-based counter.
Risks & watch-outs
- Watch-outs: built in 1930 — expect roof / HVAC / electrical / plumbing capex.
- Climate carrying-cost: major wind risk, 27% chance of damaging wind over 30y; extreme-heat days projected 7→16/yr by 2055 (HVAC capex compounding) — expect insurance premiums to compound above CPI over the hold.
Questions for the listing agent
- It's been on market 35 days. Have you received any prior offers? Is the seller open to a 3% concession, seller financing, or rate buy-down credit?
- Built in 1930 — when were the roof, HVAC, electrical panel, plumbing, and water heater last replaced?
- Is there a deadline driving the sale (1031 exchange, divorce, estate, relocation)? That informs how much negotiation room exists.
- Schools are D-rated, which usually means shorter tenancies and higher turnover. Who's the typical renter profile here, and what's been the actual vacancy rate?
- Crime grade is D in this area — have there been break-ins, vandalism, or insurance claims at this property in the last 3 years? What carrier currently insures it and at what premium?
- What's the average days-on-market for RENTAL listings here right now (not sales)? A rising rental-DOM trend means longer vacancies and softer asking-rent achievability than the comps imply.
- What's the recent tenant-quality profile in this submarket — average credit score on applications, eviction rate, late-payment / NSF rate, and stable-employment percentage? A property-management company in the area should have these aggregated.
- How much new for-sale + rental construction is in the pipeline within 1–3 miles? Heavy new supply typically softens prices + rents 12–24 months out; constrained supply supports both.
Investment metrics
- 1% rule
- 1.42% ✓
- Cap rate
- 11.50%
- Cash-on-cash
- 18.59%
- DSCR
- 1.83
- GRM
- 5.9
CMA / ARV
- ARV (on-the-fly)
- $209,160
- Comps found
- 12
Show comp detail 12 sales within ~0.75 mi
| Address | Dist | Beds/Ba | Sqft | Sold | Price | $/sf | Match |
|---|---|---|---|---|---|---|---|
| 1035 S Stonewall Ave | 0.39mi | 3/1.0 | 1,050 (+5%) | 0mo | $100,010 | $95 | 72 |
| 974 Pebble Rd | 0.56mi | 3/1.0 | 1,047 (+5%) | 3mo | $200,000 | $191 | 63 |
| 227 Brice St | 0.70mi | 3/1.0 | 969 (-3%) | 1mo | $247,900 | $256 | 62 |
| 1343 Flint Hill St | 0.42mi | 2/1.0 (-1) | 1,076 (+8%) | 3mo | $115,000 | $107 | 60 |
| 919 Jefferson Ave | 0.36mi | 3/1.5 | 1,120 (+12%) | 4mo | $140,000 | $125 | 57 |
| 724 Jefferson Ave | 0.64mi | 2/1.0 (-1) | 942 (-5%) | 0mo | $200,000 | $212 | 56 |
| 406 Rich St | 0.34mi | 2/2.0 (-1) | 1,100 (+10%) | 4mo | $200,000 | $182 | 54 |
| 626 S Spruce St | 0.71mi | 3/1.0 | 892 (-10%) | 1mo | $217,000 | $243 | 49 |
| 552 Locust St | 0.57mi | 4/1.5 (+1) | 1,100 (+10%) | 1mo | $237,000 | $215 | 48 |
| 835 Rockdale St | 0.45mi | 3/2.0 | 1,142 (+15%) | 3mo | $240,000 | $210 | 48 |
| 758 Rockwood Dr | 0.74mi | 3/1.0 | 1,138 (+14%) | 0mo | $170,000 | $149 | 41 |
| 459 Green St | 0.74mi | 2/1.0 (-1) | 887 (-11%) | 1mo | $195,000 | $220 | 41 |
Match score weights: distance 35% · size 25% · config 20% · recency 20%. Top-matched comps best support the ARV.
Projected returns pro-forma
-3.0% appreciation · 5.53% rent growth · sell at horizon
- IRR
- 13.2%
- Equity multiple
- 1.54×
- Total profit
- $17,436
- Equity at exit
- $17,147
- IRR
- 23.9%
- Equity multiple
- 3.32×
- Total profit
- $74,665
- Equity at exit
- $9,943
Cash invested: $32,200 (down + closing). Projections, not guarantees.
Landlord ↔ Tenant lean methodology
- Overall (STATE)
- 90 Strongly Landlord-Friendly
- State South Carolina
- 90 Strongly Landlord-Friendly · R+6
- County
- — inherits STATE
- City
- — inherits STATE
ZIP-level market 29730
- Rents YoY
- 5.5%
- Active inventory
- 348
- Price-to-rent
- 5.9×
Monthly cashflow live
- Estimated rent
- $1,637 high interval (Pro) →
- Mortgage (P&I)
- −$603
- Tax est. 1.5%
- −$144 /mo · $1,725/yr
- Insurance
- −$48
- HOA
- −$0
- Vacancy / Maint / Mgmt
- −$344
- Net cashflow
- $499
Break-even live
UW: 25.0% down · 7.5% · 30yr · 1.5% tax · 5.0% vac · 8.0% maint · 8.0% mgmt
Financing live
Cash to close
- Down payment
- $28,750
- Closing costs
- $3,450
- Reserves months
- —
- Total cash needed
- —
Loan-product check · same deal, 3 products live
Conventional
25% down · 7.5% · 30yr
- Down + closing
- —
- Monthly P&I
- —
- Monthly cashflow
- —
- DSCR
- —
- Eligible?
- —
Personal DTI + credit; lowest rate.
DSCR
20% down · 8.5% · 30yr
- Down + closing
- —
- Monthly P&I
- —
- Monthly cashflow
- —
- DSCR
- —
- Eligible?
- —
No personal income docs; deal must DSCR.
Hard money
10% down · 12.0% · 12mo
- Down + closing
- —
- Monthly P&I
- —
- Monthly cashflow
- —
- DSCR
- —
- Eligible?
- —
Short-term bridge; refi at stabilization.
Rent comps 15 comps
| Address | Beds | Baths | Sqft | Rent | $/sqft | DOM | Units | Dist |
|---|---|---|---|---|---|---|---|---|
| 1547 Caprine CT Rock Hill, SC | 1.0–3.0 | 1.0–2.0 | 959 | $1,708 | $1.78 | 1d | 15 | 0.40mi |
| 316 Little St Rock Hill, SC | 2.0 | 1.0 | 725 | $1,150 | $1.59 | 21d | 1 | 0.47mi |
| 987 Pebble Rd Rock Hill, SC | 3.0 | 1.0 | 1044 | $1,295 | $1.24 | 23d | 1 | 0.56mi |
| 658 Arch Dr Rock Hill, SC | 3.0 | 1.0 | 985 | $1,700 | $1.73 | 4d | 1 | 0.88mi |
| 207 Friedheim Rd Rock Hill, SC | 3.0 | 1.0 | 1000 | $1,549 | $1.55 | 2d | 1 | 0.98mi |
| 1775 Cedar Post Ln Rock Hill, SC | 2.0–3.0 | 1.5 | 1000 | $1,650 | $1.65 | 1d | 1 | 1.01mi |
| 542 E Black St Rock Hill, SC | 2.0 | 1.0 | 850 | $1,595 | $1.88 | 21d | 1 | 1.12mi |
| 542 E Black St Rock Hill, SC | 2.0 | 1.0 | 850 | $1,595 | $1.88 | 4d | 1 | 1.12mi |
| 116 S Spruce St Apt B Rock Hill, SC | 2.0 | 2.0 | 850 | $1,235 | $1.45 | 23d | 1 | 1.13mi |
| 116 S Spruce St Unit A Rock Hill, SC | 2.0 | 2.0 | 850 | $1,200 | $1.41 | 20d | 1 | 1.13mi |
| 819 Chestnut St Rock Hill, SC | 3.0 | 1.0 | 1014 | $1,800 | $1.78 | 4d | 1 | 1.13mi |
| 108 E Main St Rock Hill, SC | 1.0–2.0 | 1.0–2.0 | 779 | $1,893 | $2.43 | 1d | 7 | 1.27mi |
| 175 W Black St Rock Hill, SC | 1.0–2.0 | 1.0–2.0 | 1021 | $1,685 | $1.65 | 20d | 11 | 1.31mi |
| 117 E White St Rock Hill, SC | 2.0 | 1.0–2.0 | 797 | $2,065 | $2.59 | 3d | 33 | 1.36mi |
| 923 Standard St Rock Hill, SC | 1.0–2.0 | 1.0 | 1025 | $1,590 | $1.55 | 1d | 4 | 1.47mi |
Listing history 17 events
-
2026-06-18days on market $115,000 Active 35 DOM
-
2026-06-17days on market $115,000 Active 34 DOM
-
2026-06-16days on market $115,000 Active 33 DOM
-
2026-06-15days on market $115,000 Active 32 DOM
-
2026-06-13days on market $115,000 Active 30 DOM
-
2026-06-09days on market $115,000 Active 26 DOM
-
2026-06-08days on market $115,000 Active 25 DOM
-
2026-06-07days on market $115,000 Active 24 DOM
-
2026-06-04days on market $115,000 Active 21 DOM
-
2026-06-03days on market $115,000 Active 20 DOM
-
2026-06-02days on market $115,000 Active 19 DOM
-
2026-06-01days on market $115,000 Active 18 DOM
-
2026-05-31days on market $115,000 Active 17 DOM
-
2026-05-17status Active
-
2026-04-29status Pending
-
2026-04-27$115,000 Active
-
2026-04-13historical $115,000
ⓘ Source: listings_history table (triggers on properties + properties_extension) + one-shot
backfill from property_details.listing_events for pre-trigger history.
Climate risk First Street
- Flood 1/10 Low FEMA zone X (unshaded) · 0% chance over 30 yrs
- Wildfire 3/10 Moderate
- Heat 6/10 Major 7 d/yr ≥105°F today · 16 d/yr by 30 yrs out
- Wind 6/10 Major 27% chance of damaging wind over 30 yrs
- Air quality 3/10 Moderate 2 unhealthy d/yr today · 3 by 30 yrs out
Nearby sold comps map
Loading sold comps map…
Walkable amenities ~0.75 mi
Loading nearby amenities…
Taxation est. · year 1
- Rental income
- $19,650
- − Mortgage interest
- −$6,442
- − Property taxes
- −$1,725
- − Insurance
- −$575
- − Repairs & maintenance
- −$1,572
- − Management
- −$1,572
- − Depreciation
- −$3,345
- Taxable income
- $4,418
- Est. tax owed @ 24.0%
- −$1,060
- After-tax cash flow
- $4,926/yr
For passive investors: Depreciation is non-cash, so a rental often shows a tax loss while cash-flowing — sheltering income. Rental losses are passive: they offset passive income freely, and up to $25,000/yr can offset ordinary (W-2) income if you actively participate and your MAGI is under $100k (phasing out to $0 by $150k); unused losses carry forward. On sale, claimed depreciation is recaptured at up to 25%, and gains may owe capital-gains tax (a 1031 exchange can defer both). Figures are a year-1 estimate at your 24.0% rate — not tax advice; consult a CPA.
Schools (NCES district)
- District
- York 03
- NCES district ID
- 4503870
- Math proficiency
- 36% ▼ -8.00%
- Reading proficiency
- 47% ▲ 3.00%
- Median HH income
- $47,570
- Composite
- 35.46/100
- National rank
- #4928
- State rank
- #32 of 80 in SC
Livability — Rock Hill
- Score
- 70/100
- State rank
- #62
- US rank
- #7573
Category grades
Schools grade is shown separately in the Schools card above.
Census & demographics
- Census place
- Rock Hill, SC
- County
- York County · 281,758 people
- City population
- 115,874
- Metro
- Charlotte-Concord-Gastonia, NC-SC
- Population (ZIP)
- 58,199
- Household income
- $68,543
- Rent vs Own
- Severe rent burden
- 1869.0
Population outlook (York County) Hauer SSP2
- Today (2025)
- 307,757 people
- By 2030
- 335,979 · +9.2%
- By 2040
- 391,378 · +27.2%
- By 2050
- 443,234 · +44.0%
- By 2075
- 557,102 · +81.0%
- By 2100
- 625,837 · +103.4%
Race, ethnicity, and origin ACS 2023
- Neighborhood character
- Diverse neighborhood (Simpson 0.59)
- Race & ethnicity
- White 51% Black 39% Hispanic / Latino 4% Two or more races 4% Native American 2% Asian 1%
- Common ancestry
- Serbian 2% Slovak 2% Lithuanian 1%
- Foreign-born
- 4% · Canada, Vietnam, China
- Languages at home
- 95% English-only · Spanish 3%
Political lean MEDSL · York
- 2024 margin
- R (+19.1) · D 39.7% · R 58.8% · Other 1.5%
- 2008→2024 swing
- -1.4pp toward R · 2008: -17.7pp · 2024: -19.1pp
- All cycles
- 2024: R+19.1 2020: R+16.5 2016: R+22.1 2012: R+20.5 2008: R+17.7
Not yet ingested
- Civics
- —
Market trends
- HPI YoY
- ▼ -285.91%
- Current HPI
- 268.2609
- Rent YoY
- ▲ 5.53%
- Metro
- Charlotte-Concord-Gastonia, NC-SC
- State GDP YoY
- ▲ 4.51%
- F500 in state
- 2
Industry mix (Fortune 500 HQ in SC)
| Industry | F500 HQs | Revenue |
|---|---|---|
| Packaging | 1 | $7B |
|
||
Price history
+0.0% since first listed4 events — show timeline
- 2026-05-17 Relisted — CANOPYMLS as Distributed by MLS Grid
- 2026-04-29 Pending — CANOPYMLS as Distributed by MLS Grid
- 2026-04-27 Listed $115,000 CANOPYMLS as Distributed by MLS Grid
- 2026-04-13 Coming Soon $115,000 CANOPYMLS as Distributed by MLS Grid
Property tax history
+3.5%/yrLatest (2025): $145 · +12.6% YoY. Source: county tax records.
Cash-flow waterfall
monthlySold comps — $/sqft
last 12 mo · ≤1 miLoading sold comps…