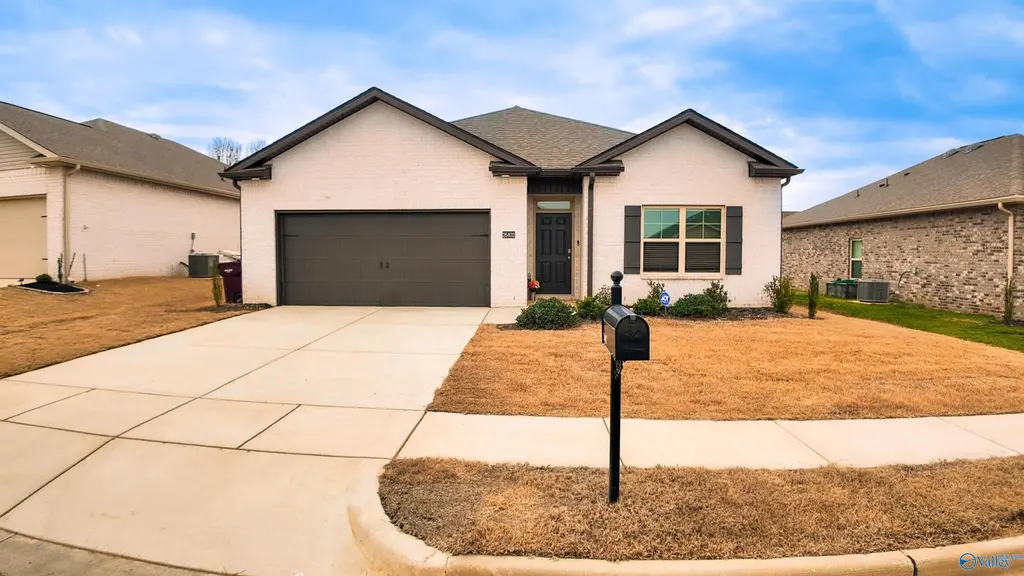
26402 Nash Ln · Athens, AL
Flood risk No data
- FEMA flood zone
- —
- Chance of flooding over 30 yrs
- —
- Est. flood insurance / yr
- —
Fire risk No data
- Est. fire insurance / yr
- —
Heat risk No data
- Hot days now (above threshold)
- —
- Hot days in 30 yrs
- —
Wind risk No data
- Chance of severe wind over 30 yrs
- —
Air-quality risk No data
- Unhealthy air days now
- —
- Unhealthy air days in 30 yrs
- —
Risk factors via First Street. Map © Google.
Why this score? — see what drove the D- grade
The composite is a weighted blend of 9 inputs, each scored 0–100. Each bar is that input's sub-score; the figure is the points it added to the 100-point composite (weight × sub-score).
- Cash flow +11.5/30.0
- ARV discount +8.5/15.0
- Livability +3.8/5.0
- DSCR +3.4/10.0
- Schools +2.8/10.0
- Rent growth +2.5/5.0
- Condition / age +2.5/5.0
- 1% rule +2.1/10.0
- Appreciation +0.0/10.0
$299,000
🖨 Deal sheet 📄 Offer letter ✓ Due diligence
Listing remarks MLS
Lovely home, move-in ready and PRICED TO SELL. This is the popular DR Horton 4 bedroom/2 bath Cali floor plan. Open concept with ample living areas. Spacious kitchen has large granite top island with plenty of counter space. En-suite primary bedroom with double sinks and separate soaking tub. Ceiling fans with remotes in all bedrooms, gutters and large back yard with privacy fence & gate.
Key facts
- Open concept
- Ceiling fans
- Privacy fence
Tags
Neighborhood map
What this means for you Summary
Snapshot
- This is a 4-bed/2.0-bath single-family listed at $299k.
Deal economics
- At list price, monthly cash flow is $-99 ($-1k/yr) — negative.
- To cash-flow at today's rent, offer at most $281k (5.9% below list).
- To meet the 1% rule (rent ≥ 1% of price), the offer needs to be $213k (28.8% below list).
- Recommended offer: $213k (28.8% below list) — sets the bar for 1% rule.
- Cap rate 5.9% vs local median 3.6% in Athens — top-decile yield for the area; either an underpriced asset or a hidden risk that comps aren't pricing in. Stress-test before assuming the spread holds.
Location & tenants
- Location reads 75/100 on livability (#18 in AL, #4,019 nationally) — a middle-class / working-renter tenant base. Strengths: cost of living A+, housing A+, health & safety A+; Watch: employment C-, commute F.
- Limestone County (rural): math 21% / reading 44% proficiency, ranked #52 of 129 in AL (top 40%) — families likely to look elsewhere, expect single-tenant / working-renter base with shorter leases.
- Market conditions: 806 active listings in the ZIP; 10 comparable units currently listed for rent nearby; rentals at typical pace (median 24d on market — plan ~3-4 weeks tenant-placement turnaround); solid renter incomes; 494 units permitted in Limestone County in 2024 (0 in 5+ unit buildings).
Forward outlook
- Local home prices are declining (-3.0%/yr); year-one equity from $2k of loan paydown is wiped out by about $9k of value loss. Plan a longer hold.
- Limestone County population projected at +43% by 2050 — long-run rental-demand tailwind backs the buy-and-hold thesis.
Negotiation context
- It's been on market 99 days — a 9% lower offer ($272k) is reasonable based on typical stale-listing flexibility.
Questions for the listing agent
- What do current leases actually rent for vs. the listed asking? Can we see a recent rent roll and the last 12 months of T-12 income?
- It's been on market 99 days. Have you received any prior offers? Is the seller open to a 29% concession, seller financing, or rate buy-down credit?
- What does the HOA fee cover, when was the last increase, and are there any pending special assessments or reserve-fund shortfalls?
- Why hasn't it sold? Are there any deal-killer items the seller is aware of (foundation, flood, title, zoning, code violations)?
- Is there a deadline driving the sale (1031 exchange, divorce, estate, relocation)? That informs how much negotiation room exists.
- The area grade is low — what's the realistic commute time and amenity access for the typical tenant pool here? Any planned neighborhood developments (good or bad) we should know about?
- What's the average days-on-market for RENTAL listings here right now (not sales)? A rising rental-DOM trend means longer vacancies and softer asking-rent achievability than the comps imply.
- What's the recent tenant-quality profile in this submarket — average credit score on applications, eviction rate, late-payment / NSF rate, and stable-employment percentage? A property-management company in the area should have these aggregated.
- How much new for-sale + rental construction is in the pipeline within 1–3 miles? Heavy new supply typically softens prices + rents 12–24 months out; constrained supply supports both.
Investment metrics
- 1% rule
- 0.71% ✗
- Cap rate
- 5.90%
- Cash-on-cash
- -1.42%
- DSCR
- 0.94
- GRM
- 11.7
CMA / ARV
- ARV (median comp)
- $305,510
- List price
- $299,000
- Delta
- -2.13%
- Verdict
- FAIR
- Comps
- 20 within 1.0 mi
Show comp detail 12 sales within ~0.75 mi
| Address | Dist | Beds/Ba | Sqft | Sold | Price | $/sf | Match |
|---|---|---|---|---|---|---|---|
| 26462 Riparian Dr | 0.14mi | 3/2.0 (-1) | 1,683 (-11%) | 0mo | $260,000 | $154 | 71 |
| 26469 Old Town Dr | 0.15mi | 3/2.0 (-1) | 2,075 (+10%) | 2mo | $393,900 | $190 | 69 |
| 26425 Old Town Dr | 0.13mi | 3/2.0 (-1) | 2,075 (+10%) | 5mo | $393,900 | $190 | 68 |
| 26640 Kyle Ln | 0.42mi | 4/2.5 | 2,022 (+7%) | 0mo | $315,000 | $156 | 66 |
| 26823 Kyle Ln | 0.57mi | 4/2.0 | 1,964 (+4%) | 2mo | $306,262 | $156 | 65 |
| 26797 Kyle Ln | 0.55mi | 4/2.0 | 1,964 (+4%) | 4mo | $307,074 | $156 | 64 |
| 16504 Eden Dr | 0.57mi | 4/2.0 | 1,994 (+6%) | 4mo | $339,000 | $170 | 60 |
| 26594 Pepper Rd | 0.24mi | 3/2.0 (-1) | 1,625 (-14%) | 2mo | $320,000 | $197 | 60 |
| 16702 Ted Childs Dr | 0.70mi | 3/2.0 (-1) | 1,848 (-2%) | 3mo | $301,062 | $163 | 57 |
| 16678 Ted Childs Dr | 0.67mi | 3/2.0 (-1) | 1,765 (-6%) | 5mo | $291,569 | $165 | 49 |
| 26809 Kyle Ln | 0.56mi | 4/3.0 | 2,136 (+13%) | 3mo | $307,045 | $144 | 45 |
| 16694 Ted Childs Dr | 0.69mi | 4/3.0 | 2,092 (+11%) | 2mo | $318,565 | $152 | 44 |
Match score weights: distance 35% · size 25% · config 20% · recency 20%. Top-matched comps best support the ARV.
Projected returns pro-forma
-3.0% appreciation · 3.0% rent growth · sell at horizon
- IRR
- -18.7%
- Equity multiple
- 0.34×
- Total profit
- $-54,904
- Equity at exit
- $44,582
- IRR
- -11.3%
- Equity multiple
- 0.32×
- Total profit
- $-56,514
- Equity at exit
- $25,852
Cash invested: $83,720 (down + closing). Projections, not guarantees.
Landlord ↔ Tenant lean methodology
- Overall (STATE)
- 90 Strongly Landlord-Friendly
- State Alabama
- 90 Strongly Landlord-Friendly · R+15
- County
- — inherits STATE
- City
- — inherits STATE
ZIP-level market 35613
- Home prices YoY
- -33.9%
- Active inventory
- 806
- Price-to-rent
- 11.7×
Monthly cashflow live
- Estimated rent
- $2,130 high interval (Pro) →
- Mortgage (P&I)
- −$1,568
- Tax from tax record
- −$68 /mo · $816/yr
- Insurance
- −$125
- HOA
- −$21
- Vacancy / Maint / Mgmt
- −$447
- Net cashflow
- $-99
Break-even live
UW: 25.0% down · 7.5% · 30yr · 1.5% tax · 5.0% vac · 8.0% maint · 8.0% mgmt
Financing live
Cash to close
- Down payment
- $74,750
- Closing costs
- $8,970
- Reserves months
- —
- Total cash needed
- —
Loan-product check · same deal, 3 products live
Conventional
25% down · 7.5% · 30yr
- Down + closing
- —
- Monthly P&I
- —
- Monthly cashflow
- —
- DSCR
- —
- Eligible?
- —
Personal DTI + credit; lowest rate.
DSCR
20% down · 8.5% · 30yr
- Down + closing
- —
- Monthly P&I
- —
- Monthly cashflow
- —
- DSCR
- —
- Eligible?
- —
No personal income docs; deal must DSCR.
Hard money
10% down · 12.0% · 12mo
- Down + closing
- —
- Monthly P&I
- —
- Monthly cashflow
- —
- DSCR
- —
- Eligible?
- —
Short-term bridge; refi at stabilization.
Rent comps 10 comps
| Address | Beds | Baths | Sqft | Rent | $/sqft | DOM | Units | Dist |
|---|---|---|---|---|---|---|---|---|
| 26491 Riparian Dr Athens, AL | 3.0 | 2.0 | 1497 | $2,200 | $1.47 | 14d | 1 | 0.17mi |
| 16702 Ted Childs Dr Athens, AL | 3.0 | 2.0 | 1848 | $1,950 | $1.06 | 14d | 1 | 0.71mi |
| 16656 Bellewood Dr Athens, AL | 3.0 | 2.0 | 1830 | $1,900 | $1.04 | 44d | 1 | 0.77mi |
| 26333 Kennesaw Bluff Dr Athens, AL | 3.0 | 2.0 | 1745 | $2,000 | $1.15 | 23d | 1 | 0.89mi |
| 15270 Tyler Mill Dr Athens, AL | 3.0 | 2.0 | 1452 | $1,481 | $1.02 | 44d | 1 | 1.00mi |
| 15355 Tyler Mill Dr Athens, AL | 3.0 | 2.5 | 2558 | $1,850 | $0.72 | 44d | 1 | 1.07mi |
| 15395 Mill Valley Dr Athens, AL | 3.0 | 2.0 | 1480 | $1,550 | $1.05 | 14d | 1 | 1.09mi |
| 16774 Mulberry Ln Athens, AL | 4.0 | 3.0 | 2421 | $2,150 | $0.89 | 23d | 1 | 1.15mi |
| 15589 Ruthie Lynn Dr Athens, AL | 4.0 | 3.0 | 1942 | $1,995 | $1.03 | 23d | 1 | 1.25mi |
| 15581 Ruthie Lynn Dr Athens, AL | 4.0 | 2.0 | 2106 | $1,870 | $0.89 | 14d | 1 | 1.26mi |
HOA detail
- Monthly dues
- $21 · $252/yr
Listing history 11 events
-
2026-06-09days on market $299,000 Active 99 DOM
-
2026-06-08days on market $299,000 Active 98 DOM
-
2026-06-07days on market $299,000 Active 97 DOM
-
2026-06-05days on market $299,000 Active 94 DOM
-
2026-06-03days on market $299,000 Active 93 DOM
-
2026-06-02days on market $299,000 Active 92 DOM
-
2026-06-01days on market $299,000 Active 91 DOM
-
2026-05-31days on market $299,000 Active 90 DOM
-
2026-05-30days on market $299,000 Active 89 DOM
-
2026-03-12price $299,000 395-char remark
Show marketing remark (395 chars)
Lovely home, move-in ready and PRICED TO SELL. This is the popular DR Horton 4 bedroom/2 bath Cali floor plan. Open concept with ample living areas. Spacious kitchen has large granite top island with plenty of counter space. En-suite primary bedroom with double sinks and separate soaking tub. Ceiling fans with remotes in all bedrooms, gutters and large back yard with privacy fence & gate.
-
2026-03-02$300,000 Active 395-char remark
Show marketing remark (395 chars)
Lovely home, move-in ready and PRICED TO SELL. This is the popular DR Horton 4 bedroom/2 bath Cali floor plan. Open concept with ample living areas. Spacious kitchen has large granite top island with plenty of counter space. En-suite primary bedroom with double sinks and separate soaking tub. Ceiling fans with remotes in all bedrooms, gutters and large back yard with privacy fence & gate.
ⓘ Source: listings_history table (triggers on properties + properties_extension) + one-shot
backfill from property_details.listing_events for pre-trigger history.
Tax reassessment forecast AL · Resets to sale price
- Current annual tax
- $816 · $68/mo
- Projected year-2 tax
- $1,226 · $102/mo
- Expected delta
- +$410/yr (+$34/mo · 50.2%)
ⓘ Screening estimate from a state-policy table — verify with the county assessor before closing.
Nearby sold comps map
Loading sold comps map…
Walkable amenities ~0.75 mi
Loading nearby amenities…
Taxation est. · year 1
- Rental income
- $25,557
- − Mortgage interest
- −$16,749
- − Property taxes
- −$816
- − Insurance
- −$1,495
- − Repairs & maintenance
- −$2,045
- − Management
- −$2,045
- − HOA
- −$252
- − Depreciation
- −$8,698
- Taxable loss
- −$6,542
- Est. tax savings @ 24.0%
- +$1,570
- After-tax cash flow
- $381/yr
For passive investors: Depreciation is non-cash, so a rental often shows a tax loss while cash-flowing — sheltering income. Rental losses are passive: they offset passive income freely, and up to $25,000/yr can offset ordinary (W-2) income if you actively participate and your MAGI is under $100k (phasing out to $0 by $150k); unused losses carry forward. On sale, claimed depreciation is recaptured at up to 25%, and gains may owe capital-gains tax (a 1031 exchange can defer both). Figures are a year-1 estimate at your 24.0% rate — not tax advice; consult a CPA.
Schools (NCES district)
- District
- Limestone County
- NCES district ID
- 0102100
- Math proficiency
- 21% ▼ -23.00%
- Reading proficiency
- 44% ▼ -3.00%
- Median HH income
- $48,972
- Composite
- 28.09/100
- National rank
- #6829
- State rank
- #52 of 129 in AL
Livability — Athens
- Score
- 75/100
- State rank
- #18
- US rank
- #4019
Category grades
Schools grade is shown separately in the Schools card above.
Census & demographics
- County
- Limestone County · 80,439 people
- City population
- 55,492
- Metro
- Huntsville, AL
- Population (ZIP)
- 25,523
- Household income
- $100,845
- Rent vs Own
- Severe rent burden
- 118.0
Population outlook (Limestone County) Hauer SSP2
- Today (2025)
- 111,441 people
- By 2030
- 121,272 · +8.8%
- By 2040
- 140,705 · +26.3%
- By 2050
- 159,069 · +42.7%
- By 2075
- 202,231 · +81.5%
- By 2100
- 230,608 · +106.9%
Race, ethnicity, and origin ACS 2023
- Neighborhood character
- Predominantly White (83%)
- Race & ethnicity
- White 83% Black 7% Hispanic / Latino 5% Two or more races 5%
- Hispanic origin (detail)
- Mexican 4%
- Common ancestry
- Slovak 3% Lithuanian 2% Romanian 2%
- Foreign-born
- 3% · Canada
- Languages at home
- 96% English-only · Spanish 3% Vietnamese 1%
Political lean MEDSL · Limestone
- 2024 margin
- Solid R (+43.9) · D 27.5% · R 71.4% · Other 1.2%
- 2008→2024 swing
- -2.0pp toward R · 2008: -41.9pp · 2024: -43.9pp
- All cycles
- 2024: R+43.9 2020: R+42.6 2016: R+49.5 2012: R+43.6 2008: R+41.9
Not yet ingested
- Civics
- —
Market trends
- HPI YoY
- ▼ -88.56%
- Current HPI
- 173.0763
- Rent YoY
- —
- Metro
- Huntsville, AL
- State GDP YoY
- ▲ 2.94%
- F500 in state
- 4
Industry mix (Fortune 500 HQ in AL)
| Industry | F500 HQs | Revenue |
|---|---|---|
| Financial Services | 1 | $8B |
|
||
| Healthcare | 1 | $5B |
|
||
Price history
-0.3% since first listed2 events — show timeline
- 2026-03-12 Price Changed $299,000 VMLS
- 2026-03-02 Listed $300,000 VMLS
Cash-flow waterfall
monthlySold comps — $/sqft
last 12 mo · ≤1 miLoading sold comps…