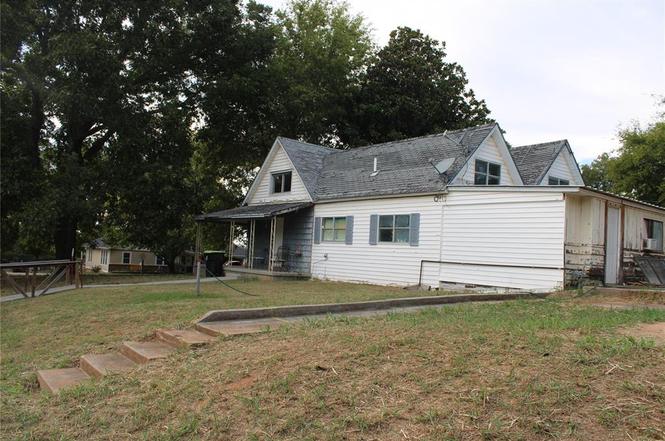
200 E Juanita St · Wynnewood, OK
Flood risk 1/10 · Minimal
- FEMA flood zone
- X (unshaded)
- Chance of flooding over 30 yrs
- 0.0%
- Est. flood insurance / yr
- $507 – $1,088
Fire risk 4/10 · Minor
- Est. fire insurance / yr
- $2,463 – $4,575
Heat risk 6/10 · Moderate
- Hot days now (above 109°F)
- 7 days/yr
- Hot days in 30 yrs
- 19 days/yr
Wind risk 3/10 · Minor
- Chance of severe wind over 30 yrs
- 8.0%
Air-quality risk 2/10 · Minimal
- Unhealthy air days now
- 0 days/yr
- Unhealthy air days in 30 yrs
- 1 days/yr
Risk factors via First Street. Map © Google.
Why this score? — see what drove the B+ grade
The composite is a weighted blend of 9 inputs, each scored 0–100. Each bar is that input's sub-score; the figure is the points it added to the 100-point composite (weight × sub-score).
- Cash flow +30.0/30.0
- 1% rule +10.0/10.0
- DSCR +10.0/10.0
- Appreciation +8.9/10.0
- ARV discount +7.5/15.0
- Livability +3.1/5.0
- Rent growth +2.5/5.0
- Condition / age +2.5/5.0
- Schools +1.5/10.0
$45,000
🖨 Deal sheet (PDF) 📄 Offer letter ✓ Due diligence
Listing remarks MLS
Fixer Upper! Remodel started on Large House on Corner lot near Downtown and Schools. Could be 5 bedrooms, 3 upstairs, and 3 baths. Remodel started. Pretty hardwood in several rooms. Huge kitchen with pretty cabinets and countertops. Bonus Room off kitchen with door to outside concrete slab. Lots of Potenial but needs Lots of Love. Being sold "As Is"
Key facts
- 7,013 sq ft lot
- Built 1962
- Listed 239 days
Property features AI
Finance
- Other: Homestead exemption applied; Occupied by owner; Living area reported as 2,480 (source: assessor); Located in Wynnewood City addition; No storm shelter; Directions: From Hwy. 77 take Dean A. McGee to E. Juanita St. and turn right; property is on corner
- Financial info: Sold as-is; cash offers accepted; Not assumable
- HOA & community: No mandatory association dues
Exterior
- Parking: No parking details provided
- Security: No security features listed
- Utilities: Cable available; Electricity available; Natural gas available; High-speed internet available; Public utilities
- Home design: Single family residence; Residential property; Multi-level property; Property faces south; Existing property
- Construction: Frame construction; Composition roof; Combination foundation
- Exterior features: Covered porch; Corner lot
Interior
- Kitchen: No kitchen appliance details provided
- Bedrooms: 5 bedrooms
- Flooring: Concrete flooring; Vinyl flooring; Wood flooring
- Bathrooms: 3 full bathrooms
- Heating & cooling: No heating system listed; No cooling system listed
- Interior features: Water heater; Concrete, vinyl, and wood flooring; Two living areas
- Laundry & utility: No laundry appliance details provided
Neighborhood map
What this means for you Summary
Snapshot
- This is a 3-bed/2.0-bath single-family listed at $45k.
Deal economics
- At list price, monthly cash flow is $685 ($8k/yr) — positive.
- The deal already cash-flows at list — no discount required.
- Meets the 1% rule at list price ($1k rent vs $45k).
- Recommended offer: $40k (12.0% below list) — sets the bar for market timing.
- Cap rate 24.5% vs local median 5.9% in Wynnewood — top-decile yield for the area; either an underpriced asset or a hidden risk that comps aren't pricing in. Stress-test before assuming the spread holds.
Location & tenants
- Location reads 62/100 on livability (#253 in OK) — a middle-class / working-renter tenant base. Strengths: cost of living A+, housing A+; Watch: employment D, amenities F, commute F.
- Wynnewood (rural): math 13% / reading 22% proficiency, ranked #198 of 270 in OK (top 73%) — low school quality limits family demand, transient renter base, plan for 1-2y turnover.
- Zoned schools: Central Es (math 17% / reading 27%, grade F, #413 of 845 statewide, top 54%, 277 students, 0% FRL); Wynnewood Hs (math 5% / reading 24%, grade F, #332 of 447 statewide, top 78%, 210 students, 0% FRL) — zoned schools average 0% FRL vs 51% district-wide (51 pts lower); this property's tenant base skews higher-income than the district average.
- Market conditions: 55 active listings in the ZIP; 1 units permitted in Garvin County in 2024 (0 in 5+ unit buildings).
Forward outlook
- In year one you build about $4k of equity ($311 loan paydown + $4k appreciation (7.9% local appreciation)).
- Garvin County population projected at +8% by 2050 — modest demand growth; plan on rents tracking national, not racing it.
- At projected returns (7.9% appreciation + 3.0% rent growth), your $13k cash investment doubles in ~2 years — after that, you're playing with house money.
- By year 8, paydown + projected appreciation supports a ~$32k cash-out refi (75% LTV) — recoverable capital for the next deal without selling this one.
Negotiation context
- It's been on market 239 days — a 12% lower offer ($40k) is reasonable based on typical stale-listing flexibility.
- 3 sale attempts since 5y ago; this cycle's ask has dropped $5k (10%) from the opening price — seller is motivated, your offer sets the floor, not the list.
Risks & watch-outs
- Climate carrying-cost: extreme-heat days projected 7→19/yr by 2055 (HVAC capex compounding) — expect insurance premiums to compound above CPI over the hold.
Questions for the listing agent
- It's been on market 239 days. Have you received any prior offers? Is the seller open to a 12% concession, seller financing, or rate buy-down credit?
- Built in 1962 — when were the roof, HVAC, electrical panel, plumbing, and water heater last replaced?
- Why hasn't it sold? Are there any deal-killer items the seller is aware of (foundation, flood, title, zoning, code violations)?
- Is there a deadline driving the sale (1031 exchange, divorce, estate, relocation)? That informs how much negotiation room exists.
- Schools are F-rated, which usually means shorter tenancies and higher turnover. Who's the typical renter profile here, and what's been the actual vacancy rate?
- What's the average days-on-market for RENTAL listings here right now (not sales)? A rising rental-DOM trend means longer vacancies and softer asking-rent achievability than the comps imply.
- What's the recent tenant-quality profile in this submarket — average credit score on applications, eviction rate, late-payment / NSF rate, and stable-employment percentage? A property-management company in the area should have these aggregated.
- How much new for-sale + rental construction is in the pipeline within 1–3 miles? Heavy new supply typically softens prices + rents 12–24 months out; constrained supply supports both.
Investment metrics
- 1% rule
- 2.77% ✓
- Cap rate
- 24.55%
- Cash-on-cash
- 65.19%
- DSCR
- 3.90
- GRM
- 3.0
CMA / ARV
- ARV (on-the-fly)
- $218,240
- Comps found
- 3
Show comp detail 3 sales within ~0.75 mi
| Address | Dist | Beds/Ba | Sqft | Sold | Price | $/sf | Match |
|---|---|---|---|---|---|---|---|
| 406 S Gardner Ave | 0.06mi | 4/2.0 (+1) | 2,372 (-4%) | 6mo | $208,500 | $88 | 80 |
| 401 E Robert S Kerr Blvd | 0.20mi | 3/2.0 | 2,320 (-6%) | 17mo | $285,000 | $123 | 66 |
| 401 S Taylor Ave | 0.22mi | 4/2.0 (+1) | 2,660 (+7%) | 23mo | $225,000 | $85 | 54 |
Match score weights: distance 35% · size 25% · config 20% · recency 20%. Top-matched comps best support the ARV.
Projected returns pro-forma
7.9% appreciation · 3.0% rent growth · sell at horizon
- IRR
- 74.7%
- Equity multiple
- 5.91×
- Total profit
- $61,856
- Equity at exit
- $33,879
- IRR
- 70.3%
- Equity multiple
- 12.67×
- Total profit
- $147,090
- Equity at exit
- $66,957
Cash invested: $12,600 (down + closing). Projections, not guarantees.
Landlord ↔ Tenant lean methodology
- Overall (STATE)
- 83 Strongly Landlord-Friendly
- State Oklahoma
- 83 Strongly Landlord-Friendly · R+20
- County
- — inherits STATE
- City
- — inherits STATE
ZIP-level market 73098
- Home prices YoY
- 2.9%
- Active inventory
- 55
- Price-to-rent
- 3.0×
Monthly cashflow live
- Estimated rent
- $1,245 medium interval (Pro) →
- Mortgage (P&I)
- −$236
- Tax from tax record
- −$44 /mo · $530/yr
- Insurance
- −$19
- HOA
- −$0
- Vacancy / Maint / Mgmt
- −$261
- Net cashflow
- $685
Break-even live
Sensitivity live
| Price | -10% $710 | -5% $697 | +0% $685 | +5% $672 | +10% $659 |
|---|---|---|---|---|---|
| Rent | -10% $586 | -5% $635 | +0% $685 | +5% $734 | +10% $783 |
| Rate | -1.0pp $707 | -0.5pp $696 | base $685 | +0.5pp $673 | +1.0pp $661 |
UW: 25.0% down · 7.5% · 30yr · 1.5% tax · 5.0% vac · 8.0% maint · 8.0% mgmt
Financing live
Cash to close
- Down payment
- $11,250
- Closing costs
- $1,350
- Reserves months
- —
- Total cash needed
- —
Loan-product check · same deal, 3 products live
Conventional
25% down · 7.5% · 30yr
- Down + closing
- —
- Monthly P&I
- —
- Monthly cashflow
- —
- DSCR
- —
- Eligible?
- —
Personal DTI + credit; lowest rate.
DSCR
20% down · 8.5% · 30yr
- Down + closing
- —
- Monthly P&I
- —
- Monthly cashflow
- —
- DSCR
- —
- Eligible?
- —
No personal income docs; deal must DSCR.
Hard money
10% down · 12.0% · 12mo
- Down + closing
- —
- Monthly P&I
- —
- Monthly cashflow
- —
- DSCR
- —
- Eligible?
- —
Short-term bridge; refi at stabilization.
Listing history 24 events
-
2026-06-14status $45,000 Pending 239 DOM
-
2026-06-13days on market $45,000 Active 239 DOM
-
2026-06-12days on market $45,000 Active 238 DOM
-
2026-06-09days on market $45,000 Active 235 DOM
-
2026-06-08days on market $45,000 Active 234 DOM
-
2026-06-08days on market $45,000 Active 233 DOM
-
2026-06-07days on market $45,000 Active 232 DOM
-
2026-06-04days on market $45,000 Active 229 DOM
-
2026-06-02days on market $45,000 Active 228 DOM
-
2026-06-01days on market $45,000 Active 227 DOM
-
2026-05-31days on market $45,000 Active 226 DOM
-
2026-03-25price $45,000
-
2026-02-25price $48,800
-
2026-02-25price $47,000
-
2025-10-16$49,800 Active
-
2022-10-26soldstatus $48,000
-
2022-10-21soldstatus $48,000 Closed 361-char remark
Show marketing remark (361 chars)
Fixer Upper! Remodel started on Large House on Corner lot near Downtown and Schools. Could be 5 bedrooms, 3 upstairs, and 3 baths. Remodel started. Pretty hardwood in several rooms. Huge kitchen with pretty cabinets and countertops. Bonus Room off kitchen with door to outside concrete slab. Lots of Potenial but needs Lots of Love. Being sold "As Is"
-
2022-10-03status Pending 361-char remark
Show marketing remark (361 chars)
Fixer Upper! Remodel started on Large House on Corner lot near Downtown and Schools. Could be 5 bedrooms, 3 upstairs, and 3 baths. Remodel started. Pretty hardwood in several rooms. Huge kitchen with pretty cabinets and countertops. Bonus Room off kitchen with door to outside concrete slab. Lots of Potenial but needs Lots of Love. Being sold "As Is"
-
2022-09-06$50,000 Active 361-char remark
Show marketing remark (361 chars)
Fixer Upper! Remodel started on Large House on Corner lot near Downtown and Schools. Could be 5 bedrooms, 3 upstairs, and 3 baths. Remodel started. Pretty hardwood in several rooms. Huge kitchen with pretty cabinets and countertops. Bonus Room off kitchen with door to outside concrete slab. Lots of Potenial but needs Lots of Love. Being sold "As Is"
-
2022-01-18historical
-
2021-12-13price $49,900
-
2021-11-01price $54,900
-
2021-08-20$69,900 Active
-
2009-02-25soldstatus $62,500
ⓘ Source: listings_history table (triggers on properties + properties_extension) + one-shot
backfill from property_details.listing_events for pre-trigger history.
Tax reassessment forecast OK · Resets to sale price
- Current annual tax
- $530 · $44/mo
- Projected year-2 tax
- $530 · $44/mo
- Expected delta
- $0/yr ($0/mo · 0.0%)
ⓘ Screening estimate from a state-policy table — verify with the county assessor before closing.
Climate risk First Street
- Flood 1/10 Low FEMA zone X (unshaded) · 0% chance over 30 yrs
- Wildfire 4/10 Moderate
- Heat 6/10 Major 7 d/yr ≥109°F today · 19 d/yr by 30 yrs out
- Wind 3/10 Moderate 8% chance of damaging wind over 30 yrs
- Air quality 2/10 Low 0 unhealthy d/yr today · 1 by 30 yrs out
Nearby sold comps map
Loading sold comps map…
Walkable amenities ~0.75 mi
Loading nearby amenities…
Taxation est. · year 1
- Rental income
- $14,938
- − Mortgage interest
- −$2,521
- − Property taxes
- −$530
- − Insurance
- −$225
- − Repairs & maintenance
- −$1,195
- − Management
- −$1,195
- − Depreciation
- −$1,309
- Taxable income
- $7,963
- Est. tax owed @ 24.0%
- −$1,911
- After-tax cash flow
- $6,303/yr
For passive investors: Depreciation is non-cash, so a rental often shows a tax loss while cash-flowing — sheltering income. Rental losses are passive: they offset passive income freely, and up to $25,000/yr can offset ordinary (W-2) income if you actively participate and your MAGI is under $100k (phasing out to $0 by $150k); unused losses carry forward. On sale, claimed depreciation is recaptured at up to 25%, and gains may owe capital-gains tax (a 1031 exchange can defer both). Figures are a year-1 estimate at your 24.0% rate — not tax advice; consult a CPA.
Schools (NCES district)
- District
- Wynnewood
- NCES district ID
- 4033300
- Math proficiency
- 13% ▼ -7.00%
- Reading proficiency
- 22% ▼ -2.00%
- Median HH income
- $42,075
- Composite
- 15.05/100
- National rank
- #9352
- State rank
- #198 of 270 in OK
Livability — Wynnewood
- Score
- 62/100
- State rank
- #253
- US rank
- #16754
Category grades
Schools grade is shown separately in the Schools card above.
Census & demographics
- Census place
- Wynnewood, OK
- Population (ZIP)
- 3,382
Population outlook (Garvin County) Hauer SSP2
- Today (2025)
- 28,277 people
- By 2030
- 28,619 · +1.2%
- By 2040
- 29,478 · +4.2%
- By 2050
- 30,384 · +7.5%
- By 2075
- 34,074 · +20.5%
- By 2100
- 36,099 · +27.7%
Race, ethnicity, and origin ACS 2023
- Neighborhood character
- Predominantly White (74%)
- Race & ethnicity
- White 74% Two or more races 14% Hispanic / Latino 9% Native American 3% Black 2%
- Hispanic origin (detail)
- Mexican 8%
- Common ancestry
- Slovak 3% European 3% Serbian 2%
- Foreign-born
- 4% · Canada
- Languages at home
- 96% English-only · Spanish 3% German/W. Germanic 1%
Political lean MEDSL · Garvin
- 2024 margin
- Solid R (+66.1) · D 16.4% · R 82.5% · Other 1.1%
- 2008→2024 swing
- -22.5pp toward R · 2008: -43.6pp · 2024: -66.1pp
- All cycles
- 2024: R+66.1 2020: R+64.2 2016: R+60.7 2012: R+46.1 2008: R+43.6
Not yet ingested
- Civics
- —
Market trends
- HPI YoY
- ▲ 7.90%
- Current HPI
- 280.5166
- Rent YoY
- —
- Metro
- —
- State GDP YoY
- ▲ 1.55%
- F500 in state
- 6
Industry mix (Fortune 500 HQ in OK)
| Industry | F500 HQs | Revenue |
|---|---|---|
| Energy | 3 | $48B |
|
||
Price history
-28.0% since first listed13 events — show timeline
- 2026-03-25 Price Changed $45,000 MLSOK
- 2026-02-25 Price Changed $48,800 MLSOK
- 2026-02-25 Price Changed $47,000 MLSOK
- 2025-10-16 Listed $49,800 MLSOK
- 2022-10-26 Sold (Public Records) $48,000 Public Records
- 2022-10-21 Sold (MLS) $48,000 MLSOK
- 2022-10-03 Pending — MLSOK
- 2022-09-06 Listed $50,000 MLSOK
- 2022-01-18 Listing Removed — MLSOK
- 2021-12-13 Price Changed $49,900 MLSOK
- 2021-11-01 Price Changed $54,900 MLSOK
- 2021-08-20 Listed $69,900 MLSOK
- 2009-02-25 Sold (Public Records) $62,500 Public Records
Property tax history
+0.2%/yrLatest (2025): $530 · +13.2% YoY. Source: county tax records.
Cash-flow waterfall
monthlySold comps — $/sqft
last 12 mo · ≤1 miLoading sold comps…