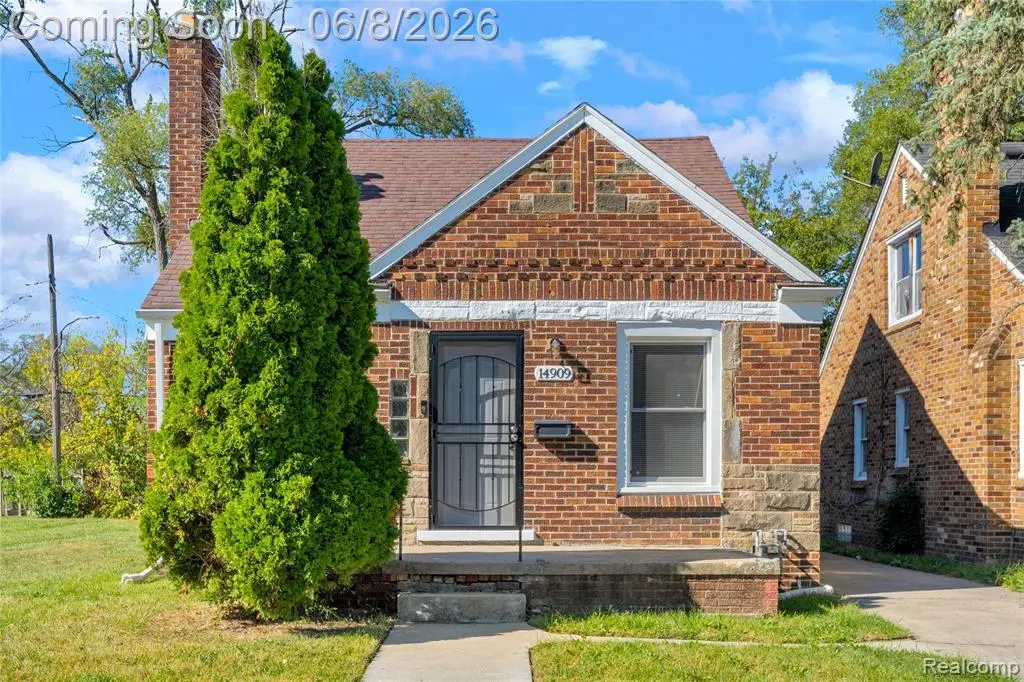
14909 Griggs St · Detroit, MI
Flood risk 1/10 · Minimal
- FEMA flood zone
- X (unshaded)
- Chance of flooding over 30 yrs
- 0.0%
- Est. flood insurance / yr
- $473 – $860
Fire risk 1/10 · Minimal
- Est. fire insurance / yr
- $784 – $1,456
Heat risk 2/10 · Minimal
- Hot days now (above 97°F)
- 7 days/yr
- Hot days in 30 yrs
- 14 days/yr
Wind risk 2/10 · Minimal
- Chance of severe wind over 30 yrs
- —
Air-quality risk 3/10 · Minor
- Unhealthy air days now
- 2 days/yr
- Unhealthy air days in 30 yrs
- 5 days/yr
Risk factors via First Street. Map © Google.
Why this score? — see what drove the C+ grade
The composite is a weighted blend of 9 inputs, each scored 0–100. Each bar is that input's sub-score; the figure is the points it added to the 100-point composite (weight × sub-score).
- Cash flow +28.7/30.0
- DSCR +10.0/10.0
- ARV discount +7.5/15.0
- 1% rule +7.0/10.0
- Rent growth +4.0/5.0
- Livability +3.7/5.0
- Condition / age +2.5/5.0
- Schools +1.3/10.0
- Appreciation +0.0/10.0
$99,700
🖨 Deal sheet (PDF) 📄 Offer letter ✓ Due diligence
Listing remarks
Beautiful Brick Bungalow perfect for first-time homebuyers or investors. Step inside and be welcomed by a stunning floor-to-ceiling stone fireplace and beautiful hardwood floors throughout the main living area. The updated kitchen comes complete with a refrigerator, microwave, and oven. The main floor features two spacious bedrooms, while the large upper-level primary bedroom includes a convenient half bath. Major updates completed in 2021 include the roof, plumbing, electrical, furnace, central AC, and hot water tank, providing peace of mind for years to come.
Key facts
- 3,920 sq ft lot
- Built 1947
- Listed 13 days
Property features AI
Exterior
- Utilities: Public water; Natural gas; Forced air heating
- Home design: Residential property; 2-story structure; Built in 1947; Facing/entry level information not specified
- Construction: Brick construction; Basement foundation; Built in 1947
- Exterior features: Brick exterior; Paved street frontage
Interior
- Kitchen: Kitchen at entry level (approximately 7 x 5); Dishwasher; Microwave
- Bedrooms: Bedroom 1 on second level (approximately 11 x 8); Bedroom 2 on entry level (approximately 8 x 8); Bedroom 3 on entry level (approximately 8 wide)
- Bathrooms: 1 full bathroom; 2 total baths/lavatories; 1 lavatory
- Heating & cooling: Forced air heating; Natural gas fuel
- Interior features: Fireplace in family room (natural fireplace); Unfinished basement
- Laundry & utility: Basement present (unfinished) — typical utility/storage space
Neighborhood map
What this means for you Summary
Snapshot
- This is a 3-bed/1.0-bath single-family listed at $100k.
Deal economics
- At list price, monthly cash flow is $331 ($4k/yr) — positive.
- The deal already cash-flows at list — no discount required.
- Meets the 1% rule at list price ($1k rent vs $100k).
Location & tenants
- Location reads 73/100 on livability (#218 in MI) — a middle-class / working-renter tenant base. Strengths: amenities A+, commute A+, cost of living A+; Watch: schools F, crime F, employment F.
- Detroit Public Schools Community District (urban): math 10% / reading 24% proficiency, ranked #499 of 540 in MI (top 92%) — low school quality limits family demand, transient renter base, plan for 1-2y turnover; 90% free/reduced lunch — lower-income household profile, screen leases tightly.
- Market conditions: Rents rising fast (+6.1%/yr); 348 active listings in the ZIP; 38 comparable units currently listed for rent nearby; rentals at typical pace (median 19d on market — plan ~3-4 weeks tenant-placement turnaround); lower-income renter base — watch delinquency; 2,639 units permitted in Wayne County in 2024 (1,216 in 5+ unit buildings).
- This rent runs 43% of the median local income ($33k/yr) — at the standard rent-burdened threshold; future hikes will face affordability resistance.
Forward outlook
- Local home prices are declining (-3.0%/yr); year-one equity from $689 of loan paydown is wiped out by about $3k of value loss. Plan a longer hold.
- Wayne County population projected at -17% by 2050 — secular population decline; favor cash flow + early exit over multi-decade hold.
- At projected returns (-3.0% appreciation + 6.1% rent growth), your $28k cash investment doubles in ~7 years — after that, you're playing with house money.
Negotiation context
- Only 14 days on market — expect competitive offers; lowballing is unlikely to land.
- 5 sale attempts; this cycle's ask is 7876% above the opening price — seller raised mid-cycle; expect resistance to lowballs.
- Current owner paid $12k; list at $100k implies a 750% gain — meaningful room to come down on a strong offer.
Risks & watch-outs
- Watch-outs: built in 1947 — expect roof / HVAC / electrical / plumbing capex.
Questions for the listing agent
- Built in 1947 — when were the roof, HVAC, electrical panel, plumbing, and water heater last replaced?
- Is there a deadline driving the sale (1031 exchange, divorce, estate, relocation)? That informs how much negotiation room exists.
- Schools are F-rated, which usually means shorter tenancies and higher turnover. Who's the typical renter profile here, and what's been the actual vacancy rate?
- Crime grade is F in this area — have there been break-ins, vandalism, or insurance claims at this property in the last 3 years? What carrier currently insures it and at what premium?
- What's the average days-on-market for RENTAL listings here right now (not sales)? A rising rental-DOM trend means longer vacancies and softer asking-rent achievability than the comps imply.
- What's the recent tenant-quality profile in this submarket — average credit score on applications, eviction rate, late-payment / NSF rate, and stable-employment percentage? A property-management company in the area should have these aggregated.
- How much new for-sale + rental construction is in the pipeline within 1–3 miles? Heavy new supply typically softens prices + rents 12–24 months out; constrained supply supports both.
Investment metrics
- 1% rule
- 1.20% ✓
- Cap rate
- 10.28%
- Cash-on-cash
- 14.25%
- DSCR
- 1.63
- GRM
- 7.0
CMA / ARV
- ARV (on-the-fly)
- $57,891
- Comps found
- 12
Show comp detail 12 sales within ~0.75 mi
| Address | Dist | Beds/Ba | Sqft | Sold | Price | $/sf | Match |
|---|---|---|---|---|---|---|---|
| 14611 Washburn St | 0.22mi | 2/1.0 (-1) | 790 (-6%) | 10mo | $34,900 | $44 | 67 |
| 15856 Monte Vista St | 0.67mi | 3/1.0 | 848 (+1%) | 3mo | $59,900 | $71 | 64 |
| 14811 Northlawn St | 0.49mi | 3/1.0 | 851 (+1%) | 16mo | $79,000 | $93 | 62 |
| 14284 Kentucky St | 0.52mi | 2/1.0 (-1) | 825 (-2%) | 8mo | $27,000 | $33 | 61 |
| 14677 Cloverlawn Ave | 0.55mi | 3/1.5 | 900 (+7%) | 1mo | $20,000 | $22 | 59 |
| 14014 Washburn St | 0.66mi | 2/1.0 (-1) | 876 (+4%) | 3mo | $17,000 | $19 | 55 |
| 15732 Manor St | 0.55mi | 3/1.0 | 930 (+11%) | 3mo | $50,000 | $54 | 53 |
| 14619 Greenlawn St | 0.67mi | 2/1.0 (-1) | 804 (-4%) | 5mo | $52,000 | $65 | 53 |
| 14871 NE Cheyenne St NW | 0.61mi | 3/1.0 | 878 (+5%) | 13mo | $69,000 | $79 | 53 |
| 15756 Meyers Rd | 0.61mi | 2/1.0 (-1) | 946 (+13%) | 4mo | $65,000 | $69 | 42 |
| 15754 Meyers Rd | 0.60mi | 2/1.0 (-1) | 946 (+13%) | 4mo | $65,000 | $69 | 42 |
| 14595 Littlefield St | 0.69mi | 3/1.0 | 916 (+9%) | 16mo | $68,000 | $74 | 39 |
Match score weights: distance 35% · size 25% · config 20% · recency 20%. Top-matched comps best support the ARV.
Projected returns pro-forma
-3.0% appreciation · 6.14% rent growth · sell at horizon
- IRR
- 7.8%
- Equity multiple
- 1.32×
- Total profit
- $8,814
- Equity at exit
- $14,866
- IRR
- 19.5%
- Equity multiple
- 2.85×
- Total profit
- $51,771
- Equity at exit
- $8,620
Cash invested: $27,916 (down + closing). Projections, not guarantees.
Landlord ↔ Tenant lean methodology
- Overall (STATE)
- 62 Landlord-Friendly
- State Michigan
- 62 Landlord-Friendly · EVEN
- County
- — inherits STATE
- City
- — inherits STATE
ZIP-level market 48238
- Home prices YoY
- -14.4%
- Rents YoY
- 6.1%
- Active inventory
- 348
- Price-to-rent
- 7.0×
Monthly cashflow live
- Estimated rent
- $1,194 high interval (Pro) →
- Mortgage (P&I)
- −$523
- Tax from tax record
- −$48 /mo · $573/yr
- Insurance
- −$42
- HOA
- −$0
- Vacancy / Maint / Mgmt
- −$251
- Net cashflow
- $331
Break-even live
Sensitivity live
| Price | -10% $388 | -5% $360 | +0% $331 | +5% $303 | +10% $275 |
|---|---|---|---|---|---|
| Rent | -10% $237 | -5% $284 | +0% $331 | +5% $379 | +10% $426 |
| Rate | -1.0pp $382 | -0.5pp $357 | base $331 | +0.5pp $306 | +1.0pp $279 |
UW: 25.0% down · 7.5% · 30yr · 1.5% tax · 5.0% vac · 8.0% maint · 8.0% mgmt
Financing live
Cash to close
- Down payment
- $24,925
- Closing costs
- $2,991
- Reserves months
- —
- Total cash needed
- —
Loan-product check · same deal, 3 products live
Conventional
25% down · 7.5% · 30yr
- Down + closing
- —
- Monthly P&I
- —
- Monthly cashflow
- —
- DSCR
- —
- Eligible?
- —
Personal DTI + credit; lowest rate.
DSCR
20% down · 8.5% · 30yr
- Down + closing
- —
- Monthly P&I
- —
- Monthly cashflow
- —
- DSCR
- —
- Eligible?
- —
No personal income docs; deal must DSCR.
Hard money
10% down · 12.0% · 12mo
- Down + closing
- —
- Monthly P&I
- —
- Monthly cashflow
- —
- DSCR
- —
- Eligible?
- —
Short-term bridge; refi at stabilization.
Rent comps 38 comps
| Address | Beds | Baths | Sqft | Rent | $/sqft | DOM | Units | Dist |
|---|---|---|---|---|---|---|---|---|
| 14881 Mendota St Detroit, MI | 3.0 | 1.0 | 1026 | $1,100 | $1.07 | 25d | 1 | 0.11mi |
| 15512 Mendota St Apt 2 Detroit, MI | 2.0 | 1.0 | 1000 | $1,200 | $1.20 | 45d | 1 | 0.48mi |
| 15512 Mendota St Detroit, MI | 2.0 | 1.0 | 931 | $1,200 | $1.29 | 6d | 1 | 0.48mi |
| 14570 Cherrylawn St Detroit, MI | 3.0 | 1.0 | 840 | $1,250 | $1.49 | 13d | 1 | 0.49mi |
| 15388 Appoline St #203 Detroit, MI | 2.0 | 1.0 | 900 | $850 | $0.94 | 45d | 1 | 0.50mi |
| 14550 Northlawn St Detroit, MI | 3.0 | 2.0 | 950 | $1,200 | $1.26 | 18d | 1 | 0.55mi |
| 15765 Washburn St Unit 15767 Washburn Upper Detroit, MI | 2.0 | 1.0 | 1093 | $950 | $0.87 | 0d | 1 | 0.56mi |
| 15760 Monte Vista St Detroit, MI | 2.0 | 1.0 | 1080 | $1,250 | $1.16 | 45d | 1 | 0.59mi |
| 14847 Cheyenne St Detroit, MI | 3.0 | 2.0 | 849 | $1,150 | $1.35 | 19d | 1 | 0.61mi |
| 14656 Roselawn St Detroit, MI | 3.0 | 1.0 | 1000 | $1,200 | $1.20 | 18d | 1 | 0.62mi |
| 15777 Wisconsin St Unit 77 Detroit, MI | 2.0 | 1.0 | 900 | $950 | $1.06 | 6d | 1 | 0.66mi |
| 15839 Kentucky St Detroit, MI | 2.0 | 1.0 | 800 | $1,200 | $1.50 | 18d | 1 | 0.69mi |
| 15738 Sorrento Ave Detroit, MI | 3.0 | 1.0 | 762 | $1,175 | $1.54 | 45d | 1 | 0.71mi |
| 15878 Kentucky St Detroit, MI | 2.0 | 1.0 | 800 | $900 | $1.12 | 45d | 1 | 0.73mi |
| 14891 Hartwell St Detroit, MI | 3.0 | 1.0 | 1000 | $1,150 | $1.15 | 45d | 1 | 0.77mi |
| 15340 Hartwell St Detroit, MI | 2.0 | 1.0 | 900 | $1,300 | $1.44 | 18d | 1 | 0.80mi |
| 14903 Tracey St Detroit, MI | 3.0 | 1.0 | 1004 | $1,100 | $1.10 | 18d | 1 | 0.88mi |
| 16230 Indiana St Unit 2 Detroit, MI | 2.0 | 1.0 | 1050 | $1,200 | $1.14 | 19d | 1 | 0.92mi |
| 15771 Turner St Detroit, MI | 2.0 | 1.0 | 1000 | $1,049 | $1.05 | 45d | 1 | 0.92mi |
| 16204 Steel St Detroit, MI | 3.0 | 1.0 | 969 | $1,150 | $1.19 | 45d | 1 | 0.94mi |
| 15387 Lesure St Detroit, MI | 3.0 | 1.0 | 1064 | $1,350 | $1.27 | 13d | 1 | 1.00mi |
| 15517 Lesure St Unit BDRM1A Detroit, MI | 2.0 | 1.0 | 1000 | $850 | $0.85 | 25d | 1 | 1.06mi |
| 16503 Ward Ave Unit 2 Detroit, MI | 2.0 | 1.0 | 700 | $850 | $1.21 | 45d | 1 | 1.07mi |
| 7350 Globe St Detroit, MI | 3.0 | 1.0 | 1000 | $1,550 | $1.55 | 5d | 1 | 1.09mi |
| 14284 Cruse St Detroit, MI | 3.0 | 1.0 | 1121 | $1,150 | $1.03 | 18d | 1 | 1.11mi |
| 14950 Stoepel St Detroit, MI | 2.0 | 1.0 | 600 | $900 | $1.50 | 25d | 1 | 1.13mi |
| 13620 Tuller St Detroit, MI | 4.0 | 1.0 | 1064 | $1,374 | $1.29 | 13d | 1 | 1.14mi |
| 2926 Ewald Cir Detroit, MI | 2.0 | 1.0 | 800 | $900 | $1.12 | 18d | 1 | 1.18mi |
| 2690 Ewald Cir Detroit, MI | 1.0–2.0 | 1.0 | 750 | $900 | $1.20 | 25d | 4 | 1.20mi |
| 15073 Strathmoor St Detroit, MI | 2.0 | 1.0 | 860 | $1,350 | $1.57 | 18d | 1 | 1.28mi |
| 14559 Strathmoor St Detroit, MI | 2.0 | 1.0 | 1033 | $1,150 | $1.11 | 21d | 1 | 1.29mi |
| 12468 Mendota St Detroit, MI | 2.0 | 1.0 | 1100 | $1,100 | $1.00 | 45d | 1 | 1.31mi |
| 12468 Mendota St Detroit, MI | 2.0 | 1.0 | 1100 | $1,000 | $0.91 | 25d | 1 | 1.31mi |
| 17150 Meyers Rd Detroit, MI | 1.0–2.0 | 1.0 | 775 | $975 | $1.26 | 45d | 2 | 1.34mi |
| 16505 Stansbury St Detroit, MI | 3.0 | 1.0 | 1100 | $1,250 | $1.14 | 12d | 1 | 1.35mi |
| 16722 Tuller St Detroit, MI | 3.0 | 1.5 | 1100 | $1,500 | $1.36 | 18d | 1 | 1.37mi |
| 17159 Northlawn St Unit 17161 Detroit, MI | 2.0 | 1.0 | 1122 | $975 | $0.87 | 6d | 1 | 1.39mi |
| 15341 Lauder St Detroit, MI | 4.0 | 1.5 | 1080 | $1,475 | $1.37 | 18d | 1 | 1.49mi |
Listing history 13 events
-
2026-06-21days on market $99,700 Active 14 DOM
-
2026-06-18days on market $99,700 Active 11 DOM
-
2026-06-17days on market $99,700 Active 10 DOM
-
2026-06-16days on market $99,700 Active 9 DOM
-
2026-06-15days on market $99,700 Active 8 DOM
-
2026-06-13days on market $99,700 Active 6 DOM
-
2026-06-13days on market $99,700 Active 5 DOM
-
2026-06-09days on market $99,700 Active 2 DOM
-
2026-06-08statusdays on market $99,700 Active 1 DOM
-
2026-06-07days on market $99,700 Coming Soon 5 DOM
-
2026-06-04days on market $99,700 Coming Soon 2 DOM
-
2026-06-02remarks 567-char remark
-
2026-06-02$99,700 Coming Soon 1 DOM
ⓘ Source: listings_history table (triggers on properties + properties_extension) + one-shot
backfill from property_details.listing_events for pre-trigger history.
Tax reassessment forecast MI · Partial reset (capped growth)
- Current annual tax
- $573 · $48/mo
- Projected year-2 tax
- $1,054 · $88/mo
- Expected delta
- +$481/yr (+$40/mo · 84.1%)
ⓘ Screening estimate from a state-policy table — verify with the county assessor before closing.
Climate risk First Street
- Flood 1/10 Low FEMA zone X (unshaded) · 0% chance over 30 yrs
- Wildfire 1/10 Low
- Heat 2/10 Low 7 d/yr ≥97°F today · 14 d/yr by 30 yrs out
- Wind 2/10 Low
- Air quality 3/10 Moderate 2 unhealthy d/yr today · 5 by 30 yrs out
Nearby sold comps map
Loading sold comps map…
Walkable amenities ~0.75 mi
Loading nearby amenities…
Taxation est. · year 1
- Rental income
- $14,332
- − Mortgage interest
- −$5,585
- − Property taxes
- −$573
- − Insurance
- −$498
- − Repairs & maintenance
- −$1,147
- − Management
- −$1,147
- − Depreciation
- −$2,900
- Taxable income
- $2,482
- Est. tax owed @ 24.0%
- −$596
- After-tax cash flow
- $3,381/yr
For passive investors: Depreciation is non-cash, so a rental often shows a tax loss while cash-flowing — sheltering income. Rental losses are passive: they offset passive income freely, and up to $25,000/yr can offset ordinary (W-2) income if you actively participate and your MAGI is under $100k (phasing out to $0 by $150k); unused losses carry forward. On sale, claimed depreciation is recaptured at up to 25%, and gains may owe capital-gains tax (a 1031 exchange can defer both). Figures are a year-1 estimate at your 24.0% rate — not tax advice; consult a CPA.
Schools (NCES district)
- District
- Detroit Public Schools Community District
- NCES district ID
- 2601103
- Math proficiency
- 10% ▼ -2.00%
- Reading proficiency
- 24% ▲ 6.00%
- Median HH income
- $25,815
- Composite
- 13.06/100
- National rank
- #9564
- State rank
- #499 of 540 in MI
Livability — Detroit
- Score
- 73/100
- State rank
- #218
- US rank
- #5427
Category grades
Schools grade is shown separately in the Schools card above.
Census & demographics
- Census place
- Detroit, MI
- County
- Wayne County · 1,562,939 people
- City population
- 572,865
- Metro
- Detroit-Warren-Dearborn, MI
- Population (ZIP)
- 24,731
- Household income
- $33,315
- Rent vs Own
- Severe rent burden
- 2172.0
Population outlook (Wayne County) Hauer SSP2
- Today (2025)
- 1,675,273 people
- By 2030
- 1,620,300 · -3.3%
- By 2040
- 1,502,341 · -10.3%
- By 2050
- 1,384,039 · -17.4%
- By 2075
- 1,124,592 · -32.9%
- By 2100
- 881,193 · -47.4%
Race, ethnicity, and origin ACS 2023
- Neighborhood character
- Predominantly Black (94%)
- Race & ethnicity
- Black 94% Two or more races 3% White 1%
- Foreign-born
- 1%
Political lean MEDSL · Wayne
- 2024 margin
- Strong D (+29.0) · D 62.7% · R 33.7% · Other 3.6%
- 2008→2024 swing
- -20.5pp toward R · 2008: 49.5pp · 2024: 29.0pp
- All cycles
- 2024: D+29.0 2020: D+38.1 2016: D+37.3 2012: D+46.9 2008: D+49.5
Not yet ingested
- Civics
- —
Market trends
- HPI YoY
- ▼ -31.96%
- Current HPI
- 189.6227
- Rent YoY
- ▲ 6.14%
- Metro
- Detroit-Warren-Dearborn, MI
- State GDP YoY
- ▲ 1.37%
- F500 in state
- 28
Industry mix (Fortune 500 HQ in MI)
| Industry | F500 HQs | Revenue |
|---|---|---|
| Automotive Parts | 3 | $48B |
|
||
| Automotive | 2 | $372B |
|
||
| Chemicals | 1 | $45B |
|
||
| Automotive Retail | 1 | $29B |
|
||
| Healthcare / Medical Devices | 1 | $23B |
|
||
| Automotive Technology | 1 | $20B |
|
||
Price history
+750.1% since first listed22 events — show timeline
- 2026-06-02 Coming Soon $99,700 MiRealSource-MiMLS
- 2026-04-08 Listing Removed — MiRealSource-MiMLS
- 2026-04-07 Listing Removed — REALCOMP
- 2026-04-06 Price Changed $90,000 MiRealSource-MiMLS
- 2026-04-06 Price Changed $90,000 REALCOMP
- 2026-04-06 Price Changed $90,000 SW Michigan MLS
- 2026-03-16 Price Changed $100,000 MiRealSource-MiMLS
- 2026-03-15 Price Changed $100,000 REALCOMP
- 2026-03-15 Price Changed $100,000 SW Michigan MLS
- 2025-12-09 Price Changed $115,000 MiRealSource-MiMLS
- 2025-12-08 Price Changed $115,000 REALCOMP
- 2025-12-08 Price Changed $115,000 SW Michigan MLS
- 2025-11-16 Rental Removed $1,250 SWMMLS
- 2025-11-01 Listed for Rent $1,250 SWMMLS
- 2025-10-11 Listed $125,000 REALCOMP
- 2025-10-10 Listed $125,000 MiRealSource-MiMLS
- 2025-10-01 Listing Removed — MiRealSource-MiMLS
- 2025-10-01 Listing Removed — REALCOMP
- 2025-09-05 Listed $130,000 MiRealSource-MiMLS
- 2025-09-05 Listed $130,000 REALCOMP
- 2025-09-05 Coming Soon — MiRealSource-MiMLS
- 1993-11-10 Sold (Public Records) $11,728 Public Records
Property tax history
+8.2%/yrLatest (2025): $573 · +58.4% YoY. Source: county tax records.
Cash-flow waterfall
monthlySold comps — $/sqft
last 12 mo · ≤1 miLoading sold comps…