 🏷️ Likely Rental
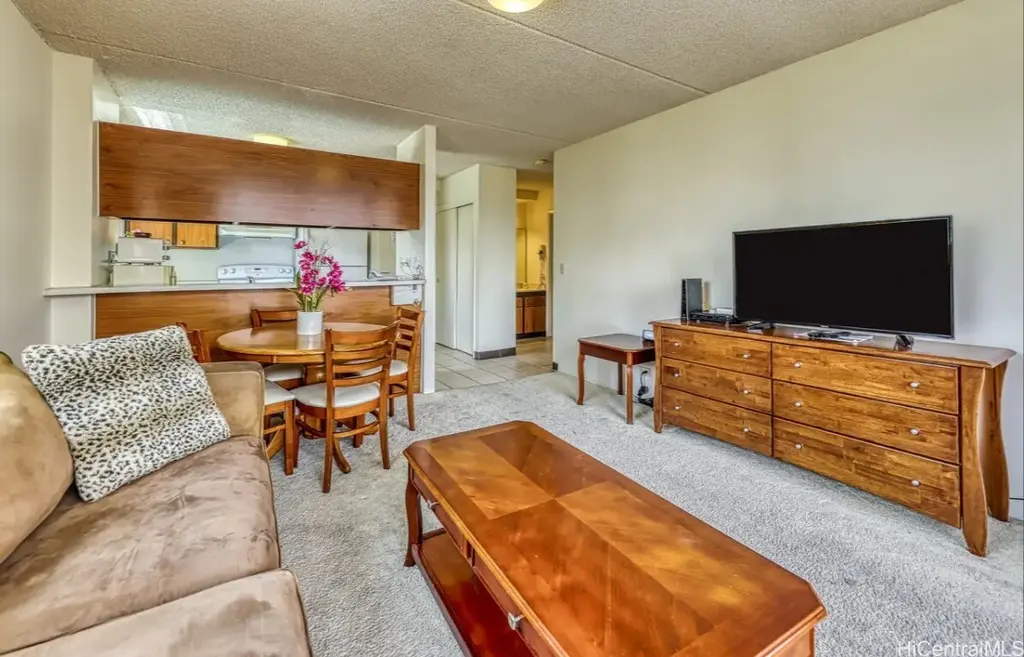
2240 Kuhio Ave #1005 · Urban Honolulu, HI
Flood risk 8/10 · Major
- FEMA flood zone
- AO
- Chance of flooding over 30 yrs
- 0.99%
- Est. flood insurance / yr
- $848 – $2,087
Fire risk No data
- Est. fire insurance / yr
- —
Heat risk No data
- Hot days now (above threshold)
- —
- Hot days in 30 yrs
- —
Wind risk No data
- Chance of severe wind over 30 yrs
- —
Air-quality risk 1/10 · Minimal
- Unhealthy air days now
- —
- Unhealthy air days in 30 yrs
- —
Risk factors via First Street. Map © Google.
Why this score? — see what drove the C+ grade
The composite is a weighted blend of 9 inputs, each scored 0–100. Each bar is that input's sub-score; the figure is the points it added to the 100-point composite (weight × sub-score).
- Cash flow +19.1/30.0
- 1% rule +10.0/10.0
- ARV discount +7.5/15.0
- Appreciation +6.4/10.0
- DSCR +6.0/10.0
- Rent growth +4.0/5.0
- Schools +3.7/10.0
- Livability +2.5/5.0
- Condition / age +2.5/5.0
$155,000
🖨 Deal sheet 📄 Offer letter ✓ Due diligence
Listing remarks MLS
Royal Kuhio #1005 (LARGE CORNER UNIT)– Strong Income Potential in Waikiki Great opportunity to own a cash-flowing unit in the heart of Waikiki. This larger one-bedroom corner unit floor plan is well-maintained, offering immediate income with a tenant in place through June 30, 2026—earn from day one. Sold fully furnished with assigned parking included, making it an ideal turnkey investment or future residence. Centrally located near world-class shopping, dining, beaches, and entertainment. Tenant occupied – minimum 2-day notice to show. Motivated Seller – All reasonable offers will be considered. Sold "As Is". Use TG Escrow-Kahala (Ryan Nagatori).
Key facts
- Centrally located
- Turnkey investment
- Corner unit
Tags
Neighborhood map
What this means for you Summary
Snapshot
- This is a 1-bed/1.0-bath condo listed at $155k.
Deal economics
- At list price, monthly cash flow is $42 ($510/yr) — positive.
- The deal already cash-flows at list — no discount required.
- Meets the 1% rule at list price ($3k rent vs $155k).
- Recommended offer: $146k (6.0% below list) — sets the bar for market timing.
- Cap rate 7.6% vs local median 1.5% in Urban Honolulu — top-decile yield for the area; either an underpriced asset or a hidden risk that comps aren't pricing in. Stress-test before assuming the spread holds.
Location & tenants
- Location reads: area grade C — affects rentability + tenant quality, not the cash-flow math above.
- Hawaii Department Of Education (suburban): math 32% / reading 50% proficiency, ranked #1 of 1 in HI (top 100%) — families likely to look elsewhere, expect single-tenant / working-renter base with shorter leases.
- Market conditions: Rents rising fast (+6.0%/yr); 814 active listings in the ZIP; 40 comparable units currently listed for rent nearby; rentals at typical pace (median 24d on market — plan ~3-4 weeks tenant-placement turnaround); solid renter incomes; 1,638 units permitted in Honolulu County in 2024 (793 in 5+ unit buildings).
- This rent runs 45% of the median local income ($77k/yr) — at the standard rent-burdened threshold; future hikes will face affordability resistance.
Forward outlook
- In year one you build about $5k of equity ($1k loan paydown + $4k appreciation (2.7% local appreciation)).
- Honolulu County population projected at +17% by 2050 — long-run rental-demand tailwind backs the buy-and-hold thesis.
- At projected returns (2.7% appreciation + 6.0% rent growth), your $43k cash investment doubles in ~5 years — after that, you're playing with house money.
- By year 7, paydown + projected appreciation supports a ~$34k cash-out refi (75% LTV) — recoverable capital for the next deal without selling this one.
Negotiation context
- It's been on market 70 days — a 6% lower offer ($146k) is reasonable based on typical stale-listing flexibility.
- 4 sale attempts since 13y ago with the ask held roughly flat each time — persistent listings suggest the price (not the market) is what's stuck; bring a comps-based counter.
Risks & watch-outs
- Watch-outs: flood insurance adds $122/mo; HOA is 39% of rent.
- Climate carrying-cost: in FEMA flood zone AO (mandatory federal flood insurance) — expect insurance premiums to compound above CPI over the hold.
Questions for the listing agent
- It's been on market 70 days. Have you received any prior offers? Is the seller open to a 6% concession, seller financing, or rate buy-down credit?
- Built in 1976 — when were the roof, HVAC, electrical panel, plumbing, and water heater last replaced?
- What's the actual annual flood-insurance premium (NFIP or private), and is the property in a SFHA with mandatory coverage?
- What does the HOA fee cover, when was the last increase, and are there any pending special assessments or reserve-fund shortfalls?
- Any open or pending special assessments — roof, HVAC, plumbing, elevator, façade? What's the per-unit balance and payoff schedule, and is the seller paying it off at close or rolling it to the buyer?
- Why hasn't it sold? Are there any deal-killer items the seller is aware of (foundation, flood, title, zoning, code violations)?
- Is there a deadline driving the sale (1031 exchange, divorce, estate, relocation)? That informs how much negotiation room exists.
- What's the average days-on-market for RENTAL listings here right now (not sales)? A rising rental-DOM trend means longer vacancies and softer asking-rent achievability than the comps imply.
- What's the recent tenant-quality profile in this submarket — average credit score on applications, eviction rate, late-payment / NSF rate, and stable-employment percentage? A property-management company in the area should have these aggregated.
- How much new apartment / multifamily construction is in the pipeline within 1–3 miles? Heavy new supply (>2% of stock underway) typically softens rents 12–24 months out; light construction supports rent growth.
Investment metrics
- 1% rule
- 1.85% ✓
- Cap rate
- 7.57%
- Cash-on-cash
- 4.56%
- DSCR
- 1.20
- GRM
- 4.5
CMA / ARV
- ARV (median comp)
- $351,381
- List price
- $155,000
- Delta
- -55.89%
- Verdict
- UNDERPRICED
- Comps
- 20 within 1.0 mi
Projected returns pro-forma
2.74% appreciation · 6.0% rent growth · sell at horizon
- IRR
- 11.4%
- Equity multiple
- 1.67×
- Total profit
- $28,933
- Equity at exit
- $67,462
- IRR
- 16.8%
- Equity multiple
- 3.71×
- Total profit
- $117,813
- Equity at exit
- $102,262
Cash invested: $43,400 (down + closing). Projections, not guarantees.
Landlord ↔ Tenant lean methodology
- Overall (STATE)
- 37 Tenant-Leaning
- State Hawaii
- 37 Tenant-Leaning · D+13
- County
- — inherits STATE
- City
- — inherits STATE
ZIP-level market 96815
- Home prices YoY
- 0.9%
- Rents YoY
- 6.0%
- Active inventory
- 814
- Price-to-rent
- 4.5×
Monthly cashflow live
- Estimated rent
- $2,864 high interval (Pro) →
- Mortgage (P&I)
- −$813
- Tax from tax record
- −$108 /mo · $1,301/yr
- Insurance
- −$65
- Flood insurance flood zone
- −$122 /mo · $1,468/yr
- HOA
- −$1,112
- Vacancy / Maint / Mgmt
- −$601
- Net cashflow
- $42
Break-even live
UW: 25.0% down · 7.5% · 30yr · 1.5% tax · 5.0% vac · 8.0% maint · 8.0% mgmt
Financing live
Cash to close
- Down payment
- $38,750
- Closing costs
- $4,650
- Reserves months
- —
- Total cash needed
- —
Loan-product check · same deal, 3 products live
Conventional
25% down · 7.5% · 30yr
- Down + closing
- —
- Monthly P&I
- —
- Monthly cashflow
- —
- DSCR
- —
- Eligible?
- —
Personal DTI + credit; lowest rate.
DSCR
20% down · 8.5% · 30yr
- Down + closing
- —
- Monthly P&I
- —
- Monthly cashflow
- —
- DSCR
- —
- Eligible?
- —
No personal income docs; deal must DSCR.
Hard money
10% down · 12.0% · 12mo
- Down + closing
- —
- Monthly P&I
- —
- Monthly cashflow
- —
- DSCR
- —
- Eligible?
- —
Short-term bridge; refi at stabilization.
Rent comps 40 comps
| Address | Beds | Baths | Sqft | Rent | $/sqft | DOM | Units | Dist |
|---|---|---|---|---|---|---|---|---|
| 445 Seaside Ave #2220 Honolulu, HI | 1.0 | 1.0 | 570 | $2,625 | $4.61 | 11d | 1 | 0.09mi |
| 2211 Ala Wai Blvd Honolulu, HI | 1.0 | 1.0 | 437 | $3,100 | $7.09 | 23d | 1 | 0.10mi |
| 2211 Ala Wai Blvd #1108 Honolulu, HI | 1.0 | 1.0 | 413 | $2,600 | $6.30 | 23d | 1 | 0.10mi |
| 2281 Ala Wai Blvd #902 Honolulu, HI | 2.0 | 1.0 | 609 | $3,950 | $6.49 | 14d | 1 | 0.11mi |
| 430 Lewers St Unit 14D Honolulu, HI | 1.0 | 1.0 | 732 | $2,900 | $3.96 | 23d | 1 | 0.12mi |
| 430 Lewers St Unit 25E Honolulu, HI | 1.0 | 1.0 | 673 | $2,700 | $4.01 | 23d | 1 | 0.12mi |
| 445 Kaiolu St Honolulu, HI | 1.0 | 1.0 | 490 | $3,400 | $6.94 | 17d | 1 | 0.15mi |
| 2140 Khi Ave. unit Ph 2506 Honolulu, HI | 1.0 | 1.0 | 678 | $3,200 | $4.72 | 14d | 1 | 0.18mi |
| 2140 Khi Ave Honolulu, HI | 1.0 | 1.0 | 577 | $4,500 | $7.80 | 23d | 1 | 0.18mi |
| 2140 Khi AVE Unit 2006 Honolulu, HI | 1.0 | 1.0 | 553 | $3,400 | $6.15 | 3d | 1 | 0.18mi |
| 2140 Khi AVE Unit 803 Honolulu, HI | — | 1.0 | 460 | $4,990 | $10.85 | 43d | 1 | 0.18mi |
| 2140 Khi AVE Unit 2306 Honolulu, HI | 1.0 | 1.0 | 553 | $2,700 | $4.88 | 17d | 1 | 0.18mi |
| 2121 Ala Wai Blvd Honolulu, HI | 2.0 | 1.0–3.0 | 1006 | $4,150 | $4.12 | 3d | 2 | 0.19mi |
| 2121 Ala Wai Blvd Honolulu, HI | 2.0 | 1.0–3.0 | 1006 | $4,200 | $4.17 | 21d | 2 | 0.19mi |
| 2121 Ala Wai Blvd Honolulu, HI | 2.0 | 1.0–3.0 | 1006 | $4,400 | $4.37 | 10d | 1 | 0.19mi |
| 2345 Ala Wai Blvd #1514 Honolulu, HI | 1.0 | 1.0 | 555 | $2,800 | $5.05 | 23d | 1 | 0.20mi |
| 2380 Kuhio Ave Honolulu, HI | 3.0 | 1.0–3.0 | 1212 | $6,652 | $5.49 | 1d | 51 | 0.25mi |
| 417 Kanekapolei St Honolulu, HI | 1.0 | 1.0 | 566 | $1,695 | $2.99 | 43d | 1 | 0.28mi |
| 232 Kaiulani Ave Honolulu, HI | 3.0 | 1.0 | 656 | $3,088 | $4.71 | 23d | 8 | 0.30mi |
| 440 Olohana St Unit 1327703P Honolulu, HI | 1.0 | 1.0 | 355 | $4,055 | $11.42 | 11d | 1 | 0.32mi |
| 440 Olohana St Unit 1327711P Honolulu, HI | 1.0 | 1.0 | 355 | $3,741 | $10.54 | 2d | 1 | 0.32mi |
| 2407 Tusitala St Unit 304 Honolulu, HI | 1.0 | 1.0 | 480 | $1,500 | $3.12 | 43d | 1 | 0.33mi |
| 2415 Ala Wai Blvd #1802 Honolulu, HI | 1.0 | 1.0 | 560 | $3,000 | $5.36 | 43d | 1 | 0.34mi |
| 2415 Ala Wai Blvd Honolulu, HI | 1.0–2.0 | 1.0 | 665 | $2,750 | $4.13 | 17d | 3 | 0.34mi |
| 2410 Cleghorn St #2403 Honolulu, HI | 1.0 | 1.0 | 602 | $2,500 | $4.15 | 23d | 1 | 0.34mi |
| 223 Saratoga Rd #1012 Honolulu, HI | — | 1.0 | 559 | $2,700 | $4.83 | 17d | 1 | 0.34mi |
| 2423 Cleghorn St #204 Honolulu, HI | 2.0 | 1.0 | 600 | $1,595 | $2.66 | 23d | 1 | 0.36mi |
| 2421 Tusitala St #902 Honolulu, HI | 2.0 | 1.0 | 590 | $2,775 | $4.70 | 11d | 1 | 0.37mi |
| 2421 Tusitala St Honolulu, HI | 1.0–2.0 | 1.0 | 590 | $2,600 | $4.41 | 43d | 2 | 0.37mi |
| 2440 Khi Ave Unit 1608 Honolulu, HI | 1.0 | 1.0 | 488 | $2,800 | $5.74 | 43d | 1 | 0.38mi |
| 2045 Kalakaua Ave Honolulu, HI | 1.0 | 1.0 | 657 | $4,200 | $6.39 | 43d | 1 | 0.38mi |
| 2440 Khi AVE Unit 1412 Honolulu, HI | 1.0 | 1.0 | 536 | $2,700 | $5.04 | 44d | 1 | 0.39mi |
| 2440 Khi AVE Unit 507 Honolulu, HI | 1.0 | 1.0 | 488 | $2,350 | $4.82 | 43d | 1 | 0.39mi |
| 2440 Khi AVE Unit 1710 Honolulu, HI | 1.0 | 1.0 | 488 | $2,600 | $5.33 | 17d | 1 | 0.39mi |
| 2440 Khi AVE Unit 511 Honolulu, HI | 1.0 | 1.0 | 488 | $2,400 | $4.92 | 43d | 1 | 0.39mi |
| 2440 Khi AVE Unit 601 Honolulu, HI | 1.0 | 1.0 | 537 | $2,200 | $4.10 | 3d | 1 | 0.39mi |
| 2440 Khi AVE Unit 601 Honolulu, HI | 1.0 | 1.0 | 537 | $2,200 | $4.10 | 23d | 1 | 0.39mi |
| 2440 Khi AVE Unit 511 Honolulu, HI | 1.0 | 1.0 | 488 | $2,400 | $4.92 | 23d | 1 | 0.39mi |
| 500 University Ave Honolulu, HI | 1.0–2.0 | 1.0–2.5 | 826 | $2,650 | $3.21 | 11d | 3 | 0.40mi |
| 555 University Ave Honolulu, HI | 1.0 | 1.0 | 684 | $2,850 | $4.17 | 3d | 2 | 0.41mi |
HOA detail condo
- Monthly dues
- $1,112 · $13,344/yr
- Likely covers
- parking
- Assessments
- None detected in remarks — confirm with the listing agent.
Listing history 24 events
-
2026-06-18days on market $155,000 Active 70 DOM
-
2026-06-17days on market $155,000 Active 69 DOM
-
2026-06-16days on market $155,000 Active 68 DOM
-
2026-06-15days on market $155,000 Active 67 DOM
-
2026-06-13days on market $155,000 Active 65 DOM
-
2026-06-13days on market $155,000 Active 64 DOM
-
2026-06-10days on market $155,000 Active 62 DOM
-
2026-06-09days on market $155,000 Active 61 DOM
-
2026-06-08days on market $155,000 Active 60 DOM
-
2026-06-07days on market $155,000 Active 59 DOM
-
2026-06-05days on market $155,000 Active 56 DOM
-
2026-06-03days on market $155,000 Active 55 DOM
-
2026-06-02days on market $155,000 Active 54 DOM
-
2026-06-01days on market $155,000 Active 53 DOM
-
2026-05-31days on market $155,000 Active 52 DOM
-
2026-04-03$155,000 Active 691-char remark
Show marketing remark (691 chars)
Royal Kuhio #1005 (LARGE CORNER UNIT)– Strong Income Potential in Waikiki Great opportunity to own a cash-flowing unit in the heart of Waikiki. This larger one-bedroom corner unit floor plan is well-maintained, offering immediate income with a tenant in place through June 30, 2026—earn from day one. Sold fully furnished with assigned parking included, making it an ideal turnkey investment or future residence. Centrally located near world-class shopping, dining, beaches, and entertainment. Tenant occupied – minimum 2-day notice to show. Motivated Seller – All reasonable offers will be considered. Sold "As Is". Use TG Escrow-Kahala (Ryan Nagatori).
-
2022-10-17$175,000 Active
-
2022-06-03historical
-
2022-05-03$175,000
-
2013-06-04soldstatus $180,000
-
2013-06-04soldstatus $180,000
-
2013-05-02$190,000
-
1987-10-01soldstatus $113,500
-
1987-04-01soldstatus $100,000
ⓘ Source: listings_history table (triggers on properties + properties_extension) + one-shot
backfill from property_details.listing_events for pre-trigger history.
Tax reassessment forecast HI · Partial reset (capped growth)
- Current annual tax
- $1,301 · $108/mo
- Projected year-2 tax
- $1,301 · $108/mo
- Expected delta
- $0/yr ($0/mo · 0.0%)
ⓘ Screening estimate from a state-policy table — verify with the county assessor before closing.
Climate risk First Street
- Flood 8/10 Severe FEMA zone AO · 99% chance over 30 yrs
- Air quality 1/10 Low
Nearby sold comps map
Loading sold comps map…
Walkable amenities ~0.75 mi
Loading nearby amenities…
Taxation est. · year 1
- Rental income
- $34,368
- − Mortgage interest
- −$8,682
- − Property taxes
- −$1,301
- − Insurance
- −$2,242
- − Repairs & maintenance
- −$2,749
- − Management
- −$2,749
- − HOA
- −$13,344
- − Depreciation
- −$4,509
- Taxable loss
- −$1,209
- Est. tax savings @ 24.0%
- +$290
- After-tax cash flow
- $800/yr
For passive investors: Depreciation is non-cash, so a rental often shows a tax loss while cash-flowing — sheltering income. Rental losses are passive: they offset passive income freely, and up to $25,000/yr can offset ordinary (W-2) income if you actively participate and your MAGI is under $100k (phasing out to $0 by $150k); unused losses carry forward. On sale, claimed depreciation is recaptured at up to 25%, and gains may owe capital-gains tax (a 1031 exchange can defer both). Figures are a year-1 estimate at your 24.0% rate — not tax advice; consult a CPA.
Schools (NCES district)
- District
- Hawaii Department Of Education
- NCES district ID
- 1500030
- Math proficiency
- 32% ▼ -10.00%
- Reading proficiency
- 50% ▼ -3.00%
- Median HH income
- $69,005
- Composite
- 37.07/100
- National rank
- #4504
- State rank
- #1 of 1 in HI
Livability — Urban Honolulu
No livability data for this city. (Only ~50 U.S. cities are tracked.)
Census & demographics
- Census place
- Urban Honolulu, HI
- County
- Honolulu County · 963,448 people
- City population
- 309,956
- Metro
- Urban Honolulu, HI
- Population (ZIP)
- 27,530
- Household income
- $77,096
- Rent vs Own
- Severe rent burden
- 2422.0
Population outlook (Honolulu County) Hauer SSP2
- Today (2025)
- 1,072,641 people
- By 2030
- 1,110,460 · +3.5%
- By 2040
- 1,181,593 · +10.2%
- By 2050
- 1,257,584 · +17.2%
- By 2075
- 1,501,120 · +39.9%
- By 2100
- 1,764,430 · +64.5%
Race, ethnicity, and origin ACS 2023
- Neighborhood character
- Highly diverse neighborhood (Simpson 0.71)
- Race & ethnicity
- Asian 41% White 35% Two or more races 16% Hispanic / Latino 6% Pacific Islander 4% Black 2%
- Hispanic origin (detail)
- Mexican 3% Puerto Rican 1%
- Common ancestry
- Romanian 2% Lithuanian 2% Slovak 2%
- Foreign-born
- 30% · China, South Korea, Canada
- Languages at home
- 66% English-only · Other Asian/Pacific 15% Chinese 5% Korean 3%
Political lean MEDSL · Honolulu
- 2024 margin
- Strong D (+21.6) · D 59.9% · R 38.3% · Other 1.8%
- 2008→2024 swing
- -19.4pp toward R · 2008: 41.1pp · 2024: 21.6pp
- All cycles
- 2024: D+21.6 2020: D+26.9 2016: D+29.9 2012: D+39.1 2008: D+41.1
Not yet ingested
- Civics
- —
Market trends
- HPI YoY
- ▲ 2.74%
- Current HPI
- 291.9404
- Rent YoY
- ▲ 6.00%
- Metro
- Urban Honolulu, HI
- State GDP YoY
- —
- F500 in state
- 0
Price history
+55.0% since first listed9 events — show timeline
- 2026-04-03 Listed $155,000 HiCentral MLS
- 2022-10-17 Listed $175,000 HiCentral MLS
- 2022-06-03 Listing Removed — HiCentral MLS
- 2022-05-03 Listed $175,000 HiCentral MLS
- 2013-06-04 Sold (Public Records) $180,000 Public Records
- 2013-06-04 Sold (MLS) $180,000 HiCentral MLS
- 2013-05-02 Listed $190,000 HiCentral MLS
- 1987-10-01 Sold (Public Records) $113,500 Public Records
- 1987-04-01 Sold (Public Records) $100,000 Public Records
Property tax history
+2.0%/yrLatest (2022): $1,301 · -2.9% YoY. Source: county tax records.
Cash-flow waterfall
monthlySold comps — $/sqft
last 12 mo · ≤1 miLoading sold comps…