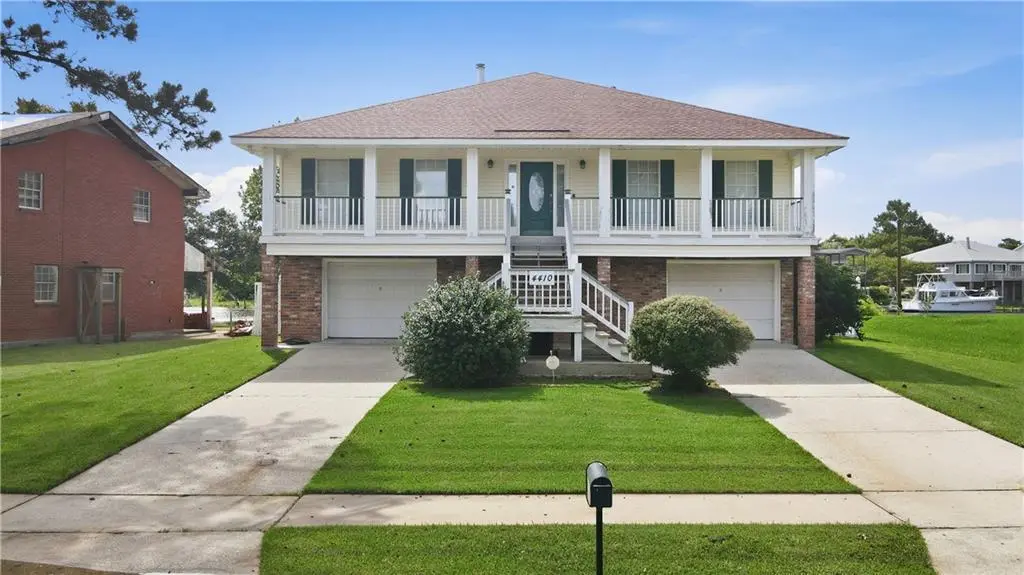
4410 Alba Rd · New Orleans, LA
Flood risk 10/10 · Severe
- FEMA flood zone
- AE
- Chance of flooding over 30 yrs
- 0.99%
- Est. flood insurance / yr
- $1,737 – $8,500
Fire risk 4/10 · Minor
- Est. fire insurance / yr
- $1,269 – $2,357
Heat risk 10/10 · Severe
- Hot days now (above 108°F)
- 7 days/yr
- Hot days in 30 yrs
- 22 days/yr
Wind risk 10/10 · Severe
- Chance of severe wind over 30 yrs
- 99.0%
Air-quality risk 2/10 · Minimal
- Unhealthy air days now
- 0 days/yr
- Unhealthy air days in 30 yrs
- 1 days/yr
Risk factors via First Street. Map © Google.
Why this score? — see what drove the C+ grade
The composite is a weighted blend of 9 inputs, each scored 0–100. Each bar is that input's sub-score; the figure is the points it added to the 100-point composite (weight × sub-score).
- Cash flow +30.0/30.0
- DSCR +10.0/10.0
- 1% rule +8.2/10.0
- ARV discount +6.1/15.0
- Livability +4.0/5.0
- Rent growth +2.5/5.0
- Condition / age +2.5/5.0
- Schools +1.6/10.0
- Appreciation +0.0/10.0
$234,900
🖨 Deal sheet 📄 Offer letter ✓ Due diligence
Listing remarks MLS
Waterfront living with loads of potential! Located in Venetian Isles, this canal-front property offers convenient access to nearby waterways and the lake. This well-maintained and exceptionally clean home has been lovingly preserved over the years and is ready for its next owner. Downstairs is built for the Louisiana lifestyle, featuring a spacious entertaining and fish-cleaning area perfect for cooking, gatherings, storage, and enjoying time outdoors, plus a convenient bathroom below. The property also includes a boat lift, elevator access, and a concrete koi/goldfish pond, adding even more possibilities for waterfront enjoyment. Upstairs, you'll find the main living area along with a convenient office/laundry room. The expansive garage and storage area provides plenty of room for vehicles, boats, fishing gear, tools, and all your waterfront essentials. While the home offers an excellent opportunity for cosmetic updates, it has been very well cared for and preserved, providing a solid foundation for your vision. Be sure to view the virtually staged photos to see just how incredible this property's potential can be. With a nearby public boat launch and quick access to surrounding waterways and the lake, boating and fishing adventures are always within reach. Whether you're looking for a primary residence, weekend retreat, fishing camp, or investment opportunity, this waterfront property is ready for its next chapter.
Key facts
- Boat lift
- Canal-front property
- Fish-cleaning area
Tags
Property features AI
Finance
- Other: Outside city limits; Rectangular lot; Lot dimensions approximately 60 x 187; Lot size about 0.2865 acres; Average condition
Exterior
- Parking: Garage; Three or more parking spaces
- Utilities: Public water; Public sewer
- Home design: Single-story; Brick construction; Raised foundation; Shingle roof
- Construction: Built with brick
- Exterior features: Balcony; Porch; Fence; Waterfront
Interior
- Kitchen: Cooktop; Oven; Range; Microwave; Dishwasher; Refrigerator
- Bedrooms: 12 total rooms (including bedrooms)
- Bathrooms: 2 full bathrooms; 1 half bathroom
- Heating & cooling: Has heating; Has cooling
- Interior features: Ceiling fan(s); Elevator; Pantry
- Laundry & utility: Washer hookup; Dryer hookup; Washer; Dryer
Neighborhood map
What this means for you Summary
Snapshot
- This is a 3-bed/2.0-bath single-family listed at $235k.
Deal economics
- At list price, monthly cash flow is $464 ($6k/yr) — positive.
- The deal already cash-flows at list — no discount required.
- Meets the 1% rule at list price ($3k rent vs $235k).
- Cap rate 10.8% vs local median 4.4% in New Orleans — top-decile yield for the area; either an underpriced asset or a hidden risk that comps aren't pricing in. Stress-test before assuming the spread holds.
Location & tenants
- Location reads 81/100 on livability (#3 in LA, #1,383 nationally) — a professional / high-income tenant draw. Strengths: amenities A+, commute A+, health & safety A+; Watch: crime C-, employment D.
- Orleans Parish (urban): math 11% / reading 27% proficiency, ranked #69 of 98 in LA (top 70%) — low school quality limits family demand, transient renter base, plan for 1-2y turnover; 68% free/reduced lunch — lower-income household profile, screen leases tightly.
- Market conditions: 139 active listings in the ZIP; 1 comparable units currently listed for rent nearby; 710 units permitted in Orleans Parish in 2024 (244 in 5+ unit buildings).
Forward outlook
- Local home prices are declining (-3.0%/yr); year-one equity from $2k of loan paydown is wiped out by about $7k of value loss. Plan a longer hold.
- Orleans County population projected at +61% by 2050 — long-run rental-demand tailwind backs the buy-and-hold thesis.
Negotiation context
- Only 9 days on market — expect competitive offers; lowballing is unlikely to land.
- 2 sale attempts with the ask held roughly flat each time — persistent listings suggest the price (not the market) is what's stuck; bring a comps-based counter.
- Current owner paid $200k; 17% above their basis — modest negotiation headroom, anchor on the comps not their cost.
Risks & watch-outs
- Watch-outs: flood insurance adds $427/mo.
- Climate carrying-cost: in FEMA flood zone AE (mandatory federal flood insurance); severe wind risk, 99% chance of damaging wind over 30y; extreme-heat days projected 7→22/yr by 2055 (HVAC capex compounding) — expect insurance premiums to compound above CPI over the hold.
Questions for the listing agent
- What's the actual annual flood-insurance premium (NFIP or private), and is the property in a SFHA with mandatory coverage?
- Is there a deadline driving the sale (1031 exchange, divorce, estate, relocation)? That informs how much negotiation room exists.
- What's the average days-on-market for RENTAL listings here right now (not sales)? A rising rental-DOM trend means longer vacancies and softer asking-rent achievability than the comps imply.
- What's the recent tenant-quality profile in this submarket — average credit score on applications, eviction rate, late-payment / NSF rate, and stable-employment percentage? A property-management company in the area should have these aggregated.
- How much new for-sale + rental construction is in the pipeline within 1–3 miles? Heavy new supply typically softens prices + rents 12–24 months out; constrained supply supports both.
Investment metrics
- 1% rule
- 1.32% ✓
- Cap rate
- 10.84%
- Cash-on-cash
- 16.25%
- DSCR
- 1.72
- GRM
- 6.3
CMA / ARV
- ARV (on-the-fly)
- $228,000
- Comps found
- 3
Show comp detail 3 sales within ~0.75 mi
| Address | Dist | Beds/Ba | Sqft | Sold | Price | $/sf | Match |
|---|---|---|---|---|---|---|---|
| 20637 Old Spanish Trl | 0.20mi | 3/2.5 | 2,228 (-2%) | 2mo | $101,000 | $45 | 83 |
| 4250 Murano Rd | 0.12mi | 3/3.0 | 2,400 (+5%) | 2mo | $370,000 | $154 | 80 |
| 4500 Murano Rd | 0.12mi | 4/2.0 (+1) | 2,450 (+8%) | 23mo | $245,000 | $100 | 58 |
Match score weights: distance 35% · size 25% · config 20% · recency 20%. Top-matched comps best support the ARV.
Projected returns pro-forma
-3.0% appreciation · 3.0% rent growth · sell at horizon
- IRR
- -3.3%
- Equity multiple
- 0.87×
- Total profit
- $-8,247
- Equity at exit
- $35,024
- IRR
- 6.5%
- Equity multiple
- 1.49×
- Total profit
- $31,960
- Equity at exit
- $20,310
Cash invested: $65,772 (down + closing). Projections, not guarantees.
Landlord ↔ Tenant lean methodology
- Overall (STATE)
- 90 Strongly Landlord-Friendly
- State Louisiana
- 90 Strongly Landlord-Friendly · R+12
- County
- — inherits STATE
- City
- — inherits STATE
ZIP-level market 70129
- Active inventory
- 139
- Price-to-rent
- 6.3×
Monthly cashflow live
- Estimated rent
- $3,100 medium interval (Pro) →
- Mortgage (P&I)
- −$1,232
- Tax from tax record
- −$229 /mo · $2,746/yr
- Insurance
- −$98
- Flood insurance flood zone
- −$427 /mo · $5,118/yr
- HOA
- −$0
- Vacancy / Maint / Mgmt
- −$651
- Net cashflow
- $464
Break-even live
UW: 25.0% down · 7.5% · 30yr · 1.5% tax · 5.0% vac · 8.0% maint · 8.0% mgmt
Financing live
Cash to close
- Down payment
- $58,725
- Closing costs
- $7,047
- Reserves months
- —
- Total cash needed
- —
Loan-product check · same deal, 3 products live
Conventional
25% down · 7.5% · 30yr
- Down + closing
- —
- Monthly P&I
- —
- Monthly cashflow
- —
- DSCR
- —
- Eligible?
- —
Personal DTI + credit; lowest rate.
DSCR
20% down · 8.5% · 30yr
- Down + closing
- —
- Monthly P&I
- —
- Monthly cashflow
- —
- DSCR
- —
- Eligible?
- —
No personal income docs; deal must DSCR.
Hard money
10% down · 12.0% · 12mo
- Down + closing
- —
- Monthly P&I
- —
- Monthly cashflow
- —
- DSCR
- —
- Eligible?
- —
Short-term bridge; refi at stabilization.
Rent comps 1 comps
| Address | Beds | Baths | Sqft | Rent | $/sqft | DOM | Units | Dist |
|---|---|---|---|---|---|---|---|---|
| 4327 Genoa Rd New Orleans, LA | 4.0 | 3.0 | 2915 | $3,100 | $1.06 | 1d | 1 | 0.18mi |
Listing history 7 events
-
2026-06-18days on market $234,900 Active 9 DOM
-
2026-06-17days on market $234,900 Active 8 DOM
-
2026-06-16days on market $234,900 Active 7 DOM
-
2026-06-15days on market $234,900 Active 6 DOM
-
2026-06-13days on market $234,900 Active 4 DOM
-
2026-06-10remarks 699-char remark
-
2026-06-10$234,900 Active 1 DOM
ⓘ Source: listings_history table (triggers on properties + properties_extension) + one-shot
backfill from property_details.listing_events for pre-trigger history.
Tax reassessment forecast LA · Resets to sale price
- Current annual tax
- $2,746 · $229/mo
- Projected year-2 tax
- $2,746 · $229/mo
- Expected delta
- $0/yr ($0/mo · 0.0%)
ⓘ Screening estimate from a state-policy table — verify with the county assessor before closing.
Climate risk First Street
- Flood 10/10 Extreme FEMA zone AE · 99% chance over 30 yrs
- Wildfire 4/10 Moderate
- Heat 10/10 Extreme 7 d/yr ≥108°F today · 22 d/yr by 30 yrs out
- Wind 10/10 Extreme 99% chance of damaging wind over 30 yrs
- Air quality 2/10 Low 0 unhealthy d/yr today · 1 by 30 yrs out
Nearby sold comps map
Loading sold comps map…
Walkable amenities ~0.75 mi
Loading nearby amenities…
Taxation est. · year 1
- Rental income
- $37,200
- − Mortgage interest
- −$13,158
- − Property taxes
- −$2,746
- − Insurance
- −$6,293
- − Repairs & maintenance
- −$2,976
- − Management
- −$2,976
- − Depreciation
- −$6,833
- Taxable income
- $2,218
- Est. tax owed @ 24.0%
- −$532
- After-tax cash flow
- $5,035/yr
For passive investors: Depreciation is non-cash, so a rental often shows a tax loss while cash-flowing — sheltering income. Rental losses are passive: they offset passive income freely, and up to $25,000/yr can offset ordinary (W-2) income if you actively participate and your MAGI is under $100k (phasing out to $0 by $150k); unused losses carry forward. On sale, claimed depreciation is recaptured at up to 25%, and gains may owe capital-gains tax (a 1031 exchange can defer both). Figures are a year-1 estimate at your 24.0% rate — not tax advice; consult a CPA.
Schools (NCES district)
- District
- Orleans Parish
- NCES district ID
- 2201170
- Math proficiency
- 11% ▼ -52.00%
- Reading proficiency
- 27% ▼ -46.00%
- Median HH income
- $37,011
- Composite
- 15.78/100
- National rank
- #9271
- State rank
- #69 of 98 in LA
Livability — New Orleans
- Score
- 81/100
- State rank
- #3
- US rank
- #1383
Category grades
Schools grade is shown separately in the Schools card above.
Census & demographics
- Census place
- New Orleans, LA
- City population
- 338,817
- Population (ZIP)
- 10,219
Population outlook (Orleans County) Hauer SSP2
- Today (2025)
- 513,025 people
- By 2030
- 575,781 · +12.2%
- By 2040
- 700,174 · +36.5%
- By 2050
- 826,541 · +61.1%
- By 2075
- 1,123,374 · +119.0%
- By 2100
- 1,355,609 · +164.2%
Race, ethnicity, and origin ACS 2023
- Neighborhood character
- Diverse neighborhood (Simpson 0.65)
- Race & ethnicity
- Black 49% Asian 29% Hispanic / Latino 12% White 8% Two or more races 2%
- Hispanic origin (detail)
- Mexican 2%
- Common ancestry
- Lithuanian 1%
- Foreign-born
- 32% · Vietnam, Canada, Jamaica
- Languages at home
- 63% English-only · Vietnamese 29% Spanish 8%
Political lean MEDSL · Orleans
- 2024 margin
- Solid D (+67.0) · D 82.2% · R 15.2% · Other 2.7%
- 2008→2024 swing
- +6.7pp toward D · 2008: 60.3pp · 2024: 67.0pp
- All cycles
- 2024: D+67.0 2020: D+68.2 2016: D+66.2 2012: D+62.5 2008: D+60.3
Not yet ingested
- Civics
- —
Market trends
- HPI YoY
- ▼ -80.58%
- Current HPI
- 116.8578
- Rent YoY
- —
- Metro
- —
- State GDP YoY
- ▲ 3.29%
- F500 in state
- 10
Industry mix (Fortune 500 HQ in LA)
| Industry | F500 HQs | Revenue |
|---|---|---|
| Telecommunications | 2 | $23B |
|
||
| Utilities | 1 | $12B |
|
||
| Wholesale / Distribution | 1 | $5B |
|
||
| Advertising | 1 | $2B |
|
||
Price history
+683.0% since first listed5 events — show timeline
- 2026-06-09 Listed $234,900 AcadianaMLS
- 2026-06-09 Listed $234,900 GSREIN
- 2022-09-06 Sold (Public Records) $200,000 Public Records
- 1999-04-30 Sold (Public Records) $170,000 Public Records
- 1984-12-27 Sold (Public Records) $30,000 Public Records
Property tax history
+6.4%/yrLatest (2026): $2,746 · +1.1% YoY. Source: county tax records.
Cash-flow waterfall
monthlySold comps — $/sqft
last 12 mo · ≤1 miLoading sold comps…