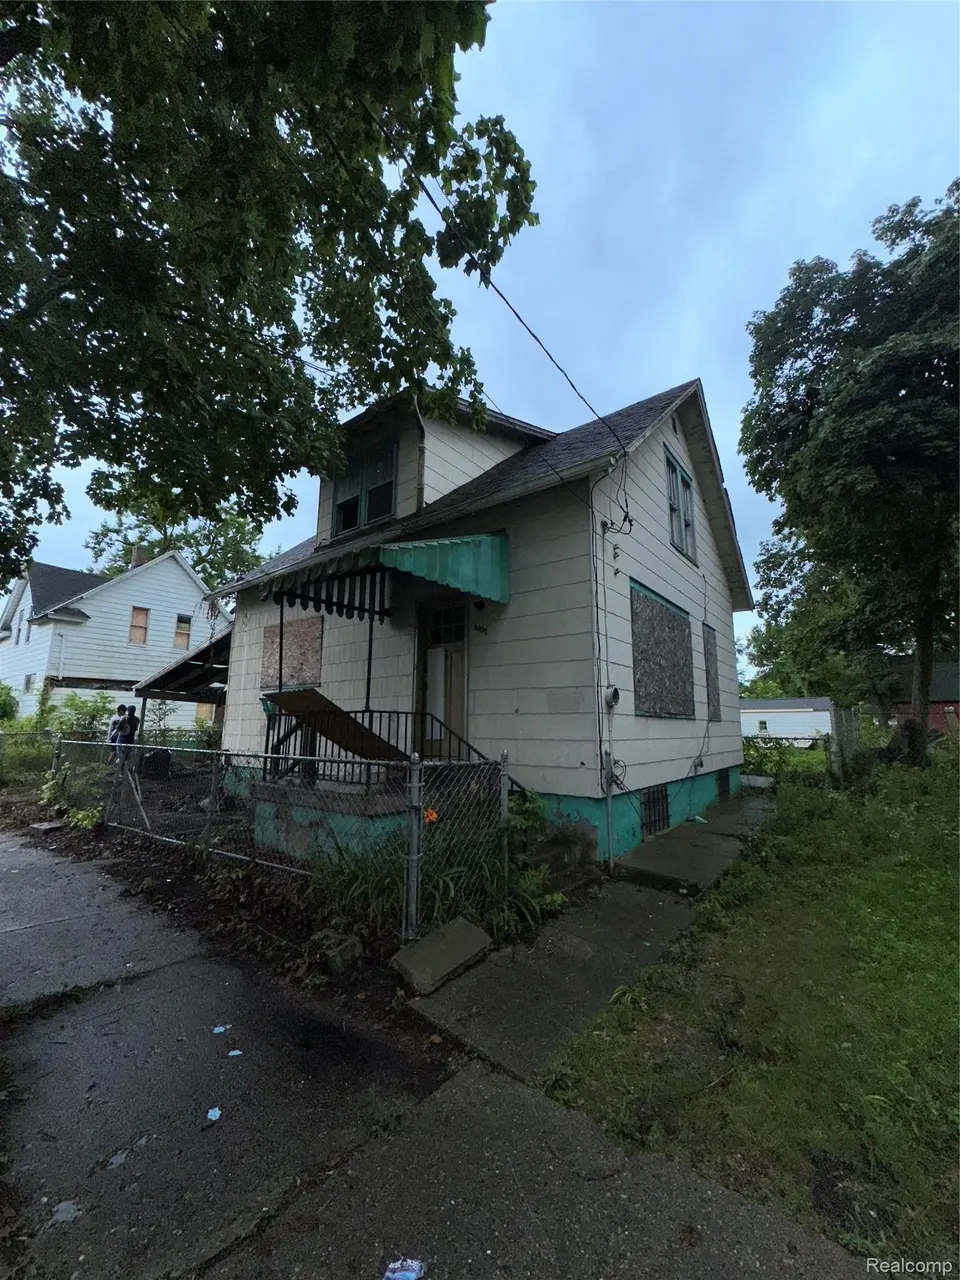
1007 Decker St · Flint, MI
Flood risk 1/10 · Minimal
- FEMA flood zone
- X (unshaded)
- Chance of flooding over 30 yrs
- 0.0%
- Est. flood insurance / yr
- $507 – $1,088
Fire risk 1/10 · Minimal
- Est. fire insurance / yr
- $784 – $1,456
Heat risk 2/10 · Minimal
- Hot days now (above 96°F)
- 7 days/yr
- Hot days in 30 yrs
- 15 days/yr
Wind risk 2/10 · Minimal
- Chance of severe wind over 30 yrs
- —
Air-quality risk 3/10 · Minor
- Unhealthy air days now
- 3 days/yr
- Unhealthy air days in 30 yrs
- 4 days/yr
Risk factors via First Street. Map © Google.
Why this score? — see what drove the D grade
The composite is a weighted blend of 9 inputs, each scored 0–100. Each bar is that input's sub-score; the figure is the points it added to the 100-point composite (weight × sub-score).
- Cash flow +15.0/30.0
- ARV discount +7.5/15.0
- 1% rule +5.0/10.0
- DSCR +5.0/10.0
- Rent growth +5.0/5.0
- Livability +3.7/5.0
- Condition / age +2.5/5.0
- Schools +1.1/10.0
- Appreciation +0.0/10.0
$9,900
🖨 Deal sheet 📄 Offer letter ✓ Due diligence
Listing remarks MLS
Investor special! Great opportunity to add value and maximize returns. Ideal for rehab or rental portfolio.
Key facts
- 1,742 sq ft lot
- Built 1905
- Listed 48 days
Property features AI
Exterior
- Parking: No garage
- Utilities: Public water; Public sewer
- Home design: Single-family residence; One story; Ground-level entry with steps
- Construction: Built with other construction materials; Block foundation
- Exterior features: Paved road access; Lot approximately 0.04 acres (55 x 33)
Interior
- Bedrooms: Total of 3 rooms (includes bedrooms and living spaces)
- Bathrooms: 1 full bathroom
- Heating & cooling: Forced air heating (natural gas); No central cooling
- Interior features: Finished living area on one level; Unfinished basement
Neighborhood map
What this means for you Summary
Snapshot
- This is a 2-bed/1.0-bath single-family listed at $10k.
Deal economics
- At list price, monthly cash flow is $670 ($8k/yr) — positive.
- The deal already cash-flows at list — no discount required.
- Meets the 1% rule at list price ($934 rent vs $10k).
- Recommended offer: $10k (3.0% below list) — sets the bar for market timing.
- Cap rate 87.5% vs local median 11.5% in Flint — top-decile yield for the area; either an underpriced asset or a hidden risk that comps aren't pricing in. Stress-test before assuming the spread holds.
Location & tenants
- Location reads 74/100 on livability (#196 in MI, #4,946 nationally) — a middle-class / working-renter tenant base. Strengths: commute A+, cost of living A+, housing A+; Watch: schools F, crime F, employment F.
- Flint School District (urban): math 7% / reading 13% proficiency, ranked #714 of 760 in MI (top 94%) — low school quality limits family demand, transient renter base, plan for 1-2y turnover; 83% free/reduced lunch — lower-income household profile, screen leases tightly.
- Market conditions: Rents rising fast (+12.3%/yr); 135 active listings in the ZIP; 5 comparable units currently listed for rent nearby; rentals leasing fast (median 14d on market — plan ~1-2 weeks tenant-placement turnaround); lower-income renter base — watch delinquency; 419 units permitted in Genesee County in 2024 (68 in 5+ unit buildings).
Forward outlook
- Local home prices are declining (-3.0%/yr); year-one equity from $68 of loan paydown is wiped out by about $297 of value loss. Plan a longer hold.
- Genesee County population projected at -27% by 2050 — secular population decline; favor cash flow + early exit over multi-decade hold.
- At projected returns (-3.0% appreciation + 8.0% rent growth), your $3k cash investment doubles in ~1 year — after that, you're playing with house money.
Negotiation context
- It's been on market 48 days — a 3% lower offer ($10k) is reasonable based on typical stale-listing flexibility.
- 2 sale attempts; this cycle's ask has dropped $2k (18%) from the opening price — seller is motivated, your offer sets the floor, not the list.
Risks & watch-outs
- Watch-outs: built in 1905 — expect roof / HVAC / electrical / plumbing capex.
Questions for the listing agent
- It's been on market 48 days. Have you received any prior offers? Is the seller open to a 3% concession, seller financing, or rate buy-down credit?
- Built in 1905 — when were the roof, HVAC, electrical panel, plumbing, and water heater last replaced?
- Is there a deadline driving the sale (1031 exchange, divorce, estate, relocation)? That informs how much negotiation room exists.
- Schools are F-rated, which usually means shorter tenancies and higher turnover. Who's the typical renter profile here, and what's been the actual vacancy rate?
- Crime grade is F in this area — have there been break-ins, vandalism, or insurance claims at this property in the last 3 years? What carrier currently insures it and at what premium?
- The area grade is low — what's the realistic commute time and amenity access for the typical tenant pool here? Any planned neighborhood developments (good or bad) we should know about?
- What's the average days-on-market for RENTAL listings here right now (not sales)? A rising rental-DOM trend means longer vacancies and softer asking-rent achievability than the comps imply.
- What's the recent tenant-quality profile in this submarket — average credit score on applications, eviction rate, late-payment / NSF rate, and stable-employment percentage? A property-management company in the area should have these aggregated.
- How much new for-sale + rental construction is in the pipeline within 1–3 miles? Heavy new supply typically softens prices + rents 12–24 months out; constrained supply supports both.
Investment metrics
- 1% rule
- 9.44% ✓
- Cap rate
- 87.47%
- Cash-on-cash
- 289.90%
- DSCR
- 13.90
- GRM
- 0.9
CMA / ARV
- ARV (on-the-fly)
- $23,760
- Comps found
- 12
Show comp detail 12 sales within ~0.75 mi
| Address | Dist | Beds/Ba | Sqft | Sold | Price | $/sf | Match |
|---|---|---|---|---|---|---|---|
| 1644 Pennsylvania Ave | 0.36mi | 2/1.0 | 839 (+6%) | 6mo | $43,000 | $51 | 68 |
| 1629 Ohio Ave | 0.37mi | 2/1.0 | 792 (0%) | 18mo | $20,000 | $25 | 68 |
| 1612 Iowa Ave | 0.38mi | 3/1.0 (+1) | 770 (-3%) | 7mo | $42,000 | $55 | 67 |
| 1742 Kentucky Ave | 0.45mi | 2/1.0 | 832 (+5%) | 14mo | $21,000 | $25 | 59 |
| 1220 Minnesota Ave | 0.38mi | 2/1.0 | 884 (+12%) | 7mo | $26,500 | $30 | 57 |
| 1818 Kansas Ave | 0.49mi | 2/1.5 | 858 (+8%) | 9mo | $14,000 | $16 | 54 |
| 1710 Indiana Ave | 0.51mi | 3/1.0 (+1) | 840 (+6%) | 10mo | $7,000 | $8 | 53 |
| 1401 Maplewood Ave | 0.56mi | 2/1.0 | 724 (-9%) | 16mo | $24,500 | $34 | 46 |
| 1421 Jane Ave | 0.72mi | 3/1.0 (+1) | 768 (-3%) | 14mo | $24,000 | $31 | 44 |
| 306 Lafayette St | 0.56mi | 2/1.0 | 900 (+14%) | 9mo | $100,000 | $111 | 44 |
| 2209 Kansas Ave | 0.70mi | 2/1.0 | 864 (+9%) | 12mo | $19,900 | $23 | 42 |
| 2301 Kansas Ave | 0.73mi | 3/1.0 (+1) | 900 (+14%) | 10mo | $4,900 | $5 | 30 |
Match score weights: distance 35% · size 25% · config 20% · recency 20%. Top-matched comps best support the ARV.
Projected returns pro-forma
-3.0% appreciation · 8.0% rent growth · sell at horizon
- IRR
- —
- Equity multiple
- 17.59×
- Total profit
- $45,999
- Equity at exit
- $1,476
- IRR
- —
- Equity multiple
- 43.39×
- Total profit
- $117,506
- Equity at exit
- $856
Cash invested: $2,772 (down + closing). Projections, not guarantees.
Landlord ↔ Tenant lean methodology
- Overall (STATE)
- 62 Landlord-Friendly
- State Michigan
- 62 Landlord-Friendly · EVEN
- County
- — inherits STATE
- City
- — inherits STATE
ZIP-level market 48503
- Home prices YoY
- -27.7%
- Rents YoY
- 12.3%
- Active inventory
- 135
- Price-to-rent
- 0.9×
Monthly cashflow live
- Estimated rent
- $934 high interval (Pro) →
- Mortgage (P&I)
- −$52
- Tax est. 1.5%
- −$12 /mo · $148/yr
- Insurance
- −$4
- HOA
- −$0
- Vacancy / Maint / Mgmt
- −$196
- Net cashflow
- $670
Break-even live
UW: 25.0% down · 7.5% · 30yr · 1.5% tax · 5.0% vac · 8.0% maint · 8.0% mgmt
Financing live
Cash to close
- Down payment
- $2,475
- Closing costs
- $297
- Reserves months
- —
- Total cash needed
- —
Loan-product check · same deal, 3 products live
Conventional
25% down · 7.5% · 30yr
- Down + closing
- —
- Monthly P&I
- —
- Monthly cashflow
- —
- DSCR
- —
- Eligible?
- —
Personal DTI + credit; lowest rate.
DSCR
20% down · 8.5% · 30yr
- Down + closing
- —
- Monthly P&I
- —
- Monthly cashflow
- —
- DSCR
- —
- Eligible?
- —
No personal income docs; deal must DSCR.
Hard money
10% down · 12.0% · 12mo
- Down + closing
- —
- Monthly P&I
- —
- Monthly cashflow
- —
- DSCR
- —
- Eligible?
- —
Short-term bridge; refi at stabilization.
Rent comps 5 comps
| Address | Beds | Baths | Sqft | Rent | $/sqft | DOM | Units | Dist |
|---|---|---|---|---|---|---|---|---|
| 1605 Kearsley Park Blvd Flint, MI | 2.0 | 1.0 | 875 | $975 | $1.11 | 13d | 1 | 0.32mi |
| 1553 Illinois Ave Flint, MI | 2.0 | 1.0 | 702 | $900 | $1.28 | 21d | 1 | 0.40mi |
| 501 S Meade St Flint, MI | 2.0 | 1.0 | 850 | $695 | $0.82 | 13d | 1 | 1.04mi |
| 2621 Churchill Ave Flint, MI | 2.0 | 1.0 | 736 | $795 | $1.08 | 13d | 1 | 1.04mi |
| 607 E 2nd Ave Unit 803 Flint, MI | 1.0 | 1.0 | 606 | $1,025 | $1.69 | 13d | 1 | 1.07mi |
Listing history 18 events
-
2026-06-18days on market $9,900 Active 48 DOM
-
2026-06-17days on market $9,900 Active 47 DOM
-
2026-06-16days on market $9,900 Active 46 DOM
-
2026-06-15days on market $9,900 Active 45 DOM
-
2026-06-14days on market $9,900 Active 43 DOM
-
2026-06-13days on market $9,900 Active 42 DOM
-
2026-06-10days on market $9,900 Active 40 DOM
-
2026-06-09days on market $9,900 Active 39 DOM
-
2026-06-08days on market $9,900 Active 38 DOM
-
2026-06-07days on market $9,900 Active 37 DOM
-
2026-06-05days on market $9,900 Active 34 DOM
-
2026-06-03days on market $9,900 Active 33 DOM
-
2026-06-02days on market $9,900 Active 32 DOM
-
2026-06-01days on market $9,900 Active 31 DOM
-
2026-05-31days on market $9,900 Active 30 DOM
-
2026-05-30days on market $9,900 Active 29 DOM
-
2026-05-01$12,000 Active 107-char remark
Show marketing remark (107 chars)
Investor special! Great opportunity to add value and maximize returns. Ideal for rehab or rental portfolio.
-
2026-05-01$12,000 Active
Show marketing remark (107 chars)
Investor special! Great opportunity to add value and maximize returns. Ideal for rehab or rental portfolio.
ⓘ Source: listings_history table (triggers on properties + properties_extension) + one-shot
backfill from property_details.listing_events for pre-trigger history.
Climate risk First Street
- Flood 1/10 Low FEMA zone X (unshaded) · 0% chance over 30 yrs
- Wildfire 1/10 Low
- Heat 2/10 Low 7 d/yr ≥96°F today · 15 d/yr by 30 yrs out
- Wind 2/10 Low
- Air quality 3/10 Moderate 3 unhealthy d/yr today · 4 by 30 yrs out
Nearby sold comps map
Loading sold comps map…
Walkable amenities ~0.75 mi
Loading nearby amenities…
Taxation est. · year 1
- Rental income
- $11,211
- − Mortgage interest
- −$555
- − Property taxes
- −$148
- − Insurance
- −$50
- − Repairs & maintenance
- −$897
- − Management
- −$897
- − Depreciation
- −$288
- Taxable income
- $8,377
- Est. tax owed @ 24.0%
- −$2,011
- After-tax cash flow
- $6,026/yr
For passive investors: Depreciation is non-cash, so a rental often shows a tax loss while cash-flowing — sheltering income. Rental losses are passive: they offset passive income freely, and up to $25,000/yr can offset ordinary (W-2) income if you actively participate and your MAGI is under $100k (phasing out to $0 by $150k); unused losses carry forward. On sale, claimed depreciation is recaptured at up to 25%, and gains may owe capital-gains tax (a 1031 exchange can defer both). Figures are a year-1 estimate at your 24.0% rate — not tax advice; consult a CPA.
Schools (NCES district)
- District
- Flint School District
- NCES district ID
- 2614520
- Math proficiency
- 7% ▬ 0.00%
- Reading proficiency
- 13% ▲ 3.00%
- Median HH income
- $25,954
- Composite
- 10.97/100
- National rank
- #14642
- State rank
- #714 of 760 in MI
Livability — Flint
- Score
- 74/100
- State rank
- #196
- US rank
- #4946
Category grades
Schools grade is shown separately in the Schools card above.
Census & demographics
- Census place
- Flint, MI
- County
- Genesee County · 221,329 people
- City population
- 93,814
- Metro
- Flint, MI
- Population (ZIP)
- 22,347
- Household income
- $44,411
- Rent vs Own
- Severe rent burden
- 1293.0
Population outlook (Genesee County) Hauer SSP2
- Today (2025)
- 381,312 people
- By 2030
- 362,731 · -4.9%
- By 2040
- 321,550 · -15.7%
- By 2050
- 279,212 · -26.8%
- By 2075
- 193,336 · -49.3%
- By 2100
- 128,118 · -66.4%
Race, ethnicity, and origin ACS 2023
- Neighborhood character
- Diverse neighborhood (Simpson 0.56)
- Race & ethnicity
- Black 55% White 36% Two or more races 4% Hispanic / Latino 3%
- Common ancestry
- Romanian 2% Lithuanian 2% Slovak 1%
- Foreign-born
- 5% · China, Canada
- Languages at home
- 93% English-only · Arabic 4% Spanish 1% Chinese 1%
Political lean MEDSL · Genesee
- 2024 margin
- Toss-up / Even · D 51.4% · R 47.2% · Other 1.4%
- 2008→2024 swing
- -28.3pp toward R · 2008: 32.5pp · 2024: 4.2pp
- All cycles
- 2024: D+4.2 2020: D+9.3 2016: D+9.5 2012: D+28.2 2008: D+32.5
Not yet ingested
- Civics
- —
Market trends
- HPI YoY
- ▼ -49.84%
- Current HPI
- 130.1152
- Rent YoY
- ▲ 12.35%
- Metro
- Flint, MI
- State GDP YoY
- ▲ 1.37%
- F500 in state
- 28
Industry mix (Fortune 500 HQ in MI)
| Industry | F500 HQs | Revenue |
|---|---|---|
| Automotive Parts | 3 | $48B |
|
||
| Automotive | 2 | $372B |
|
||
| Chemicals | 1 | $45B |
|
||
| Automotive Retail | 1 | $29B |
|
||
| Healthcare / Medical Devices | 1 | $23B |
|
||
| Automotive Technology | 1 | $20B |
|
||
Price history
+0.0% since first listed2 events — show timeline
- 2026-05-01 Listed $12,000 REALCOMP
- 2026-05-01 Listed $12,000 MiRealSource-MiMLS
Property tax history
+4.8%/yrLatest (2025): $782 · +195.4% YoY. Source: county tax records.
Cash-flow waterfall
monthlySold comps — $/sqft
last 12 mo · ≤1 miLoading sold comps…