 Multi-family
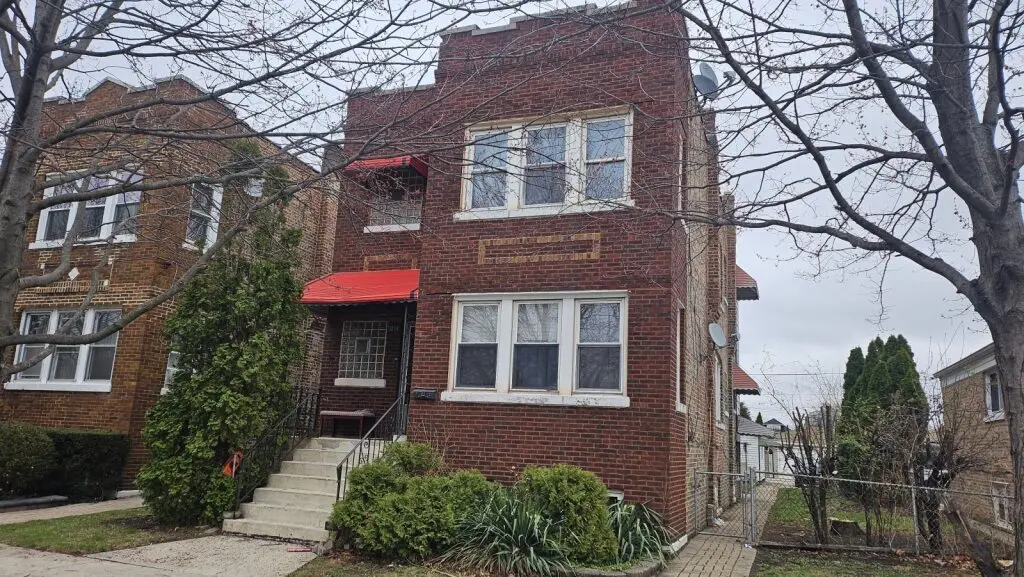
3231 S 53rd Ct · Cicero, IL
Flood risk 4/10 · Minor
- FEMA flood zone
- X (unshaded)
- Chance of flooding over 30 yrs
- 0.2%
- Est. flood insurance / yr
- $473 – $860
Fire risk 1/10 · Minimal
- Est. fire insurance / yr
- $804 – $1,492
Heat risk 3/10 · Minor
- Hot days now (above 99°F)
- 7 days/yr
- Hot days in 30 yrs
- 15 days/yr
Wind risk 2/10 · Minimal
- Chance of severe wind over 30 yrs
- 1.0%
Air-quality risk 4/10 · Minor
- Unhealthy air days now
- 3 days/yr
- Unhealthy air days in 30 yrs
- 5 days/yr
Risk factors via First Street. Map © Google.
Why this score? — see what drove the D grade
The composite is a weighted blend of 9 inputs, each scored 0–100. Each bar is that input's sub-score; the figure is the points it added to the 100-point composite (weight × sub-score).
- Cash flow +13.0/30.0
- ARV discount +7.5/15.0
- 1% rule +5.1/10.0
- Livability +4.1/5.0
- DSCR +3.9/10.0
- Rent growth +3.1/5.0
- Condition / age +2.5/5.0
- Schools +1.1/10.0
- Appreciation +0.0/10.0
$325,000
🖨 Deal sheet 📄 Offer letter ✓ Due diligence
Multi-family units
County records classify this as Multi-Family (2-4 Unit). Listing-text estimate: 1 unit. estimate disagrees with records
Listing remarks
This classic brick two flat with a full basement offers a rare opportunity to live comfortably while creating long term financial stability. Owner occupants can enjoy one spacious unit while rental income from the second helps monthly expenses and build equity over time. Ideally located in Cicero near shopping, restaurants, and daily conveniences, each unit features six bright rooms, two generous bedrooms, a formal dining room for memorable gatherings, and a versatile tandem room perfect for a home office or flex space. Situated on an extra wide lot with a two car garage plus carport, this property is designed for easy living and strong appeal to tenants alike. Whether you're putting down r
Key facts
- Formal dining room
- Carport
- Full basement
Tags
Property features AI
Finance
- Other: Possession subject to tenants' rights; Monthly-rent units: Unit 1 rent $925 (month-to-month), Unit 2 rent $865 (month-to-month); Tenants pay electric; Security deposits listed: Unit 1 $1,387; Unit 2 $825
- Financial info: Building contains 2 units; Special service area: No
Exterior
- Parking: Detached garage (garage owned) with 2 garage spaces; 2 total parking spaces
- Utilities: Water from Lake Michigan; Public sewer
- Home design: Two- to four-unit property; Fee simple ownership; More than 100 years old; Built before 1978
- Construction: Brick construction
- Exterior features: Lot dimensions approximately 40 x 125; Lot less than 0.25 acre
Interior
- Kitchen: Unit 1: Stove, Refrigerator; Unit 2: Stove, Refrigerator
- Bedrooms: 4 bedrooms total; Unit 1: 2 bedrooms (1st floor); Unit 2: 2 bedrooms (2nd floor)
- Bathrooms: 2 full bathrooms total; Unit 1: 1 full bathroom; Unit 2: 1 full bathroom
- Heating & cooling: Natural gas forced-air heating
- Interior features: 10 total rooms; Unfinished full basement
Neighborhood map
What this means for you Summary
Snapshot
- This is a 4-bed/2.0-bath multifamily listed at $325k.
Deal economics
- At list price, monthly cash flow is $-16 ($-192/yr) — negative.
- To cash-flow at today's rent, offer at most $322k (0.9% below list).
- Meets the 1% rule at list price ($3k rent vs $325k).
- Recommended offer: $306k (6.0% below list) — sets the bar for market timing.
- Cap rate 6.2% vs local median 4.6% in Cicero — top-decile yield for the area; either an underpriced asset or a hidden risk that comps aren't pricing in. Stress-test before assuming the spread holds.
Location & tenants
- Location reads 82/100 on livability (#77 in IL, #1,276 nationally) — a professional / high-income tenant draw. Strengths: commute A+, cost of living A+, housing A+; Watch: schools F.
- J S Morton Hsd 201 (suburban): math 9% / reading 14% proficiency, ranked #557 of 620 in IL (top 90%) — low school quality limits family demand, transient renter base, plan for 1-2y turnover.
- Market conditions: Rents rising (+2.4%/yr); 103 active listings in the ZIP; 3 comparable units currently listed for rent nearby; rentals at typical pace (median 21d on market — plan ~3-4 weeks tenant-placement turnaround); 6,272 units permitted in Cook County in 2024 (4,658 in 5+ unit buildings).
- At $3,272/mo this rent would consume 55% of the median local household income ($71k/yr) (locally 2178% of renters already pay >50% of income on rent) — very limited rent-growth headroom before tenants either downsize or default.
Forward outlook
- Local home prices are declining (-3.0%/yr); year-one equity from $2k of loan paydown is wiped out by about $10k of value loss. Plan a longer hold.
Negotiation context
- It's been on market 78 days — a 6% lower offer ($306k) is reasonable based on typical stale-listing flexibility.
- 3 sale attempts since 4y ago with the ask held roughly flat each time — persistent listings suggest the price (not the market) is what's stuck; bring a comps-based counter.
Risks & watch-outs
- Watch-outs: property tax is 2.8% of price; built in 1925 — expect roof / HVAC / electrical / plumbing capex.
Questions for the listing agent
- What do current leases actually rent for vs. the listed asking? Can we see a recent rent roll and the last 12 months of T-12 income?
- It's been on market 78 days. Have you received any prior offers? Is the seller open to a 6% concession, seller financing, or rate buy-down credit?
- Built in 1925 — when were the roof, HVAC, electrical panel, plumbing, and water heater last replaced?
- Property tax is high relative to price — has the assessment been appealed recently, and will the sale trigger a re-assessment?
- Why hasn't it sold? Are there any deal-killer items the seller is aware of (foundation, flood, title, zoning, code violations)?
- Is there a deadline driving the sale (1031 exchange, divorce, estate, relocation)? That informs how much negotiation room exists.
- Schools are F-rated, which usually means shorter tenancies and higher turnover. Who's the typical renter profile here, and what's been the actual vacancy rate?
- The area grade is low — what's the realistic commute time and amenity access for the typical tenant pool here? Any planned neighborhood developments (good or bad) we should know about?
- What's the average days-on-market for RENTAL listings here right now (not sales)? A rising rental-DOM trend means longer vacancies and softer asking-rent achievability than the comps imply.
- What's the recent tenant-quality profile in this submarket — average credit score on applications, eviction rate, late-payment / NSF rate, and stable-employment percentage? A property-management company in the area should have these aggregated.
- How much new apartment / multifamily construction is in the pipeline within 1–3 miles? Heavy new supply (>2% of stock underway) typically softens rents 12–24 months out; light construction supports rent growth.
Investment metrics
- 1% rule
- 1.01% ✓
- Cap rate
- 6.23%
- Cash-on-cash
- -0.21%
- DSCR
- 0.99
- GRM
- 8.3
CMA / ARV
No comps found within radius.
Projected returns pro-forma
-3.0% appreciation · 2.43% rent growth · sell at horizon
- IRR
- -17.3%
- Equity multiple
- 0.39×
- Total profit
- $-55,284
- Equity at exit
- $48,459
- IRR
- -10.4%
- Equity multiple
- 0.39×
- Total profit
- $-55,938
- Equity at exit
- $28,100
Cash invested: $91,000 (down + closing). Projections, not guarantees.
Landlord ↔ Tenant lean methodology
- Overall (STATE)
- 43 Moderately Tenant-Leaning
- State Illinois
- 43 Moderately Tenant-Leaning · D+7
- County
- — inherits STATE
- City
- — inherits STATE
ZIP-level market 60804
- Rents YoY
- 2.4%
- Active inventory
- 103
- Price-to-rent
- 16.6×
Monthly cashflow live
- Estimated rent
- $3,272 high interval (Pro) →
- Mortgage (P&I)
- −$1,704
- Tax from tax record
- −$761 /mo · $9,134/yr
- Insurance
- −$135
- HOA
- −$0
- Vacancy / Maint / Mgmt
- −$687
- Net cashflow
- $-16
Break-even live
2-unit breakdown (identical units grouped — click to expand)
| Units | Beds | Baths | Est. rent |
|---|---|---|---|
| 2× units | 2 | 1 | $3,272 |
| #1 | 2 | 1 | $1,636 |
| #2 | 2 | 1 | $1,636 |
| Total (2 units) | $3,272 | ||
UW: 25.0% down · 7.5% · 30yr · 1.5% tax · 5.0% vac · 8.0% maint · 8.0% mgmt
Financing live
Cash to close
- Down payment
- $81,250
- Closing costs
- $9,750
- Reserves months
- —
- Total cash needed
- —
Loan-product check · same deal, 3 products live
Conventional
25% down · 7.5% · 30yr
- Down + closing
- —
- Monthly P&I
- —
- Monthly cashflow
- —
- DSCR
- —
- Eligible?
- —
Personal DTI + credit; lowest rate.
DSCR
20% down · 8.5% · 30yr
- Down + closing
- —
- Monthly P&I
- —
- Monthly cashflow
- —
- DSCR
- —
- Eligible?
- —
No personal income docs; deal must DSCR.
Hard money
10% down · 12.0% · 12mo
- Down + closing
- —
- Monthly P&I
- —
- Monthly cashflow
- —
- DSCR
- —
- Eligible?
- —
Short-term bridge; refi at stabilization.
Rent comps 3 comps
| Address | Beds | Baths | Sqft | Rent | $/sqft | DOM | Units | Dist |
|---|---|---|---|---|---|---|---|---|
| 3222 S 52nd Ct Cicero, IL | 3.0 | 2.0 | 1627 | $5,850 | $3.60 | 1d | 1 | 0.12mi |
| 3633 S 57th Ct Cicero, IL | 3.0 | 2.5 | 1708 | $2,500 | $1.46 | 21d | 1 | 0.69mi |
| 5529 W 22nd Pl #2 Cicero, IL | 3.0 | 1.0 | 1400 | $1,900 | $1.36 | 24d | 1 | 1.21mi |
Listing history 24 events
-
2026-06-18days on market $325,000 Active 78 DOM
-
2026-06-17days on market $325,000 Active 77 DOM
-
2026-06-16days on market $325,000 Active 76 DOM
-
2026-06-15days on market $325,000 Active 75 DOM
-
2026-06-13days on market $325,000 Active 73 DOM
-
2026-06-09days on market $325,000 Active 69 DOM
-
2026-06-08days on market $325,000 Active 68 DOM
-
2026-06-07days on market $325,000 Active 67 DOM
-
2026-06-04days on market $325,000 Active 64 DOM
-
2026-06-03days on market $325,000 Active 63 DOM
-
2026-06-02days on market $325,000 Active 62 DOM
-
2026-06-01days on market $325,000 Active 61 DOM
-
2026-05-31days on market $325,000 Active 60 DOM
-
2026-05-14status Active
-
2026-05-12historical Contingent - Continue to Show
-
2026-04-01$325,000 Active
-
2022-05-16historical
-
2022-03-15price
-
2022-03-02price
-
2022-02-17price
-
2022-01-26Active
-
2007-04-09soldstatus $330,000
-
1993-02-11soldstatus $126,500
-
1982-11-03soldstatus $35,000
ⓘ Source: listings_history table (triggers on properties + properties_extension) + one-shot
backfill from property_details.listing_events for pre-trigger history.
Tax reassessment forecast IL · Partial reset (capped growth)
- Current annual tax
- $9,134 · $761/mo
- Projected year-2 tax
- $9,134 · $761/mo
- Expected delta
- $0/yr ($0/mo · 0.0%)
ⓘ Screening estimate from a state-policy table — verify with the county assessor before closing.
Climate risk First Street
- Flood 4/10 Moderate FEMA zone X (unshaded) · 20% chance over 30 yrs
- Wildfire 1/10 Low
- Heat 3/10 Moderate 7 d/yr ≥99°F today · 15 d/yr by 30 yrs out
- Wind 2/10 Low 100% chance of damaging wind over 30 yrs
- Air quality 4/10 Moderate 3 unhealthy d/yr today · 5 by 30 yrs out
Nearby sold comps map
Loading sold comps map…
Walkable amenities ~0.75 mi
Loading nearby amenities…
Taxation est. · year 1
- Rental income
- $39,264
- − Mortgage interest
- −$18,205
- − Property taxes
- −$9,134
- − Insurance
- −$1,625
- − Repairs & maintenance
- −$3,141
- − Management
- −$3,141
- − Depreciation
- −$9,455
- Taxable loss
- −$5,437
- Est. tax savings @ 24.0%
- +$1,305
- After-tax cash flow
- $1,112/yr
For passive investors: Depreciation is non-cash, so a rental often shows a tax loss while cash-flowing — sheltering income. Rental losses are passive: they offset passive income freely, and up to $25,000/yr can offset ordinary (W-2) income if you actively participate and your MAGI is under $100k (phasing out to $0 by $150k); unused losses carry forward. On sale, claimed depreciation is recaptured at up to 25%, and gains may owe capital-gains tax (a 1031 exchange can defer both). Figures are a year-1 estimate at your 24.0% rate — not tax advice; consult a CPA.
Schools (NCES district)
- District
- J S Morton Hsd 201
- NCES district ID
- 1726880
- Math proficiency
- 9% ▲ 1.00%
- Reading proficiency
- 14% ▼ -1.00%
- Median HH income
- $48,698
- Composite
- 10.73/100
- National rank
- #9768
- State rank
- #557 of 620 in IL
Livability — Cicero
- Score
- 82/100
- State rank
- #77
- US rank
- #1276
Category grades
Schools grade is shown separately in the Schools card above.
Census & demographics
- Census place
- Cicero, IL
- County
- Cook County · 4,486,803 people
- City population
- 82,797
- Metro
- Chicago-Naperville-Elgin, IL-IN-WI
- Population (ZIP)
- 82,797
- Household income
- $70,842
- Rent vs Own
- Severe rent burden
- 2178.0
Population outlook (Cook County) Hauer SSP2
- Today (2025)
- 5,347,519 people
- By 2030
- 5,357,703 · +0.2%
- By 2040
- 5,324,924 · -0.4%
- By 2050
- 5,230,762 · -2.2%
- By 2075
- 4,785,735 · -10.5%
- By 2100
- 4,188,836 · -21.7%
Race, ethnicity, and origin ACS 2023
- Neighborhood character
- Predominantly Hispanic (89%)
- Race & ethnicity
- Hispanic / Latino 89% Two or more races 17% White 7% Black 3% Native American 2%
- Hispanic origin (detail)
- Mexican 80% Puerto Rican 3%
- Common ancestry
- Romanian 2%
- Foreign-born
- 40% · Canada, Jamaica
- Languages at home
- 18% English-only · Spanish 80%
Political lean MEDSL · Cook
- 2024 margin
- Solid D (+42.0) · D 70.4% · R 28.4% · Other 1.2%
- 2008→2024 swing
- -11.4pp toward R · 2008: 53.4pp · 2024: 42.0pp
- All cycles
- 2024: D+42.0 2020: D+50.3 2016: D+53.0 2012: D+49.4 2008: D+53.4
Not yet ingested
- Civics
- —
Market trends
- HPI YoY
- ▼ -165.38%
- Current HPI
- 262.83
- Rent YoY
- ▲ 2.43%
- Metro
- Chicago-Naperville-Elgin, IL-IN-WI
- State GDP YoY
- ▲ 1.59%
- F500 in state
- 60
Industry mix (Fortune 500 HQ in IL)
| Industry | F500 HQs | Revenue |
|---|---|---|
| Insurance | 4 | $201B |
|
||
| Consumer Goods | 4 | $87B |
|
||
| Industrial Machinery | 3 | $64B |
|
||
| Healthcare | 2 | $55B |
|
||
| Retail / Pharmacy | 1 | $148B |
|
||
| Agriculture / Food | 1 | $86B |
|
||
Price history
+828.6% since first listed11 events — show timeline
- 2026-05-14 Relisted — MRED as Distributed by MLS Grid
- 2026-05-12 Contingent — MRED as Distributed by MLS Grid
- 2026-04-01 Listed $325,000 MRED as Distributed by MLS Grid
- 2022-05-16 Listing Removed — MRED as Distributed by MLS Grid
- 2022-03-15 Price Changed — MRED as Distributed by MLS Grid
- 2022-03-02 Price Changed — MRED as Distributed by MLS Grid
- 2022-02-17 Price Changed — MRED as Distributed by MLS Grid
- 2022-01-26 Listed — MRED as Distributed by MLS Grid
- 2007-04-09 Sold (Public Records) $330,000 Public Records
- 1993-02-11 Sold (Public Records) $126,500 Public Records
- 1982-11-03 Sold (Public Records) $35,000 Public Records
Property tax history
+2.2%/yrLatest (2023): $9,134 · +15.7% YoY. Source: county tax records.
Cash-flow waterfall
monthlySold comps — $/sqft
last 12 mo · ≤1 miLoading sold comps…