 🏷️ Likely Rental
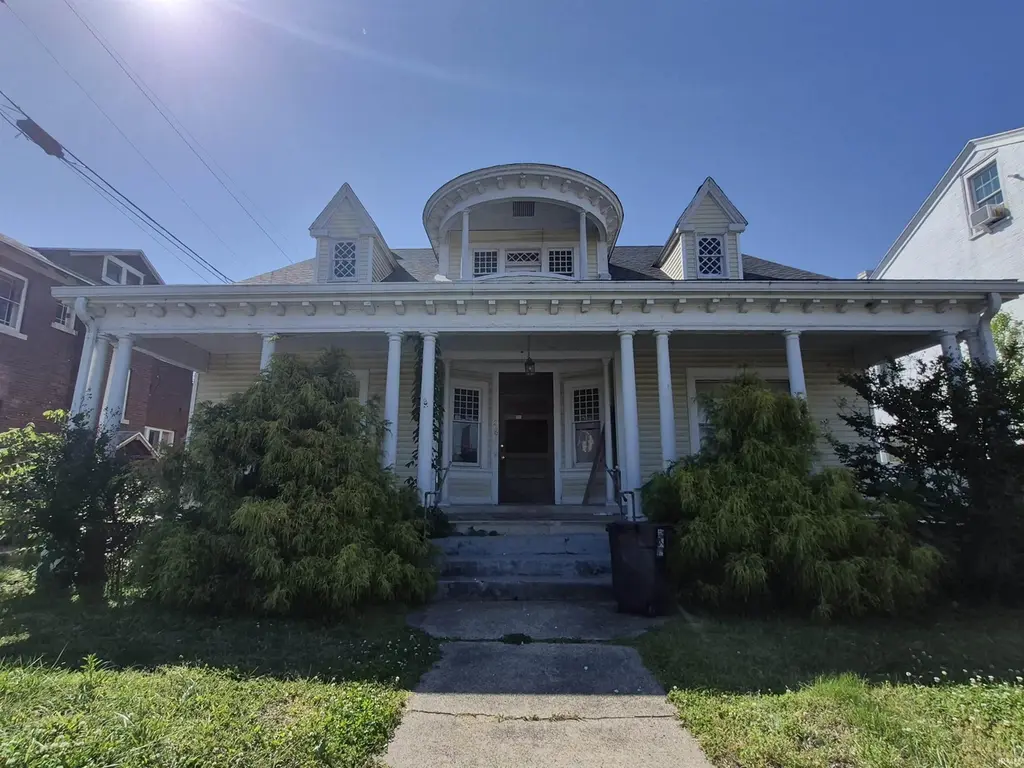
309 N 4th St · Vincennes, IN
Flood risk 1/10 · Minimal
- FEMA flood zone
- —
- Chance of flooding over 30 yrs
- 0.0%
- Est. flood insurance / yr
- —
Fire risk 1/10 · Minimal
- Est. fire insurance / yr
- $717 – $1,331
Heat risk 5/10 · Moderate
- Hot days now (above 106°F)
- 7 days/yr
- Hot days in 30 yrs
- 20 days/yr
Wind risk 2/10 · Minimal
- Chance of severe wind over 30 yrs
- 2.0%
Air-quality risk 3/10 · Minor
- Unhealthy air days now
- 2 days/yr
- Unhealthy air days in 30 yrs
- 3 days/yr
Risk factors via First Street. Map © Google.
Why this score? — see what drove the B- grade
The composite is a weighted blend of 9 inputs, each scored 0–100. Each bar is that input's sub-score; the figure is the points it added to the 100-point composite (weight × sub-score).
- Cash flow +30.0/30.0
- 1% rule +10.0/10.0
- DSCR +10.0/10.0
- ARV discount +7.5/15.0
- Livability +3.5/5.0
- Schools +3.0/10.0
- Rent growth +2.5/5.0
- Condition / age +2.5/5.0
- Appreciation +0.0/10.0
$52,900
🖨 Deal sheet (PDF) 📄 Offer letter ✓ Due diligence
Listing remarks MLS
Charming, hardwood floors, some new windows, many large closet, both baths updated. Appliances can stay, covered front porch, fireplace, wonderful hot water heat, could have central air, formal dining room, several built ins, balcony on 2nd floor, main & upper laundry rooms. According to seller, average utilities: Gas $106 per month and electric - $147 per month.
Key facts
- Covered front porch
- Built in storage
- Formal dining room
Tags
Property features AI
Exterior
- Parking: Detached 1-car garage
- Utilities: Public water; Public sewer
- Home design: Single-family residence, site-built; 2 stories
- Construction: Vinyl siding; Block foundation
- Exterior features: Level lot
Interior
- Bedrooms: Bedrooms present (total rooms indicate 8 rooms)
- Bathrooms: Two full bathrooms; One main-level bathroom
- Heating & cooling: Natural gas heating; Hot water heating; No cooling
- Interior features: Living room fireplace (1); Partial basement
- Laundry & utility: Main-level laundry
Neighborhood map
What this means for you Summary
Snapshot
- This is a 4-bed/2.0-bath single-family listed at $53k.
Deal economics
- At list price, monthly cash flow is $1k ($14k/yr) — positive.
- The deal already cash-flows at list — no discount required.
- Meets the 1% rule at list price ($2k rent vs $53k).
- Cap rate 33.0% vs local median 5.1% in Vincennes — top-decile yield for the area; either an underpriced asset or a hidden risk that comps aren't pricing in. Stress-test before assuming the spread holds.
Location & tenants
- Location reads 70/100 on livability (#148 in IN) — a middle-class / working-renter tenant base. Strengths: cost of living A+, housing A+, health & safety A+; Watch: amenities F, commute F, employment D-.
- Vincennes Community School Corporation (town): math 34% / reading 38% proficiency, ranked #193 of 301 in IN (top 64%) — families likely to look elsewhere, expect single-tenant / working-renter base with shorter leases.
- Zoned schools: Tecumseh-Harrison Elementary Sch (math 22% / reading 32%, grade F, #737 of 994 statewide, top 76%, 369 students, 68% FRL); George Rogers Clark School (math 27% / reading 34%, grade F, #203 of 330 statewide, top 63%, 609 students, 57% FRL); Lincoln High School (math 27% / reading 47%, grade F, #247 of 369 statewide, top 70%, 765 students, 55% FRL).
- Market conditions: 139 active listings in the ZIP; 1 comparable units currently listed for rent nearby; 36 units permitted in Knox County in 2024 (0 in 5+ unit buildings).
Forward outlook
- Local home prices are declining (-3.0%/yr); year-one equity from $366 of loan paydown is wiped out by about $2k of value loss. Plan a longer hold.
- Knox County population projected at -13% by 2050 — secular population decline; favor cash flow + early exit over multi-decade hold.
- At projected returns (-3.0% appreciation + 3.0% rent growth), your $15k cash investment doubles in ~2 years — after that, you're playing with house money.
Negotiation context
- Only 5 days on market — expect competitive offers; lowballing is unlikely to land.
- 2 sale attempts since 9y ago with the ask held roughly flat each time — persistent listings suggest the price (not the market) is what's stuck; bring a comps-based counter.
Risks & watch-outs
- Watch-outs: built in 1910 — expect roof / HVAC / electrical / plumbing capex.
- Climate carrying-cost: extreme-heat days projected 7→20/yr by 2055 (HVAC capex compounding) — expect insurance premiums to compound above CPI over the hold.
Questions for the listing agent
- Built in 1910 — when were the roof, HVAC, electrical panel, plumbing, and water heater last replaced?
- Is there a deadline driving the sale (1031 exchange, divorce, estate, relocation)? That informs how much negotiation room exists.
- Schools are D-rated, which usually means shorter tenancies and higher turnover. Who's the typical renter profile here, and what's been the actual vacancy rate?
- What's the average days-on-market for RENTAL listings here right now (not sales)? A rising rental-DOM trend means longer vacancies and softer asking-rent achievability than the comps imply.
- What's the recent tenant-quality profile in this submarket — average credit score on applications, eviction rate, late-payment / NSF rate, and stable-employment percentage? A property-management company in the area should have these aggregated.
- How much new for-sale + rental construction is in the pipeline within 1–3 miles? Heavy new supply typically softens prices + rents 12–24 months out; constrained supply supports both.
Investment metrics
- 1% rule
- 3.78% ✓
- Cap rate
- 33.01%
- Cash-on-cash
- 95.43%
- DSCR
- 5.25
- GRM
- 2.2
CMA / ARV
- ARV (on-the-fly)
- $151,712
- Comps found
- 2
Show comp detail 2 sales within ~0.75 mi
| Address | Dist | Beds/Ba | Sqft | Sold | Price | $/sf | Match |
|---|---|---|---|---|---|---|---|
| 715 Buntin St | 0.22mi | 4/2.0 | 3,145 (-9%) | 14mo | $130,000 | $41 | 64 |
| 903 Broadway St | 0.35mi | 4/1.0 | 3,214 (-7%) | 8mo | $142,000 | $44 | 62 |
Match score weights: distance 35% · size 25% · config 20% · recency 20%. Top-matched comps best support the ARV.
Projected returns pro-forma
-3.0% appreciation · 3.0% rent growth · sell at horizon
- IRR
- 96.4%
- Equity multiple
- 5.49×
- Total profit
- $66,504
- Equity at exit
- $7,888
- IRR
- 99.0%
- Equity multiple
- 11.45×
- Total profit
- $154,729
- Equity at exit
- $4,574
Cash invested: $14,812 (down + closing). Projections, not guarantees.
Landlord ↔ Tenant lean methodology
- Overall (STATE)
- 90 Strongly Landlord-Friendly
- State Indiana
- 90 Strongly Landlord-Friendly · R+11
- County
- — inherits STATE
- City
- — inherits STATE
ZIP-level market 47591
- Home prices YoY
- -19.5%
- Active inventory
- 139
- Price-to-rent
- 2.2×
Monthly cashflow live
- Estimated rent
- $2,000 medium interval (Pro) →
- Mortgage (P&I)
- −$277
- Tax from tax record
- −$103 /mo · $1,231/yr
- Insurance
- −$22
- HOA
- −$0
- Vacancy / Maint / Mgmt
- −$420
- Net cashflow
- $1,178
Break-even live
Sensitivity live
| Price | -10% $1,208 | -5% $1,193 | +0% $1,178 | +5% $1,163 | +10% $1,148 |
|---|---|---|---|---|---|
| Rent | -10% $1,020 | -5% $1,099 | +0% $1,178 | +5% $1,257 | +10% $1,336 |
| Rate | -1.0pp $1,205 | -0.5pp $1,191 | base $1,178 | +0.5pp $1,164 | +1.0pp $1,150 |
UW: 25.0% down · 7.5% · 30yr · 1.5% tax · 5.0% vac · 8.0% maint · 8.0% mgmt
Financing live
Cash to close
- Down payment
- $13,225
- Closing costs
- $1,587
- Reserves months
- —
- Total cash needed
- —
Loan-product check · same deal, 3 products live
Conventional
25% down · 7.5% · 30yr
- Down + closing
- —
- Monthly P&I
- —
- Monthly cashflow
- —
- DSCR
- —
- Eligible?
- —
Personal DTI + credit; lowest rate.
DSCR
20% down · 8.5% · 30yr
- Down + closing
- —
- Monthly P&I
- —
- Monthly cashflow
- —
- DSCR
- —
- Eligible?
- —
No personal income docs; deal must DSCR.
Hard money
10% down · 12.0% · 12mo
- Down + closing
- —
- Monthly P&I
- —
- Monthly cashflow
- —
- DSCR
- —
- Eligible?
- —
Short-term bridge; refi at stabilization.
Rent comps 1 comps
| Address | Beds | Baths | Sqft | Rent | $/sqft | DOM | Units | Dist |
|---|---|---|---|---|---|---|---|---|
| 1601 Montclair Dr Vincennes, IN | 3.0 | 2.0 | 2800 | $2,000 | $0.71 | 44d | 1 | 1.36mi |
Listing history 4 events
-
2026-06-07statusdays on market $52,900 Pending 5 DOM
-
2026-06-04days on market $52,900 Active 2 DOM
-
2026-06-02remarks 268-char remark
-
2026-06-02$52,900 Active 1 DOM
ⓘ Source: listings_history table (triggers on properties + properties_extension) + one-shot
backfill from property_details.listing_events for pre-trigger history.
Tax reassessment forecast IN · Partial reset (capped growth)
- Current annual tax
- $1,231 · $103/mo
- Projected year-2 tax
- $1,231 · $103/mo
- Expected delta
- $0/yr ($0/mo · 0.0%)
ⓘ Screening estimate from a state-policy table — verify with the county assessor before closing.
Climate risk First Street
- Flood 1/10 Low 0% chance over 30 yrs
- Wildfire 1/10 Low
- Heat 5/10 Major 7 d/yr ≥106°F today · 20 d/yr by 30 yrs out
- Wind 2/10 Low 2% chance of damaging wind over 30 yrs
- Air quality 3/10 Moderate 2 unhealthy d/yr today · 3 by 30 yrs out
Nearby sold comps map
Loading sold comps map…
Walkable amenities ~0.75 mi
Loading nearby amenities…
Taxation est. · year 1
- Rental income
- $24,000
- − Mortgage interest
- −$2,963
- − Property taxes
- −$1,231
- − Insurance
- −$264
- − Repairs & maintenance
- −$1,920
- − Management
- −$1,920
- − Depreciation
- −$1,539
- Taxable income
- $14,162
- Est. tax owed @ 24.0%
- −$3,399
- After-tax cash flow
- $10,736/yr
For passive investors: Depreciation is non-cash, so a rental often shows a tax loss while cash-flowing — sheltering income. Rental losses are passive: they offset passive income freely, and up to $25,000/yr can offset ordinary (W-2) income if you actively participate and your MAGI is under $100k (phasing out to $0 by $150k); unused losses carry forward. On sale, claimed depreciation is recaptured at up to 25%, and gains may owe capital-gains tax (a 1031 exchange can defer both). Figures are a year-1 estimate at your 24.0% rate — not tax advice; consult a CPA.
Schools (NCES district)
- District
- Vincennes Community School Corporation
- NCES district ID
- 1812120
- Math proficiency
- 34% ▼ -5.00%
- Reading proficiency
- 38% ▼ -4.00%
- Median HH income
- $38,359
- Composite
- 30.05/100
- National rank
- #6354
- State rank
- #193 of 301 in IN
Livability — Vincennes
- Score
- 70/100
- State rank
- #148
- US rank
- #7480
Category grades
Schools grade is shown separately in the Schools card above.
Census & demographics
- Census place
- Vincennes, IN
- Population (ZIP)
- 25,191
Population outlook (Knox County) Hauer SSP2
- Today (2025)
- 37,092 people
- By 2030
- 36,271 · -2.2%
- By 2040
- 34,196 · -7.8%
- By 2050
- 32,405 · -12.6%
- By 2075
- 28,754 · -22.5%
- By 2100
- 24,110 · -35.0%
Race, ethnicity, and origin ACS 2023
- Neighborhood character
- Predominantly White (88%)
- Race & ethnicity
- White 88% Two or more races 6% Hispanic / Latino 3% Black 2% Asian 1%
- Common ancestry
- Lithuanian 4% Romanian 2% Slovak 2%
- Foreign-born
- 3% · Canada, China
- Languages at home
- 95% English-only · Spanish 2% French/Haitian/Cajun 1% Chinese 1%
Political lean MEDSL · Knox
- 2024 margin
- Solid R (+50.4) · D 24.0% · R 74.4% · Other 1.6%
- 2008→2024 swing
- -43.9pp toward R · 2008: -6.5pp · 2024: -50.4pp
- All cycles
- 2024: R+50.4 2020: R+47.4 2016: R+47.2 2012: R+28.9 2008: R+6.5
Not yet ingested
- Civics
- —
Market trends
- HPI YoY
- ▼ -47.26%
- Current HPI
- 194.903
- Rent YoY
- —
- Metro
- —
- State GDP YoY
- ▲ 2.90%
- F500 in state
- 18
Industry mix (Fortune 500 HQ in IN)
| Industry | F500 HQs | Revenue |
|---|---|---|
| Industrial Machinery | 2 | $37B |
|
||
| Healthcare | 1 | $177B |
|
||
| Pharmaceuticals | 1 | $45B |
|
||
| Metals / Steel | 1 | $18B |
|
||
| Agriculture | 1 | $17B |
|
||
| Packaging | 1 | $12B |
|
||
Price history
-18.5% since first listed3 events — show timeline
- 2026-06-01 Listed $52,900 IRMLS
- 2017-11-13 Sold (MLS) $63,100 IRMLS
- 2017-07-14 Listed $64,900 IRMLS
Property tax history
+1.9%/yrLatest (2024): $1,231 · -1.7% YoY. Source: county tax records.
Cash-flow waterfall
monthlySold comps — $/sqft
last 12 mo · ≤1 miLoading sold comps…