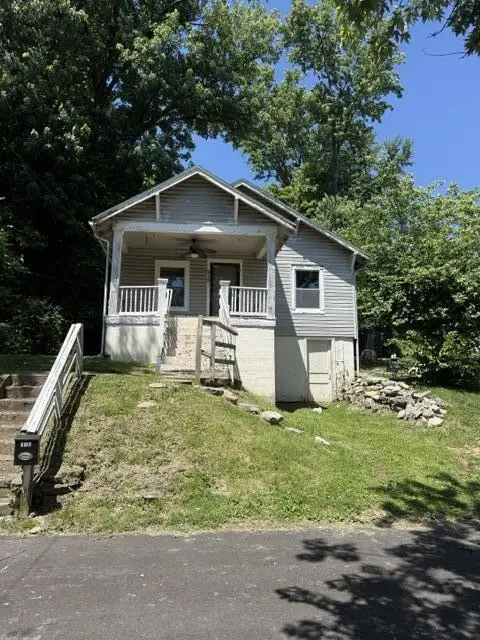
818 1st Ave · Frankfort, KY
Flood risk 1/10 · Minimal
- FEMA flood zone
- X (unshaded)
- Chance of flooding over 30 yrs
- 0.0%
- Est. flood insurance / yr
- $473 – $860
Fire risk 3/10 · Minor
- Est. fire insurance / yr
- $839 – $1,559
Heat risk 5/10 · Moderate
- Hot days now (above 103°F)
- 7 days/yr
- Hot days in 30 yrs
- 20 days/yr
Wind risk 2/10 · Minimal
- Chance of severe wind over 30 yrs
- 1.0%
Air-quality risk 2/10 · Minimal
- Unhealthy air days now
- 1 days/yr
- Unhealthy air days in 30 yrs
- 2 days/yr
Risk factors via First Street. Map © Google.
Why this score? — see what drove the B grade
The composite is a weighted blend of 9 inputs, each scored 0–100. Each bar is that input's sub-score; the figure is the points it added to the 100-point composite (weight × sub-score).
- Cash flow +30.0/30.0
- 1% rule +10.0/10.0
- DSCR +10.0/10.0
- ARV discount +7.5/15.0
- Rent growth +4.1/5.0
- Livability +3.7/5.0
- Schools +2.7/10.0
- Condition / age +2.5/5.0
- Appreciation +0.0/10.0
$70,000
🖨 Deal sheet (PDF) 📄 Offer letter ✓ Due diligence
Listing remarks MLS
Investors... These tenants are long term and are not going anywhere! Own 2 duplexes and 2 houses all on same street for a great price. Properties are in good condition and leased out! Cash flow! Addresses are 313, 814, 818,820 818 1st ave Holmes St Frankfort KY 40601 Because of Covid and tenants we wont be doing showings without offers. However we have pictures for each unit and each room and all the information needed to make a offer.
Key facts
- 1.04 acre lot
- Built 1973
- Listed 10 days
Property features AI
Finance
- Other: Lot about 1.035 acres (public records)
Exterior
- Utilities: Public sewer
- Home design: House; One story
- Construction: Wood siding; Block foundation; Shingle roof; Building area approximately 840
- Exterior features: Public water; Not on waterfront
Interior
- Bedrooms: 2 total rooms (includes bedrooms and living areas)
- Flooring: Wood flooring
- Bathrooms: 1 full bathroom
- Heating & cooling: Natural gas heating
- Interior features: Wood flooring; Unfinished basement; No fireplace
Neighborhood map
What this means for you Summary
Snapshot
- This is a 2-bed/1.0-bath single-family listed at $70k.
Deal economics
- At list price, monthly cash flow is $380 ($5k/yr) — positive.
- The deal already cash-flows at list — no discount required.
- Meets the 1% rule at list price ($1k rent vs $70k).
- Cap rate 12.8% vs local median 3.3% in Frankfort — top-decile yield for the area; either an underpriced asset or a hidden risk that comps aren't pricing in. Stress-test before assuming the spread holds.
Location & tenants
- Location reads 74/100 on livability (#111 in KY, #4,772 nationally) — a middle-class / working-renter tenant base. Strengths: cost of living A+, housing A+, crime B; Watch: employment C-, schools D, amenities F.
- Franklin County (town): math 25% / reading 37% proficiency, ranked #89 of 165 in KY (top 54%) — families likely to look elsewhere, expect single-tenant / working-renter base with shorter leases.
- Market conditions: Rents rising fast (+6.5%/yr); 303 active listings in the ZIP; 4 comparable units currently listed for rent nearby; rentals lingering (median 45d on market — plan ~5-8 weeks vacancy on turnover, expect pricing pressure); 75% of comp listings sitting > 30 days — soft ceiling on asking rent; 123 units permitted in Franklin County in 2024 (0 in 5+ unit buildings).
Forward outlook
- Local home prices are declining (-3.0%/yr); year-one equity from $484 of loan paydown is wiped out by about $2k of value loss. Plan a longer hold.
- Franklin County population projected at +7% by 2050 — modest demand growth; plan on rents tracking national, not racing it.
- At projected returns (-3.0% appreciation + 6.5% rent growth), your $20k cash investment doubles in ~5 years — after that, you're playing with house money.
Negotiation context
- Only 10 days on market — expect competitive offers; lowballing is unlikely to land.
- 6 sale attempts since 14y ago with the ask held roughly flat each time — persistent listings suggest the price (not the market) is what's stuck; bring a comps-based counter.
Risks & watch-outs
- Climate carrying-cost: extreme-heat days projected 7→20/yr by 2055 (HVAC capex compounding) — expect insurance premiums to compound above CPI over the hold.
Questions for the listing agent
- Built in 1973 — when were the roof, HVAC, electrical panel, plumbing, and water heater last replaced?
- Is there a deadline driving the sale (1031 exchange, divorce, estate, relocation)? That informs how much negotiation room exists.
- Schools are D-rated, which usually means shorter tenancies and higher turnover. Who's the typical renter profile here, and what's been the actual vacancy rate?
- What's the average days-on-market for RENTAL listings here right now (not sales)? A rising rental-DOM trend means longer vacancies and softer asking-rent achievability than the comps imply.
- What's the recent tenant-quality profile in this submarket — average credit score on applications, eviction rate, late-payment / NSF rate, and stable-employment percentage? A property-management company in the area should have these aggregated.
- How much new for-sale + rental construction is in the pipeline within 1–3 miles? Heavy new supply typically softens prices + rents 12–24 months out; constrained supply supports both.
Investment metrics
- 1% rule
- 1.50% ✓
- Cap rate
- 12.80%
- Cash-on-cash
- 23.24%
- DSCR
- 2.03
- GRM
- 5.5
CMA / ARV
- ARV (on-the-fly)
- $146,160
- Comps found
- 10
Show comp detail 10 sales within ~0.75 mi
| Address | Dist | Beds/Ba | Sqft | Sold | Price | $/sf | Match |
|---|---|---|---|---|---|---|---|
| 903 Grant St | 0.14mi | 2/1.0 | 889 (+6%) | 4mo | $155,000 | $174 | 81 |
| 504 Mccreary Ave | 0.33mi | 2/1.0 | 832 (-1%) | 20mo | $150,000 | $180 | 67 |
| 104 Spring St | 0.42mi | 3/1.0 (+1) | 875 (+4%) | 3mo | $78,000 | $89 | 66 |
| 111 Willow St | 0.44mi | 3/1.0 (+1) | 875 (+4%) | 3mo | $73,000 | $83 | 65 |
| 404 Noel Ave | 0.33mi | 2/1.0 | 872 (+4%) | 16mo | $172,000 | $197 | 65 |
| 304 Noel Ave | 0.28mi | 2/1.0 | 946 (+13%) | 8mo | $165,000 | $174 | 60 |
| 105 Maple Ave | 0.72mi | 2/1.0 | 858 (+2%) | 9mo | $90,000 | $105 | 55 |
| 834 Fifth Ave | 0.28mi | 2/1.5 | 950 (+13%) | 12mo | $142,500 | $150 | 52 |
| 137 Allnutt Dr | 0.65mi | 2/1.0 | 936 (+11%) | 8mo | $165,000 | $176 | 44 |
| 698 Fairview Ave | 0.70mi | 2/1.0 | 900 (+7%) | 23mo | $165,000 | $183 | 36 |
Match score weights: distance 35% · size 25% · config 20% · recency 20%. Top-matched comps best support the ARV.
Projected returns pro-forma
-3.0% appreciation · 6.55% rent growth · sell at horizon
- IRR
- 20.1%
- Equity multiple
- 1.85×
- Total profit
- $16,718
- Equity at exit
- $10,437
- IRR
- 30.6%
- Equity multiple
- 4.21×
- Total profit
- $62,842
- Equity at exit
- $6,052
Cash invested: $19,600 (down + closing). Projections, not guarantees.
Landlord ↔ Tenant lean methodology
- Overall (STATE)
- 83 Strongly Landlord-Friendly
- State Kentucky
- 83 Strongly Landlord-Friendly · R+16
- County
- — inherits STATE
- City
- — inherits STATE
ZIP-level market 40601
- Home prices YoY
- -26.1%
- Rents YoY
- 6.5%
- Active inventory
- 303
- Price-to-rent
- 5.5×
Monthly cashflow live
- Estimated rent
- $1,052 medium interval (Pro) →
- Mortgage (P&I)
- −$367
- Tax from tax record
- −$55 /mo · $659/yr
- Insurance
- −$29
- HOA
- −$0
- Vacancy / Maint / Mgmt
- −$221
- Net cashflow
- $380
Break-even live
Sensitivity live
| Price | -10% $419 | -5% $399 | +0% $380 | +5% $360 | +10% $340 |
|---|---|---|---|---|---|
| Rent | -10% $296 | -5% $338 | +0% $380 | +5% $421 | +10% $463 |
| Rate | -1.0pp $415 | -0.5pp $397 | base $380 | +0.5pp $361 | +1.0pp $343 |
UW: 25.0% down · 7.5% · 30yr · 1.5% tax · 5.0% vac · 8.0% maint · 8.0% mgmt
Financing live
Cash to close
- Down payment
- $17,500
- Closing costs
- $2,100
- Reserves months
- —
- Total cash needed
- —
Loan-product check · same deal, 3 products live
Conventional
25% down · 7.5% · 30yr
- Down + closing
- —
- Monthly P&I
- —
- Monthly cashflow
- —
- DSCR
- —
- Eligible?
- —
Personal DTI + credit; lowest rate.
DSCR
20% down · 8.5% · 30yr
- Down + closing
- —
- Monthly P&I
- —
- Monthly cashflow
- —
- DSCR
- —
- Eligible?
- —
No personal income docs; deal must DSCR.
Hard money
10% down · 12.0% · 12mo
- Down + closing
- —
- Monthly P&I
- —
- Monthly cashflow
- —
- DSCR
- —
- Eligible?
- —
Short-term bridge; refi at stabilization.
Rent comps 4 comps
| Address | Beds | Baths | Sqft | Rent | $/sqft | DOM | Units | Dist |
|---|---|---|---|---|---|---|---|---|
| 101 Compton Dr Frankfort, KY | 2.0 | 1.0 | 500 | $930 | $1.86 | 44d | 9 | 0.42mi |
| 565 Schenkel Ln Frankfort, KY | 2.0–3.0 | 1.0–2.0 | 987 | $877 | $0.89 | 14d | 8 | 0.67mi |
| 315 Bypass Plaza Dr Frankfort, KY | 2.0–3.0 | 1.0–2.0 | 825 | $1,049 | $1.27 | 44d | 2 | 0.79mi |
| 720 Ridgeview Dr Frankfort, KY | 2.0 | 1.0–2.0 | 576 | $1,170 | $2.03 | 44d | 11 | 1.12mi |
Listing history 27 events
-
2026-06-09status $70,000 Pending 10 DOM
-
2026-06-08days on market $70,000 Active 10 DOM
-
2026-06-07days on market $70,000 Active 9 DOM
-
2026-06-05days on market $70,000 Active 6 DOM
-
2026-06-03days on market $70,000 Active 5 DOM
-
2026-06-02statusdays on market $70,000 Active 4 DOM
-
2026-05-21status Pending
-
2026-05-15$70,000 Active
-
2021-04-05soldstatus $250,000
-
2021-03-22soldstatus $250,000 Sold 439-char remark
Show marketing remark (439 chars)
Investors... These tenants are long term and are not going anywhere! Own 2 duplexes and 2 houses all on same street for a great price. Properties are in good condition and leased out! Cash flow! Addresses are 313, 814, 818,820 818 1st ave Holmes St Frankfort KY 40601 Because of Covid and tenants we wont be doing showings without offers. However we have pictures for each unit and each room and all the information needed to make a offer.
-
2021-02-24status Pending 439-char remark
Show marketing remark (439 chars)
Investors... These tenants are long term and are not going anywhere! Own 2 duplexes and 2 houses all on same street for a great price. Properties are in good condition and leased out! Cash flow! Addresses are 313, 814, 818,820 818 1st ave Holmes St Frankfort KY 40601 Because of Covid and tenants we wont be doing showings without offers. However we have pictures for each unit and each room and all the information needed to make a offer.
-
2021-02-15status Active 439-char remark
Show marketing remark (439 chars)
Investors... These tenants are long term and are not going anywhere! Own 2 duplexes and 2 houses all on same street for a great price. Properties are in good condition and leased out! Cash flow! Addresses are 313, 814, 818,820 818 1st ave Holmes St Frankfort KY 40601 Because of Covid and tenants we wont be doing showings without offers. However we have pictures for each unit and each room and all the information needed to make a offer.
-
2021-02-02status Pending 439-char remark
Show marketing remark (439 chars)
Investors... These tenants are long term and are not going anywhere! Own 2 duplexes and 2 houses all on same street for a great price. Properties are in good condition and leased out! Cash flow! Addresses are 313, 814, 818,820 818 1st ave Holmes St Frankfort KY 40601 Because of Covid and tenants we wont be doing showings without offers. However we have pictures for each unit and each room and all the information needed to make a offer.
-
2021-01-23$260,000 Active 439-char remark
Show marketing remark (439 chars)
Investors... These tenants are long term and are not going anywhere! Own 2 duplexes and 2 houses all on same street for a great price. Properties are in good condition and leased out! Cash flow! Addresses are 313, 814, 818,820 818 1st ave Holmes St Frankfort KY 40601 Because of Covid and tenants we wont be doing showings without offers. However we have pictures for each unit and each room and all the information needed to make a offer.
-
2019-08-15soldstatus $212,000
-
2016-08-22soldstatus $53,000
-
2016-05-20soldstatus $38,000
-
2016-02-10price $23,500 424-char remark
Show marketing remark (424 chars)
Investors Dream!! Priced well below October, 2014 appraisal. Take advantage of this great opportunity. AS-IS but inspections are welcome. Pricing includes 818 First Ave AND 814 Holmes St. (Listing # 1521292) Seller wants to bundle 3 properties (4 doors) at less than $100,000! 818 First Ave, 814 Holmes, and Duplex 818-820 Holmes St. All four units are currently rented with a monthly income of $1980 utilities not included.
-
2016-02-04soldstatus $19,000 Sold 424-char remark
Show marketing remark (424 chars)
Investors Dream!! Priced well below October, 2014 appraisal. Take advantage of this great opportunity. AS-IS but inspections are welcome. Pricing includes 818 First Ave AND 814 Holmes St. (Listing # 1521292) Seller wants to bundle 3 properties (4 doors) at less than $100,000! 818 First Ave, 814 Holmes, and Duplex 818-820 Holmes St. All four units are currently rented with a monthly income of $1980 utilities not included.
-
2016-01-01status Pending 424-char remark
Show marketing remark (424 chars)
Investors Dream!! Priced well below October, 2014 appraisal. Take advantage of this great opportunity. AS-IS but inspections are welcome. Pricing includes 818 First Ave AND 814 Holmes St. (Listing # 1521292) Seller wants to bundle 3 properties (4 doors) at less than $100,000! 818 First Ave, 814 Holmes, and Duplex 818-820 Holmes St. All four units are currently rented with a monthly income of $1980 utilities not included.
-
2015-10-01$47,000 Active 424-char remark
Show marketing remark (424 chars)
Investors Dream!! Priced well below October, 2014 appraisal. Take advantage of this great opportunity. AS-IS but inspections are welcome. Pricing includes 818 First Ave AND 814 Holmes St. (Listing # 1521292) Seller wants to bundle 3 properties (4 doors) at less than $100,000! 818 First Ave, 814 Holmes, and Duplex 818-820 Holmes St. All four units are currently rented with a monthly income of $1980 utilities not included.
-
2015-09-28historical
-
2015-08-31price $23,500
-
2015-08-26$23,900 Active
-
2013-01-09historical
-
2012-07-09$42,000
-
1998-02-26soldstatus $28,500
ⓘ Source: listings_history table (triggers on properties + properties_extension) + one-shot
backfill from property_details.listing_events for pre-trigger history.
Tax reassessment forecast KY · Resets to sale price
- Current annual tax
- $659 · $55/mo
- Projected year-2 tax
- $659 · $55/mo
- Expected delta
- $0/yr ($0/mo · 0.0%)
ⓘ Screening estimate from a state-policy table — verify with the county assessor before closing.
Climate risk First Street
- Flood 1/10 Low FEMA zone X (unshaded) · 0% chance over 30 yrs
- Wildfire 3/10 Moderate
- Heat 5/10 Major 7 d/yr ≥103°F today · 20 d/yr by 30 yrs out
- Wind 2/10 Low 100% chance of damaging wind over 30 yrs
- Air quality 2/10 Low 1 unhealthy d/yr today · 2 by 30 yrs out
Nearby sold comps map
Loading sold comps map…
Walkable amenities ~0.75 mi
Loading nearby amenities…
Taxation est. · year 1
- Rental income
- $12,619
- − Mortgage interest
- −$3,921
- − Property taxes
- −$659
- − Insurance
- −$350
- − Repairs & maintenance
- −$1,009
- − Management
- −$1,009
- − Depreciation
- −$2,036
- Taxable income
- $3,633
- Est. tax owed @ 24.0%
- −$872
- After-tax cash flow
- $3,683/yr
For passive investors: Depreciation is non-cash, so a rental often shows a tax loss while cash-flowing — sheltering income. Rental losses are passive: they offset passive income freely, and up to $25,000/yr can offset ordinary (W-2) income if you actively participate and your MAGI is under $100k (phasing out to $0 by $150k); unused losses carry forward. On sale, claimed depreciation is recaptured at up to 25%, and gains may owe capital-gains tax (a 1031 exchange can defer both). Figures are a year-1 estimate at your 24.0% rate — not tax advice; consult a CPA.
Schools (NCES district)
- District
- Franklin County
- NCES district ID
- 2102010
- Math proficiency
- 25% ▼ -15.00%
- Reading proficiency
- 37% ▼ -14.00%
- Median HH income
- $50,879
- Composite
- 27.07/100
- National rank
- #7049
- State rank
- #89 of 165 in KY
Livability — Frankfort
- Score
- 74/100
- State rank
- #111
- US rank
- #4772
Category grades
Schools grade is shown separately in the Schools card above.
Census & demographics
- Census place
- Frankfort, KY
- County
- Franklin County · 51,893 people
- City population
- 51,893
- Metro
- Frankfort, KY
- Population (ZIP)
- 51,893
- Household income
- $65,732
- Rent vs Own
- Severe rent burden
- 1621.0
Population outlook (Franklin County) Hauer SSP2
- Today (2025)
- 52,996 people
- By 2030
- 54,049 · +2.0%
- By 2040
- 55,561 · +4.8%
- By 2050
- 56,677 · +6.9%
- By 2075
- 59,458 · +12.2%
- By 2100
- 58,885 · +11.1%
Race, ethnicity, and origin ACS 2023
- Neighborhood character
- Predominantly White (81%)
- Race & ethnicity
- White 81% Black 9% Two or more races 5% Hispanic / Latino 4% Asian 2%
- Common ancestry
- Italian 3% Slovak 2% Lithuanian 1%
- Foreign-born
- 4% · Canada
- Languages at home
- 94% English-only · Spanish 3% Other Asian/Pacific 1% Tagalog/Filipino 1%
Political lean MEDSL · Franklin
- 2024 margin
- Toss-up / Even · D 46.6% · R 51.4% · Other 2.0%
- 2008→2024 swing
- -4.2pp toward R · 2008: -0.6pp · 2024: -4.8pp
- All cycles
- 2024: R+4.8 2020: R+0.9 2016: R+4.6 2012: D+0.8 2008: R+0.6
Not yet ingested
- Civics
- —
Market trends
- HPI YoY
- ▼ -87.43%
- Current HPI
- 248.0324
- Rent YoY
- ▲ 6.55%
- Metro
- Frankfort, KY
- State GDP YoY
- ▲ 1.81%
- F500 in state
- 4
Industry mix (Fortune 500 HQ in KY)
| Industry | F500 HQs | Revenue |
|---|---|---|
| Healthcare | 1 | $118B |
|
||
| Food / Beverage | 1 | $7B |
|
||
Price history
+145.6% since first listed21 events — show timeline
- 2026-05-21 Pending — ImagineMLS
- 2026-05-15 Listed $70,000 ImagineMLS
- 2021-04-05 Sold (Public Records) $250,000 Public Records
- 2021-03-22 Sold (MLS) $250,000 ImagineMLS
- 2021-02-24 Pending — ImagineMLS
- 2021-02-15 Relisted — ImagineMLS
- 2021-02-02 Pending — ImagineMLS
- 2021-01-23 Listed $260,000 ImagineMLS
- 2019-08-15 Sold (Public Records) $212,000 Public Records
- 2016-08-22 Sold (Public Records) $53,000 Public Records
- 2016-05-20 Sold (Public Records) $38,000 Public Records
- 2016-02-10 Price Changed $23,500 ImagineMLS
- 2016-02-04 Sold (MLS) $19,000 ImagineMLS
- 2016-01-01 Pending — ImagineMLS
- 2015-10-01 Listed $47,000 ImagineMLS
- 2015-09-28 Listing Removed — ImagineMLS
- 2015-08-31 Price Changed $23,500 ImagineMLS
- 2015-08-26 Listed $23,900 ImagineMLS
- 2013-01-09 Listing Removed — ImagineMLS
- 2012-07-09 Listed $42,000 ImagineMLS
- 1998-02-26 Sold (Public Records) $28,500 Public Records
Property tax history
+3.2%/yrLatest (2025): $659 · +1.3% YoY. Source: county tax records.
Cash-flow waterfall
monthlySold comps — $/sqft
last 12 mo · ≤1 miLoading sold comps…