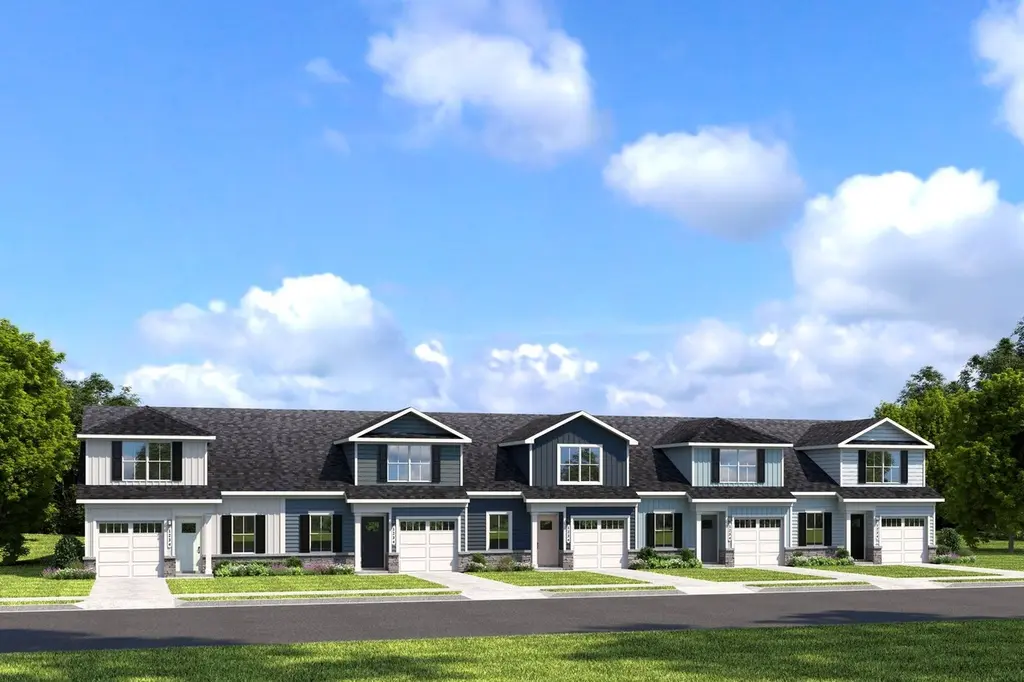
1528A Compass Dr · Bridgeville, DE
Flood risk 1/10 · Minimal
- FEMA flood zone
- X (unshaded)
- Chance of flooding over 30 yrs
- 0.0%
- Est. flood insurance / yr
- $473 – $860
Fire risk 1/10 · Minimal
- Est. fire insurance / yr
- $476 – $884
Heat risk 8/10 · Major
- Hot days now (above 105°F)
- 7 days/yr
- Hot days in 30 yrs
- 15 days/yr
Wind risk 6/10 · Moderate
- Chance of severe wind over 30 yrs
- 68.0%
Air-quality risk 2/10 · Minimal
- Unhealthy air days now
- 1 days/yr
- Unhealthy air days in 30 yrs
- 1 days/yr
Risk factors via First Street. Map © Google.
Why this score? — see what drove the C grade
The composite is a weighted blend of 9 inputs, each scored 0–100. Each bar is that input's sub-score; the figure is the points it added to the 100-point composite (weight × sub-score).
- Cash flow +16.0/30.0
- ARV discount +15.0/15.0
- Appreciation +5.6/10.0
- DSCR +4.9/10.0
- Condition / age +4.8/5.0
- 1% rule +4.4/10.0
- Livability +3.2/5.0
- Rent growth +2.5/5.0
- Schools +2.2/10.0
$259,990
🖨 Deal sheet 📄 Offer letter ✓ Due diligence
Listing remarks
Discover this Dunmore at The Villas at Heritage Shores, ready for an August 2026 move-in! Situated on a desirable corner homesite, this end home offers added privacy with no rear neighbors. Inside, enjoy linen cabinetry, quartz countertops, upgraded finishes, and included appliances with a refrigerator. Luxury vinyl plank flooring flows throughout the main living areas, while the tiled owner's shower and rare third full bath offer comfort and convenience. Designed for effortless main-level living, the open-concept kitchen with a spacious island overlooks a bright great room, creating a comfortable space for both everyday living and entertaining. Upgraded cabinetry and modern finishes add st
Key facts
- Quartz countertops
- Corner homesite
- No rear neighbors
Tags
Property features AI
Finance
- Other: Address: 1528A Compass Dr, Bridgeville DE 19933; Listing provided by Zillow (information deemed reliable but not guaranteed)
- Financial info: List price $259,990
Exterior
- Parking: 1-car garage (1 total parking space)
- Utilities: Central air conditioning
- Home design: Spec home, floor plan named Dunmore; Active listing
- Exterior features: Living area of 1,452
Interior
- Bedrooms: 3 bedrooms
- Bathrooms: 3 full bathrooms
- Heating & cooling: Central air conditioning
- Interior features: Central air conditioning
Neighborhood map
What this means for you Summary
Snapshot
- This is a 3-bed/3.0-bath townhouse listed at $260k. Condition is rated excellent.
Deal economics
- At list price, monthly cash flow is $127 ($2k/yr) — positive.
- The deal already cash-flows at list — no discount required.
- To meet the 1% rule (rent ≥ 1% of price), the offer needs to be $243k (6.4% below list).
- Recommended offer: $243k (6.4% below list) — sets the bar for 1% rule.
- Cap rate 6.9% vs local median 3.7% in Bridgeville — top-decile yield for the area; either an underpriced asset or a hidden risk that comps aren't pricing in. Stress-test before assuming the spread holds.
Location & tenants
- Location reads 64/100 on livability (#48 in DE) — a middle-class / working-renter tenant base. Strengths: health & safety A, crime B; Watch: schools F, amenities F, commute F.
- Woodbridge School District (rural): math 17% / reading 34% proficiency, ranked #21 of 26 in DE (top 81%) — low school quality limits family demand, transient renter base, plan for 1-2y turnover.
- Market conditions: 108 active listings in the ZIP; 3 comparable units currently listed for rent nearby; rentals lingering (median 44d on market — plan ~5-8 weeks vacancy on turnover, expect pricing pressure); 67% of comp listings sitting > 30 days — soft ceiling on asking rent; 4,354 units permitted in Sussex County in 2024 (344 in 5+ unit buildings).
Forward outlook
- In year one you build about $5k of equity ($2k loan paydown + $3k appreciation (1.1% local appreciation)).
- Sussex County population projected at +25% by 2050 — long-run rental-demand tailwind backs the buy-and-hold thesis.
- At projected returns (1.1% appreciation + 3.0% rent growth), your $73k cash investment doubles in ~9 years — after that, you're playing with house money.
- By year 7, paydown + projected appreciation supports a ~$32k cash-out refi (75% LTV) — recoverable capital for the next deal without selling this one.
Negotiation context
- Only 9 days on market — expect competitive offers; lowballing is unlikely to land.
Risks & watch-outs
- Climate carrying-cost: major wind risk, 68% chance of damaging wind over 30y; extreme-heat days projected 7→15/yr by 2055 (HVAC capex compounding) — expect insurance premiums to compound above CPI over the hold.
Questions for the listing agent
- Is there a deadline driving the sale (1031 exchange, divorce, estate, relocation)? That informs how much negotiation room exists.
- Schools are F-rated, which usually means shorter tenancies and higher turnover. Who's the typical renter profile here, and what's been the actual vacancy rate?
- What's the average days-on-market for RENTAL listings here right now (not sales)? A rising rental-DOM trend means longer vacancies and softer asking-rent achievability than the comps imply.
- What's the recent tenant-quality profile in this submarket — average credit score on applications, eviction rate, late-payment / NSF rate, and stable-employment percentage? A property-management company in the area should have these aggregated.
- How much new for-sale + rental construction is in the pipeline within 1–3 miles? Heavy new supply typically softens prices + rents 12–24 months out; constrained supply supports both.
Investment metrics
- 1% rule
- 0.94% ✗
- Cap rate
- 6.88%
- Cash-on-cash
- 2.09%
- DSCR
- 1.09
- GRM
- 8.9
CMA / ARV
- ARV (on-the-fly)
- $328,152
- Comps found
- 11
Show comp detail 11 sales within ~0.75 mi
| Address | Dist | Beds/Ba | Sqft | Sold | Price | $/sf | Match |
|---|---|---|---|---|---|---|---|
| 387 Heritage Shores Cir | 0.18mi | 2/2.0 (-1) | 1,449 (-0%) | 11mo | $349,990 | $242 | 73 |
| 399 Heritage Shores Cir | 0.14mi | 2/2.0 (-1) | 1,500 (+3%) | 11mo | $380,000 | $253 | 70 |
| 303 Waterside Sq | 0.18mi | 2/2.0 (-1) | 1,449 (-0%) | 20mo | $364,200 | $251 | 66 |
| 391 Heritage Shores Cir | 0.17mi | 2/2.0 (-1) | 1,500 (+3%) | 16mo | $339,590 | $226 | 65 |
| 305 Waterside Sq | 0.17mi | 2/2.0 (-1) | 1,449 (-0%) | 23mo | $345,700 | $239 | 64 |
| 66 Whistling Duck Dr | 0.37mi | 2/2.0 (-1) | 1,464 (+1%) | 10mo | $345,000 | $236 | 64 |
| 301 Waterside Sq | 0.19mi | 2/2.0 (-1) | 1,500 (+3%) | 22mo | $330,690 | $220 | 59 |
| 98 Whistling Duck Dr | 0.50mi | 2/2.0 (-1) | 1,602 (+10%) | 8mo | $330,000 | $206 | 44 |
| 30 White Pelican Ct | 0.53mi | 2/2.0 (-1) | 1,605 (+10%) | 11mo | $285,000 | $178 | 40 |
| 34 White Pelican Ct | 0.53mi | 2/2.0 (-1) | 1,645 (+13%) | 6mo | $305,000 | $185 | 39 |
| 64 Whistling Duck Dr | 0.36mi | 2/2.0 (-1) | 1,658 (+14%) | 17mo | $295,000 | $178 | 37 |
Match score weights: distance 35% · size 25% · config 20% · recency 20%. Top-matched comps best support the ARV.
Projected returns pro-forma
1.14% appreciation · 3.0% rent growth · sell at horizon
- IRR
- 4.0%
- Equity multiple
- 1.20×
- Total profit
- $14,774
- Equity at exit
- $90,677
- IRR
- 8.3%
- Equity multiple
- 2.02×
- Total profit
- $74,464
- Equity at exit
- $122,002
Cash invested: $72,797 (down + closing). Projections, not guarantees.
Landlord ↔ Tenant lean methodology
- Overall (STATE)
- 70 Landlord-Friendly
- State Delaware
- 70 Landlord-Friendly · D+7
- County
- — inherits STATE
- City
- — inherits STATE
ZIP-level market 19933
- Home prices YoY
- 0.4%
- Active inventory
- 108
- Price-to-rent
- 8.9×
Monthly cashflow live
- Estimated rent
- $2,435 medium interval (Pro) →
- Mortgage (P&I)
- −$1,363
- Tax est. 1.5%
- −$325 /mo · $3,900/yr
- Insurance
- −$108
- HOA
- −$0
- Vacancy / Maint / Mgmt
- −$511
- Net cashflow
- $127
Break-even live
UW: 25.0% down · 7.5% · 30yr · 1.5% tax · 5.0% vac · 8.0% maint · 8.0% mgmt
Financing live
Cash to close
- Down payment
- $64,998
- Closing costs
- $7,800
- Reserves months
- —
- Total cash needed
- —
Loan-product check · same deal, 3 products live
Conventional
25% down · 7.5% · 30yr
- Down + closing
- —
- Monthly P&I
- —
- Monthly cashflow
- —
- DSCR
- —
- Eligible?
- —
Personal DTI + credit; lowest rate.
DSCR
20% down · 8.5% · 30yr
- Down + closing
- —
- Monthly P&I
- —
- Monthly cashflow
- —
- DSCR
- —
- Eligible?
- —
No personal income docs; deal must DSCR.
Hard money
10% down · 12.0% · 12mo
- Down + closing
- —
- Monthly P&I
- —
- Monthly cashflow
- —
- DSCR
- —
- Eligible?
- —
Short-term bridge; refi at stabilization.
Rent comps 3 comps
| Address | Beds | Baths | Sqft | Rent | $/sqft | DOM | Units | Dist |
|---|---|---|---|---|---|---|---|---|
| 377 Waterside Sq Bridgeville, DE | 3.0 | 2.5 | 1253 | $2,500 | $2.00 | 43d | 1 | 0.27mi |
| 501 Branch Run Rd Bridgeville, DE | 2.0–3.0 | 2.5–3.5 | 1635 | $2,595 | $1.59 | 13d | 12 | 0.76mi |
| 23613 Linkside Dr Bridgeville, DE | 3.0 | 2.0 | 1650 | $2,000 | $1.21 | 43d | 1 | 0.96mi |
Listing history 8 events
-
2026-06-18days on market $259,990 Active 9 DOM
-
2026-06-17days on market $259,990 Active 8 DOM
-
2026-06-16days on market $259,990 Active 7 DOM
-
2026-06-15days on market $259,990 Active 6 DOM
-
2026-06-13days on market $259,990 Active 4 DOM
-
2026-06-12days on market $259,990 Active 3 DOM
-
2026-06-09remarks 699-char remark
-
2026-06-09$259,990 Active 1 DOM
ⓘ Source: listings_history table (triggers on properties + properties_extension) + one-shot
backfill from property_details.listing_events for pre-trigger history.
Climate risk First Street
- Flood 1/10 Low FEMA zone X (unshaded) · 0% chance over 30 yrs
- Wildfire 1/10 Low
- Heat 8/10 Severe 7 d/yr ≥105°F today · 15 d/yr by 30 yrs out
- Wind 6/10 Major 68% chance of damaging wind over 30 yrs
- Air quality 2/10 Low 1 unhealthy d/yr today · 1 by 30 yrs out
Nearby sold comps map
Loading sold comps map…
Walkable amenities ~0.75 mi
Loading nearby amenities…
Taxation est. · year 1
- Rental income
- $29,217
- − Mortgage interest
- −$14,563
- − Property taxes
- −$3,900
- − Insurance
- −$1,300
- − Repairs & maintenance
- −$2,337
- − Management
- −$2,337
- − Depreciation
- −$7,563
- Taxable loss
- −$2,785
- Est. tax savings @ 24.0%
- +$668
- After-tax cash flow
- $2,189/yr
For passive investors: Depreciation is non-cash, so a rental often shows a tax loss while cash-flowing — sheltering income. Rental losses are passive: they offset passive income freely, and up to $25,000/yr can offset ordinary (W-2) income if you actively participate and your MAGI is under $100k (phasing out to $0 by $150k); unused losses carry forward. On sale, claimed depreciation is recaptured at up to 25%, and gains may owe capital-gains tax (a 1031 exchange can defer both). Figures are a year-1 estimate at your 24.0% rate — not tax advice; consult a CPA.
Condition & rehab AI · 5 photos
This move-in-ready townhouse is in excellent condition with modern finishes and upgrades, making it an ideal investment property.
Value-add opportunities
- Both Landscaping and curb appeal improvements — Enhances curb appeal and can attract more buyers or renters.
- Both Add smart home features — Improves convenience and can be a selling point for buyers and renters.
- Both Install smart thermostat — Saves energy and can be a selling point for buyers and renters.
Renovation cost estimate screening
Value-add ROI direction
- Both Landscaping and curb appeal improvements — Enhances curb appeal and can attract more buyers or renters. ↑
- Both Add smart home features — Improves convenience and can be a selling point for buyers and renters. ↑
- Both Install smart thermostat — Saves energy and can be a selling point for buyers and renters. ↑
ⓘ Cost ranges are severity-bucket heuristics (US national rule-of-thumb). Get contractor quotes + a written scope before underwriting a rehab budget.
Schools (NCES district)
- District
- Woodbridge School District
- NCES district ID
- 1001850
- Math proficiency
- 17% ▼ -14.00%
- Reading proficiency
- 34% ▼ -5.00%
- Median HH income
- $48,711
- Composite
- 22.28/100
- National rank
- #8137
- State rank
- #21 of 26 in DE
Livability — Bridgeville
- Score
- 64/100
- State rank
- #48
- US rank
- #13807
Category grades
Schools grade is shown separately in the Schools card above.
Census & demographics
- Census place
- Bridgeville, DE
- City population
- 11,409
- Population (ZIP)
- 11,409
Population outlook (Sussex County) Hauer SSP2
- Today (2025)
- 248,853 people
- By 2030
- 264,464 · +6.3%
- By 2040
- 290,980 · +16.9%
- By 2050
- 311,259 · +25.1%
- By 2075
- 352,488 · +41.6%
- By 2100
- 367,406 · +47.6%
Race, ethnicity, and origin ACS 2023
- Neighborhood character
- Diverse neighborhood (Simpson 0.64)
- Race & ethnicity
- White 52% Hispanic / Latino 22% Black 21% Two or more races 10%
- Hispanic origin (detail)
- Mexican 9% Puerto Rican 2%
- Common ancestry
- Romanian 2% Hispanic 2% Slovak 1%
- Foreign-born
- 10% · Canada
- Languages at home
- 80% English-only · Spanish 16% French/Haitian/Cajun 3% Other Indo-European 1%
Political lean MEDSL · Sussex
- 2024 margin
- R (+11.0) · D 43.9% · R 54.9% · Other 1.2%
- 2008→2024 swing
- -2.4pp toward R · 2008: -8.6pp · 2024: -11.0pp
- All cycles
- 2024: R+11.0 2020: R+11.2 2016: R+22.0 2012: R+13.0 2008: R+8.6
Not yet ingested
- Civics
- —
Market trends
- HPI YoY
- ▲ 1.14%
- Current HPI
- 283.0199
- Rent YoY
- —
- Metro
- —
- State GDP YoY
- —
- F500 in state
- 0
Cash-flow waterfall
monthlySold comps — $/sqft
last 12 mo · ≤1 miLoading sold comps…