 🏷️ Likely Rental
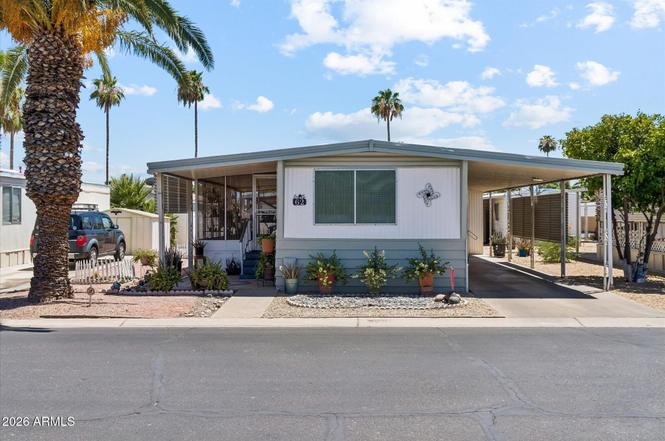
11411 N 91st Ave #62 · Peoria, AZ
Flood risk 1/10 · Minimal
- FEMA flood zone
- X (shaded)
- Chance of flooding over 30 yrs
- 0.0%
- Est. flood insurance / yr
- $507 – $1,088
Fire risk 1/10 · Minimal
- Est. fire insurance / yr
- $610 – $1,132
Heat risk 9/10 · Severe
- Hot days now (above 113°F)
- 6 days/yr
- Hot days in 30 yrs
- 16 days/yr
Wind risk 1/10 · Minimal
- Chance of severe wind over 30 yrs
- —
Air-quality risk 2/10 · Minimal
- Unhealthy air days now
- 1 days/yr
- Unhealthy air days in 30 yrs
- 1 days/yr
Risk factors via First Street. Map © Google.
Why this score? — see what drove the C- grade
The composite is a weighted blend of 9 inputs, each scored 0–100. Each bar is that input's sub-score; the figure is the points it added to the 100-point composite (weight × sub-score).
- Cash flow +15.0/30.0
- ARV discount +15.0/15.0
- 1% rule +5.0/10.0
- DSCR +5.0/10.0
- Livability +3.8/5.0
- Schools +3.5/10.0
- Rent growth +2.7/5.0
- Condition / age +2.5/5.0
- Appreciation +0.0/10.0
$30,000
🖨 Deal sheet 📄 Offer letter ✓ Due diligence
Listing remarks MLS
Cozy, clean home in 55+ retirement mobile home community on leased land. Laminate flooring in the main living area. All furnishings included. Spacious clubhouse, community swimming pool, gated, pet friendly neighborhood. Casa Del Sol Resort West also offers RV sites, and contains a 9-hole pitch and practice green, along with many other entertainment options
Key facts
- Gated community
- Fitness center
- Clubhouse
Tags
Property features AI
Finance
- HOA & community: No association fees; Community amenities include pool, heated community spa, and fitness center
Exterior
- Parking: 2 covered parking spaces; 2 carport spaces
- Security: Gated community
- Utilities: Private sewer; Private water company
- Home design: Manufactured/mobile home; Leasehold ownership; Asphalt road access
- Construction: Aluminum siding; Steel frame construction; Foam roof
- Exterior features: Gravel/stone front yard; Gravel/stone backyard; Storage; Private maintained road
Interior
- Kitchen: Refrigerator; Built-in electric oven; Laminate counters
- Bedrooms: Up to 2 bedrooms (possible)
- Flooring: Vinyl flooring
- Bathrooms: 1 full bathroom
- Heating & cooling: Electric heating; Central air conditioning
- Interior features: High-speed internet available; Eat-in kitchen; Breakfast bar; Laminate countertops; Storage
- Laundry & utility: Laundry located inside
Neighborhood map
What this means for you Summary
Snapshot
- This is a 2-bed/1.0-bath manufactured listed at $30k.
Deal economics
- At list price, monthly cash flow is $1k ($12k/yr) — positive.
- The deal already cash-flows at list — no discount required.
- Meets the 1% rule at list price ($2k rent vs $30k).
- Cap rate 46.9% vs local median 3.3% in Peoria — top-decile yield for the area; either an underpriced asset or a hidden risk that comps aren't pricing in. Stress-test before assuming the spread holds.
Location & tenants
- Location reads 76/100 on livability (#14 in AZ, #3,603 nationally) — a middle-class / working-renter tenant base. Strengths: housing A+, commute A, employment A; Watch: cost of living C-, amenities D, health & safety F.
- Peoria Unified School District (4237) (suburban): math 36% / reading 42% proficiency, ranked #64 of 249 in AZ (top 26%) — families likely to look elsewhere, expect single-tenant / working-renter base with shorter leases.
- Market conditions: Rents flat; 333 active listings in the ZIP; 20 comparable units currently listed for rent nearby; rentals at typical pace (median 17d on market — plan ~3-4 weeks tenant-placement turnaround); 36,011 units permitted in Maricopa County in 2024 (12,801 in 5+ unit buildings).
Forward outlook
- Local home prices are declining (-3.0%/yr); year-one equity from $207 of loan paydown is wiped out by about $900 of value loss. Plan a longer hold.
- Maricopa County population projected at +38% by 2050 — long-run rental-demand tailwind backs the buy-and-hold thesis.
- At projected returns (-3.0% appreciation + 0.6% rent growth), your $8k cash investment doubles in ~1 year — after that, you're playing with house money.
Negotiation context
- Only 8 days on market — expect competitive offers; lowballing is unlikely to land.
- 2 sale attempts since 2y ago with the ask held roughly flat each time — persistent listings suggest the price (not the market) is what's stuck; bring a comps-based counter.
Risks & watch-outs
- Climate carrying-cost: extreme-heat days projected 6→16/yr by 2055 (HVAC capex compounding) — expect insurance premiums to compound above CPI over the hold.
Questions for the listing agent
- Built in 1978 — when were the roof, HVAC, electrical panel, plumbing, and water heater last replaced?
- Is there a deadline driving the sale (1031 exchange, divorce, estate, relocation)? That informs how much negotiation room exists.
- Schools are B-rated — typically a magnet for longer-tenancy family renters. What's the average tenant stay here, and is there a school-zone premium baked into asking?
- What's the average days-on-market for RENTAL listings here right now (not sales)? A rising rental-DOM trend means longer vacancies and softer asking-rent achievability than the comps imply.
- What's the recent tenant-quality profile in this submarket — average credit score on applications, eviction rate, late-payment / NSF rate, and stable-employment percentage? A property-management company in the area should have these aggregated.
- How much new for-sale + rental construction is in the pipeline within 1–3 miles? Heavy new supply typically softens prices + rents 12–24 months out; constrained supply supports both.
Investment metrics
- 1% rule
- 5.16% ✓
- Cap rate
- 46.93%
- Cash-on-cash
- 145.14%
- DSCR
- 7.46
- GRM
- 1.6
CMA / ARV
- ARV (on-the-fly)
- $40,796
- Comps found
- 12
Show comp detail 12 sales within ~0.75 mi
| Address | Dist | Beds/Ba | Sqft | Sold | Price | $/sf | Match |
|---|---|---|---|---|---|---|---|
| 11411 N 91st Ave #28 | 0.00mi | 2/1.0 | 812 (-6%) | 4mo | $27,750 | $34 | 86 |
| 10951 N 91st Ave #224 | 0.16mi | 2/2.0 | 840 (-3%) | 10mo | $40,000 | $48 | 75 |
| 10951 N 91st Ave #177 | 0.16mi | 2/1.5 | 924 (+6%) | 6mo | $37,500 | $41 | 74 |
| 11411 N 91st Ave #215 | 0.00mi | 2/2.0 | 966 (+11%) | 4mo | $12,000 | $12 | 74 |
| 11411 N 91st Ave #131 | 0.00mi | 2/2.0 | 980 (+13%) | 4mo | $46,000 | $47 | 71 |
| 10810 N 91st Ave #45 | 0.36mi | 3/2.0 (+1) | 896 (+3%) | 3mo | $80,000 | $89 | 67 |
| 11411 N 91st Ave #9 | 0.00mi | 2/1.8 | 980 (+13%) | 12mo | $6,500 | $7 | 65 |
| 10951 N 91st Ave #216 | 0.16mi | 2/2.0 | 980 (+13%) | 6mo | $82,000 | $84 | 62 |
| 11411 N 91st Ave #48 | 0.16mi | 2/2.0 | 980 (+13%) | 8mo | $14,000 | $14 | 61 |
| 11000 N 91st Ave #84 | 0.25mi | 3/1.0 (+1) | 980 (+13%) | 4mo | $60,000 | $61 | 58 |
| 10951 N 91st Ave #206 | 0.23mi | 2/2.0 | 980 (+13%) | 11mo | $62,800 | $64 | 55 |
| 11411 N 91st Ave #229 | 0.20mi | 3/2.0 (+1) | 960 (+11%) | 11mo | $43,000 | $45 | 54 |
Match score weights: distance 35% · size 25% · config 20% · recency 20%. Top-matched comps best support the ARV.
Projected returns pro-forma
-3.0% appreciation · 0.62% rent growth · sell at horizon
- IRR
- —
- Equity multiple
- 7.70×
- Total profit
- $56,249
- Equity at exit
- $4,473
- IRR
- —
- Equity multiple
- 15.07×
- Total profit
- $118,228
- Equity at exit
- $2,594
Cash invested: $8,400 (down + closing). Projections, not guarantees.
Landlord ↔ Tenant lean methodology
- Overall (STATE)
- 87 Strongly Landlord-Friendly
- State Arizona
- 87 Strongly Landlord-Friendly · R+3
- County
- — inherits STATE
- City
- — inherits STATE
ZIP-level market 85345
- Home prices YoY
- -19.8%
- Rents YoY
- 0.6%
- Active inventory
- 333
- Price-to-rent
- 1.6×
Monthly cashflow live
- Estimated rent
- $1,548 high interval (Pro) →
- Mortgage (P&I)
- −$157
- Tax est. 1.5%
- −$38 /mo · $450/yr
- Insurance
- −$12
- HOA
- −$0
- Vacancy / Maint / Mgmt
- −$325
- Net cashflow
- $1,016
Break-even live
UW: 25.0% down · 7.5% · 30yr · 1.5% tax · 5.0% vac · 8.0% maint · 8.0% mgmt
Financing live
Cash to close
- Down payment
- $7,500
- Closing costs
- $900
- Reserves months
- —
- Total cash needed
- —
Loan-product check · same deal, 3 products live
Conventional
25% down · 7.5% · 30yr
- Down + closing
- —
- Monthly P&I
- —
- Monthly cashflow
- —
- DSCR
- —
- Eligible?
- —
Personal DTI + credit; lowest rate.
DSCR
20% down · 8.5% · 30yr
- Down + closing
- —
- Monthly P&I
- —
- Monthly cashflow
- —
- DSCR
- —
- Eligible?
- —
No personal income docs; deal must DSCR.
Hard money
10% down · 12.0% · 12mo
- Down + closing
- —
- Monthly P&I
- —
- Monthly cashflow
- —
- DSCR
- —
- Eligible?
- —
Short-term bridge; refi at stabilization.
Rent comps 20 comps
| Address | Beds | Baths | Sqft | Rent | $/sqft | DOM | Units | Dist |
|---|---|---|---|---|---|---|---|---|
| 11411 N 91st Ave Unit 213 Peoria, AZ | 2.0 | 2.0 | 858 | $1,399 | $1.63 | 24d | 1 | 0.03mi |
| 8821 W Sahuaro Dr Peoria, AZ | 3.0 | 2.0 | 1074 | $1,595 | $1.49 | 2d | 1 | 0.28mi |
| 8821 W Sahuaro Dr Peoria, AZ | 3.0 | 2.0 | 1074 | $1,595 | $1.49 | 24d | 1 | 0.28mi |
| 8757 W Peoria Ave Peoria, AZ | 2.0 | 1.0 | 564 | $1,539 | $2.73 | 3d | 14 | 0.46mi |
| 8650 W Peoria Ave Peoria, AZ | 1.0–2.0 | 1.0–2.0 | 836 | $1,492 | $1.78 | 2d | 19 | 0.50mi |
| 10860 N 85th Ave Peoria, AZ | 2.0 | 1.0 | 780 | $1,225 | $1.57 | 43d | 1 | 0.54mi |
| 10860 N 85th Ave Peoria, AZ | 1.0–2.0 | 1.0 | 630 | $1,350 | $2.14 | 3d | 1 | 0.54mi |
| 10860 N 85th Ave Unit 87 Peoria, AZ | 2.0 | 1.0 | 780 | $1,149 | $1.47 | 5d | 1 | 0.55mi |
| 8560 W Peoria Ave Peoria, AZ | 2.0 | 1.0 | 888 | $1,450 | $1.63 | 1d | 8 | 0.56mi |
| 11429 N 83rd Ave #2 Peoria, AZ | 1.0 | 1.0 | 750 | $1,100 | $1.47 | 24d | 1 | 0.87mi |
| 10701 N 99th Ave Unit 230 Peoria, AZ | 2.0 | 2.0 | 784 | $1,099 | $1.40 | 20d | 1 | 0.99mi |
| 8280 W Madison St Peoria, AZ | 2.0 | 2.0 | 800 | $1,400 | $1.75 | 43d | 1 | 1.00mi |
| 10104 N 96th Dr Unit A Peoria, AZ | 2.0 | 2.0 | 1072 | $1,750 | $1.63 | 24d | 1 | 1.10mi |
| 12751 N Plaza Del Rio Blvd Peoria, AZ | 1.0–2.0 | 1.0–2.0 | 1007 | $1,890 | $1.88 | 1d | 10 | 1.13mi |
| 10110 N 97th Dr Unit A Peoria, AZ | 2.0 | 1.5 | 1025 | $1,500 | $1.46 | 24d | 1 | 1.19mi |
| 8165 W Whitney Dr Peoria, AZ | 1.0–2.0 | 1.0–2.0 | 911 | $2,223 | $2.44 | 1d | 229 | 1.23mi |
| 8940 W Olive Ave Peoria, AZ | 2.0 | 2.0 | 897 | $1,400 | $1.56 | 16d | 1 | 1.30mi |
| 10822 N Balboa Dr Sun City, AZ | 2.0 | 1.0 | 942 | $3,000 | $3.18 | 24d | 1 | 1.32mi |
| 13310 N Plaza del Rio Blvd Peoria, AZ | 1.0–3.0 | 1.0–2.0 | 981 | $1,556 | $1.59 | 1d | 13 | 1.46mi |
| 9201 N 83rd Ave Peoria, AZ | 1.0–3.0 | 1.0–2.0 | 981 | $1,654 | $1.68 | 1d | 29 | 1.47mi |
Listing history 7 events
-
2026-06-18days on market $30,000 Active 8 DOM
-
2026-06-17days on market $30,000 Active 7 DOM
-
2026-06-16days on market $30,000 Active 6 DOM
-
2026-06-15days on market $30,000 Active 5 DOM
-
2026-06-13days on market $30,000 Active 3 DOM
-
2026-06-13remarks 314-char remark
-
2026-06-13$30,000 Active 2 DOM
ⓘ Source: listings_history table (triggers on properties + properties_extension) + one-shot
backfill from property_details.listing_events for pre-trigger history.
Climate risk First Street
- Flood 1/10 Low FEMA zone X (shaded) · 0% chance over 30 yrs
- Wildfire 1/10 Low
- Heat 9/10 Extreme 6 d/yr ≥113°F today · 16 d/yr by 30 yrs out
- Wind 1/10 Low
- Air quality 2/10 Low 1 unhealthy d/yr today · 1 by 30 yrs out
Nearby sold comps map
Loading sold comps map…
Walkable amenities ~0.75 mi
Loading nearby amenities…
Taxation est. · year 1
- Rental income
- $18,582
- − Mortgage interest
- −$1,680
- − Property taxes
- −$450
- − Insurance
- −$150
- − Repairs & maintenance
- −$1,487
- − Management
- −$1,487
- − Depreciation
- −$873
- Taxable income
- $12,456
- Est. tax owed @ 24.0%
- −$2,989
- After-tax cash flow
- $9,203/yr
For passive investors: Depreciation is non-cash, so a rental often shows a tax loss while cash-flowing — sheltering income. Rental losses are passive: they offset passive income freely, and up to $25,000/yr can offset ordinary (W-2) income if you actively participate and your MAGI is under $100k (phasing out to $0 by $150k); unused losses carry forward. On sale, claimed depreciation is recaptured at up to 25%, and gains may owe capital-gains tax (a 1031 exchange can defer both). Figures are a year-1 estimate at your 24.0% rate — not tax advice; consult a CPA.
Schools (NCES district)
- District
- Peoria Unified School District (4237)
- NCES district ID
- 0406250
- Math proficiency
- 36% ▼ -14.00%
- Reading proficiency
- 42% ▼ -8.00%
- Median HH income
- $60,171
- Composite
- 34.62/100
- National rank
- #5152
- State rank
- #64 of 249 in AZ
Livability — Peoria
- Score
- 76/100
- State rank
- #14
- US rank
- #3603
Category grades
Schools grade is shown separately in the Schools card above.
Census & demographics
- Census place
- Peoria, AZ
- County
- Maricopa County · 4,537,380 people
- City population
- 206,687
- Metro
- Phoenix-Mesa-Chandler, AZ
- Population (ZIP)
- 60,918
- Household income
- $67,380
- Rent vs Own
- Severe rent burden
- 1879.0
Population outlook (Maricopa County) Hauer SSP2
- Today (2025)
- 4,979,203 people
- By 2030
- 5,378,229 · +8.0%
- By 2040
- 6,156,598 · +23.6%
- By 2050
- 6,872,376 · +38.0%
- By 2075
- 8,401,270 · +68.7%
- By 2100
- 9,247,439 · +85.7%
Race, ethnicity, and origin ACS 2023
- Neighborhood character
- Diverse neighborhood (Simpson 0.62)
- Race & ethnicity
- White 51% Hispanic / Latino 34% Two or more races 14% Black 5% Asian 4% Native American 2%
- Hispanic origin (detail)
- Mexican 29%
- Common ancestry
- Romanian 2% Italian 2% Slovak 1%
- Foreign-born
- 13% · Canada, Vietnam
- Languages at home
- 76% English-only · Spanish 18% Other Indo-European 1% Vietnamese 1%
Political lean MEDSL · Maricopa
- 2024 margin
- Toss-up / Even · D 47.7% · R 51.2% · Other 1.1%
- 2008→2024 swing
- +7.1pp toward D · 2008: -10.6pp · 2024: -3.5pp
- All cycles
- 2024: R+3.5 2020: D+2.2 2016: R+3.5 2012: R+12.0 2008: R+10.6
Not yet ingested
- Civics
- —
Market trends
- HPI YoY
- ▼ -80.77%
- Current HPI
- 328.1069
- Rent YoY
- ▲ 0.62%
- Metro
- Phoenix-Mesa-Chandler, AZ
- State GDP YoY
- ▲ 4.54%
- F500 in state
- 20
Industry mix (Fortune 500 HQ in AZ)
| Industry | F500 HQs | Revenue |
|---|---|---|
| Technology | 2 | $13B |
|
||
| Mining / Metals | 1 | $23B |
|
||
| Environmental Services | 1 | $16B |
|
||
| Metals / Steel | 1 | $14B |
|
||
| Technology Distribution | 1 | $9B |
|
||
| Homebuilding | 1 | $8B |
|
||
Price history
-14.3% since first listed5 events — show timeline
- 2026-06-10 Listed $30,000 ARMLS
- 2024-03-15 Sold (MLS) $26,500 ARMLS
- 2024-03-03 Pending — ARMLS
- 2024-02-01 Price Changed $30,000 ARMLS
- 2024-01-04 Listed $35,000 ARMLS
Cash-flow waterfall
monthlySold comps — $/sqft
last 12 mo · ≤1 miLoading sold comps…