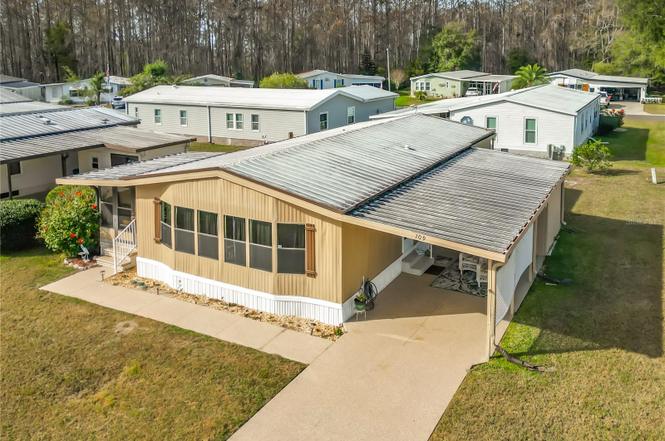
109 Lyonia Ln · Wildwood, FL
Flood risk 1/10 · Minimal
- FEMA flood zone
- AE
- Chance of flooding over 30 yrs
- 0.0%
- Est. flood insurance / yr
- $1,737 – $8,500
Fire risk 4/10 · Minor
- Est. fire insurance / yr
- $947 – $1,759
Heat risk 8/10 · Major
- Hot days now (above 108°F)
- 7 days/yr
- Hot days in 30 yrs
- 22 days/yr
Wind risk 9/10 · Severe
- Chance of severe wind over 30 yrs
- 99.0%
Air-quality risk 2/10 · Minimal
- Unhealthy air days now
- 1 days/yr
- Unhealthy air days in 30 yrs
- 2 days/yr
Risk factors via First Street. Map © Google.
Why this score? — see what drove the B+ grade
The composite is a weighted blend of 9 inputs, each scored 0–100. Each bar is that input's sub-score; the figure is the points it added to the 100-point composite (weight × sub-score).
- Cash flow +30.0/30.0
- ARV discount +15.0/15.0
- 1% rule +10.0/10.0
- DSCR +10.0/10.0
- Schools +5.2/10.0
- Livability +3.5/5.0
- Rent growth +3.2/5.0
- Condition / age +2.5/5.0
- Appreciation +0.0/10.0
$80,000
🖨 Deal sheet (PDF) 📄 Offer letter ✓ Due diligence
Listing remarks
Short Sale. Welcome to this 2-bedroom, 2-bath home in the desirable Continental Country Club. Featuring an oversized living room, roomy kitchen, built-in desk, ample storage, and a relaxing Florida Room, this home is full of potential. An R/O Certificate helps lower monthly HOA fees. Lawn care, garbage, golf maintenence, cable, internet, wifi all included in maintenance. Enjoy resort-style amenities including golf, tennis, pools, dining, and more, all just 5 minutes from Brownwood in The Villages. Call today before it’s gone!
Key facts
- Roomy kitchen
- Florida room
- Built-in desk
Tags
Property features AI
Finance
- Other: Total acreage listed as less than 1/4 acre
- Financial info: No lease restrictions indicated
- HOA & community: Has HOA; monthly fee required (approximately $361.42); Association requires approval; Association amenities include: clubhouse, fitness center, pool, spa/hot tub, tennis courts, pickleball and shuffleboard courts, basketball court, golf course/club access, trails, storage, gated community, 24-hour guard, security, common area maintenance, management, private road, trash, cable TV, internet, escrow reserves; Community features include clubhouse, pool, tennis courts, fitness center, dog park, street lights, deed restrictions, buyer approval required, golf carts allowed, wheelchair access; cats and dogs allowed; Association contact listed
Exterior
- Parking: Carport (1 space)
- Security: Community security features
- Utilities: Public water; Public sewer; Electricity connected; Water connected; Sewer connected; Cable connected; Phone available; Underground utilities
- Home design: Manufactured home (Double wide); One story; East-facing
- Construction: Other construction materials; Metal roof; Roof over; Crawlspace foundation; Built as manufactured home
- Exterior features: Other exterior features; Lake access (Lake Okahumpka); Asphalt road frontage
Interior
- Kitchen: Dishwasher; Microwave; Range; Refrigerator; Electric water heater
- Bedrooms: 2 bedrooms
- Flooring: Carpet; Linoleum
- Bathrooms: 2 full bathrooms
- Heating & cooling: Central heating; Central air conditioning
- Interior features: Ceiling fans; Other interior features
- Laundry & utility: Washer; Dryer; Laundry area outside
Neighborhood map
What this means for you Summary
Snapshot
- This is a 2-bed/2.0-bath manufactured listed at $80k.
Deal economics
- At list price, monthly cash flow is $22 ($262/yr) — positive.
- The deal already cash-flows at list — no discount required.
- Meets the 1% rule at list price ($2k rent vs $80k).
- Recommended offer: $70k (12.0% below list) — sets the bar for market timing.
- Cap rate 13.0% vs local median 3.9% in Wildwood — top-decile yield for the area; either an underpriced asset or a hidden risk that comps aren't pricing in. Stress-test before assuming the spread holds.
Location & tenants
- Location reads 69/100 on livability (#471 in FL) — a middle-class / working-renter tenant base. Strengths: health & safety A+, cost of living A, crime A-; Watch: amenities F, commute F, employment D-.
- Sumter (rural): math 61% / reading 61% proficiency, ranked #11 of 73 in FL (top 15%) — acceptable for families but not a draw, mixed tenant base, ~2y average lease.
- Zoned schools: Wildwood Elementary School (math 49% / reading 52%, grade D+, #1,055 of 2,144 statewide, top 50%, 940 students, 76% FRL); South Sumter Middle School (math 55% / reading 54%, grade B-, #183 of 571 statewide, top 34%, 897 students, 61% FRL) — zoned schools average 68% FRL vs 51% district-wide (18 pts higher); higher-poverty schools than district average — tighter screening recommended.
- Market conditions: Rents rising (+2.9%/yr); 428 active listings in the ZIP; 3 comparable units currently listed for rent nearby; rentals at typical pace (median 23d on market — plan ~3-4 weeks tenant-placement turnaround); 3,961 units permitted in Sumter County in 2024 (248 in 5+ unit buildings).
- This rent runs 30% of the median local income ($66k/yr) — at the standard rent-burdened threshold; future hikes will face affordability resistance.
Forward outlook
- Local home prices are declining (-3.0%/yr); year-one equity from $553 of loan paydown is wiped out by about $2k of value loss. Plan a longer hold.
- Sumter County population projected at +45% by 2050 — long-run rental-demand tailwind backs the buy-and-hold thesis.
Negotiation context
- It's been on market 159 days — a 12% lower offer ($70k) is reasonable based on typical stale-listing flexibility.
- 12 sale attempts since 7y ago; this cycle's ask has dropped $25k (24%) from the opening price — seller is motivated, your offer sets the floor, not the list.
Risks & watch-outs
- Watch-outs: flood insurance adds $427/mo; HOA is 22% of rent.
- Climate carrying-cost: in FEMA flood zone AE (mandatory federal flood insurance); severe wind risk, 99% chance of damaging wind over 30y; extreme-heat days projected 7→22/yr by 2055 (HVAC capex compounding) — expect insurance premiums to compound above CPI over the hold.
Questions for the listing agent
- It's been on market 159 days. Have you received any prior offers? Is the seller open to a 12% concession, seller financing, or rate buy-down credit?
- What's the actual annual flood-insurance premium (NFIP or private), and is the property in a SFHA with mandatory coverage?
- What does the HOA fee cover, when was the last increase, and are there any pending special assessments or reserve-fund shortfalls?
- Why hasn't it sold? Are there any deal-killer items the seller is aware of (foundation, flood, title, zoning, code violations)?
- Is there a deadline driving the sale (1031 exchange, divorce, estate, relocation)? That informs how much negotiation room exists.
- What's the average days-on-market for RENTAL listings here right now (not sales)? A rising rental-DOM trend means longer vacancies and softer asking-rent achievability than the comps imply.
- What's the recent tenant-quality profile in this submarket — average credit score on applications, eviction rate, late-payment / NSF rate, and stable-employment percentage? A property-management company in the area should have these aggregated.
- How much new for-sale + rental construction is in the pipeline within 1–3 miles? Heavy new supply typically softens prices + rents 12–24 months out; constrained supply supports both.
Investment metrics
- 1% rule
- 2.07% ✓
- Cap rate
- 13.02%
- Cash-on-cash
- 24.02%
- DSCR
- 2.07
- GRM
- 4.0
CMA / ARV
- ARV (on-the-fly)
- $125,568
- Comps found
- 12
Show comp detail 12 sales within ~0.75 mi
| Address | Dist | Beds/Ba | Sqft | Sold | Price | $/sf | Match |
|---|---|---|---|---|---|---|---|
| 111 Sugar Maple Ave | 0.09mi | 2/2.0 | 1,152 (0%) | 2mo | $125,000 | $109 | 94 |
| 103 Robin Ln | 0.14mi | 2/2.0 | 1,152 (0%) | 3mo | $59,000 | $51 | 90 |
| 114 Cypress Rd | 0.26mi | 2/2.0 | 1,144 (-1%) | 7mo | $152,600 | $133 | 81 |
| 108 Winterberry Ave | 0.07mi | 2/2.0 | 1,040 (-10%) | 1mo | $70,000 | $67 | 79 |
| 104 Winterberry Ave | 0.08mi | 2/2.0 | 1,248 (+8%) | 6mo | $134,000 | $107 | 78 |
| 102 Robin Ln | 0.17mi | 2/2.0 | 1,040 (-10%) | 4mo | $117,500 | $113 | 72 |
| 600 Oak Blvd | 0.11mi | 2/2.0 | 1,288 (+12%) | 5mo | $140,000 | $109 | 71 |
| 110 Forest Blvd | 0.28mi | 2/2.0 | 1,056 (-8%) | 3mo | $220,000 | $208 | 71 |
| 11 S Bobwhite Rd | 0.64mi | 2/2.0 | 1,152 (0%) | 1mo | $165,000 | $143 | 69 |
| 116 Cypress Rd | 0.26mi | 2/2.0 | 1,040 (-10%) | 5mo | $47,000 | $45 | 67 |
| 1 S Bobwhite Rd | 0.72mi | 2/2.0 | 1,160 (+1%) | 10mo | $110,600 | $95 | 57 |
| 8 S Bobwhite | 0.64mi | 2/2.0 | 1,248 (+8%) | 2mo | $123,450 | $99 | 55 |
Match score weights: distance 35% · size 25% · config 20% · recency 20%. Top-matched comps best support the ARV.
Projected returns pro-forma
-3.0% appreciation · 2.85% rent growth · sell at horizon
- IRR
- -14.1%
- Equity multiple
- 0.49×
- Total profit
- $-11,346
- Equity at exit
- $11,928
- IRR
- -4.8%
- Equity multiple
- 0.68×
- Total profit
- $-7,178
- Equity at exit
- $6,917
Cash invested: $22,400 (down + closing). Projections, not guarantees.
Landlord ↔ Tenant lean methodology
- Overall (STATE)
- 87 Strongly Landlord-Friendly
- State Florida
- 87 Strongly Landlord-Friendly · R+3
- County
- — inherits STATE
- City
- — inherits STATE
ZIP-level market 34785
- Home prices YoY
- -10.7%
- Rents YoY
- 2.9%
- Active inventory
- 428
- Price-to-rent
- 4.0×
Monthly cashflow live
- Estimated rent
- $1,654 medium interval (Pro) →
- Mortgage (P&I)
- −$420
- Tax from tax record
- −$45 /mo · $537/yr
- Insurance
- −$33
- Flood insurance flood zone
- −$427 /mo · $5,118/yr
- HOA
- −$361
- Vacancy / Maint / Mgmt
- −$347
- Net cashflow
- $22
Break-even live
Sensitivity live
| Price | -10% $67 | -5% $44 | +0% $22 | +5% $-1 | +10% $-23 |
|---|---|---|---|---|---|
| Rent | -10% $-109 | -5% $-43 | +0% $22 | +5% $87 | +10% $153 |
| Rate | -1.0pp $62 | -0.5pp $42 | base $22 | +0.5pp $1 | +1.0pp $-20 |
UW: 25.0% down · 7.5% · 30yr · 1.5% tax · 5.0% vac · 8.0% maint · 8.0% mgmt
Financing live
Cash to close
- Down payment
- $20,000
- Closing costs
- $2,400
- Reserves months
- —
- Total cash needed
- —
Loan-product check · same deal, 3 products live
Conventional
25% down · 7.5% · 30yr
- Down + closing
- —
- Monthly P&I
- —
- Monthly cashflow
- —
- DSCR
- —
- Eligible?
- —
Personal DTI + credit; lowest rate.
DSCR
20% down · 8.5% · 30yr
- Down + closing
- —
- Monthly P&I
- —
- Monthly cashflow
- —
- DSCR
- —
- Eligible?
- —
No personal income docs; deal must DSCR.
Hard money
10% down · 12.0% · 12mo
- Down + closing
- —
- Monthly P&I
- —
- Monthly cashflow
- —
- DSCR
- —
- Eligible?
- —
Short-term bridge; refi at stabilization.
Rent comps 3 comps
| Address | Beds | Baths | Sqft | Rent | $/sqft | DOM | Units | Dist |
|---|---|---|---|---|---|---|---|---|
| 21204 Sandalwood Dr Unit 21-204 Wildwood, FL | 2.0 | 2.0 | 1110 | $1,550 | $1.40 | 22d | 1 | 0.32mi |
| 15203 Sandalwood Dr #203 Wildwood, FL | 3.0 | 3.0 | 1474 | $1,550 | $1.05 | 22d | 1 | 0.44mi |
| 5541 Goodman Ct The Villages, FL | 2.0 | 2.0 | 1203 | $1,990 | $1.65 | 22d | 1 | 0.66mi |
HOA detail
- Monthly dues
- $361 · $4,332/yr
- Likely covers
- trashinternetcablelandscapingpool
Listing history 50 events
-
2026-06-22days on market $80,000 Active 159 DOM
-
2026-06-19days on market $80,000 Active 157 DOM
-
2026-06-18days on market $80,000 Active 156 DOM
-
2026-06-17days on market $80,000 Active 155 DOM
-
2026-06-16days on market $80,000 Active 154 DOM
-
2026-06-15days on market $80,000 Active 153 DOM
-
2026-06-14days on market $80,000 Active 151 DOM
-
2026-06-13days on market $80,000 Active 150 DOM
-
2026-06-10days on market $80,000 Active 148 DOM
-
2026-06-09days on market $80,000 Active 147 DOM
-
2026-06-08days on market $80,000 Active 146 DOM
-
2026-06-07days on market $80,000 Active 145 DOM
-
2026-06-02days on market $80,000 Active 140 DOM
-
2026-06-01days on market $80,000 Active 139 DOM
-
2026-05-31days on market $80,000 Active 138 DOM
-
2026-05-30days on market $80,000 Active 137 DOM
-
2026-05-05price $85,000
-
2026-04-23price $90,000
-
2026-04-21price $95,000
-
2026-04-06status Active
-
2026-04-06historical
-
2026-03-06price $98,000
-
2026-02-11price $99,000
-
2026-01-13$105,000 Active
-
2026-01-09status Active
-
2026-01-09historical
-
2026-01-07status Active
-
2026-01-01historical
-
2026-01-01historical
-
2025-12-20price $110,000
-
2025-11-19status Active
-
2025-11-19price $120,000
-
2025-09-08status Pending
-
2025-08-25$125,000 Active
-
2025-08-19historical
-
2025-05-19price $125,000
-
2025-03-24price $143,000
-
2025-01-21$125,000 Active
-
2024-06-19historical
-
2024-06-05$149,300 Active
-
2024-03-25historical
-
2024-01-29status Active
-
2024-01-29price $153,000
-
2024-01-20historical
-
2024-01-12price $157,000
-
2023-10-30status Active
-
2023-10-25historical
-
2023-10-14price $164,900
-
2023-07-26price $169,900
-
2023-07-22$174,900 Active
ⓘ Source: listings_history table (triggers on properties + properties_extension) + one-shot
backfill from property_details.listing_events for pre-trigger history.
Tax reassessment forecast FL · Resets to sale price
- Current annual tax
- $537 · $45/mo
- Projected year-2 tax
- $664 · $55/mo
- Expected delta
- +$127/yr (+$11/mo · 23.7%)
ⓘ Screening estimate from a state-policy table — verify with the county assessor before closing.
Climate risk First Street
- Flood 1/10 Low FEMA zone AE · 0% chance over 30 yrs
- Wildfire 4/10 Moderate
- Heat 8/10 Severe 7 d/yr ≥108°F today · 22 d/yr by 30 yrs out
- Wind 9/10 Extreme 99% chance of damaging wind over 30 yrs
- Air quality 2/10 Low 1 unhealthy d/yr today · 2 by 30 yrs out
Nearby sold comps map
Loading sold comps map…
Walkable amenities ~0.75 mi
Loading nearby amenities…
Taxation est. · year 1
- Rental income
- $19,853
- − Mortgage interest
- −$4,481
- − Property taxes
- −$537
- − Insurance
- −$5,518
- − Repairs & maintenance
- −$1,588
- − Management
- −$1,588
- − HOA
- −$4,332
- − Depreciation
- −$2,327
- Taxable loss
- −$519
- Est. tax savings @ 24.0%
- +$125
- After-tax cash flow
- $387/yr
For passive investors: Depreciation is non-cash, so a rental often shows a tax loss while cash-flowing — sheltering income. Rental losses are passive: they offset passive income freely, and up to $25,000/yr can offset ordinary (W-2) income if you actively participate and your MAGI is under $100k (phasing out to $0 by $150k); unused losses carry forward. On sale, claimed depreciation is recaptured at up to 25%, and gains may owe capital-gains tax (a 1031 exchange can defer both). Figures are a year-1 estimate at your 24.0% rate — not tax advice; consult a CPA.
Schools (NCES district)
- District
- Sumter
- NCES district ID
- 1201800
- Math proficiency
- 61% ▼ -4.00%
- Reading proficiency
- 61% ▼ -2.00%
- Median HH income
- $48,240
- Composite
- 51.74/100
- National rank
- #1682
- State rank
- #11 of 73 in FL
Livability — Wildwood
- Score
- 69/100
- State rank
- #471
- US rank
- #8500
Category grades
Schools grade is shown separately in the Schools card above.
Census & demographics
- County
- Sumter County · 110,591 people
- City population
- 21,568
- Metro
- The Villages, FL
- Population (ZIP)
- 21,568
- Household income
- $66,136
- Rent vs Own
- Severe rent burden
- 730.0
Population outlook (Sumter County) Hauer SSP2
- Today (2025)
- 161,172 people
- By 2030
- 180,083 · +11.7%
- By 2040
- 209,892 · +30.2%
- By 2050
- 234,186 · +45.3%
- By 2075
- 284,602 · +76.6%
- By 2100
- 317,039 · +96.7%
Race, ethnicity, and origin ACS 2023
- Neighborhood character
- Diverse neighborhood (Simpson 0.62)
- Race & ethnicity
- White 52% Black 29% Hispanic / Latino 14% Two or more races 3%
- Hispanic origin (detail)
- Mexican 4% Puerto Rican 2%
- Common ancestry
- Romanian 3% Lithuanian 2% Italian 2%
- Foreign-born
- 11% · Canada, Jamaica
- Languages at home
- 85% English-only · Spanish 12% Other Indo-European 1% French/Haitian/Cajun 1%
Political lean MEDSL · Sumter
- 2024 margin
- Solid R (+37.6) · D 30.9% · R 68.6%
- 2008→2024 swing
- -10.6pp toward R · 2008: -27.0pp · 2024: -37.6pp
- All cycles
- 2024: R+37.6 2020: R+36.1 2016: R+39.2 2012: R+34.9 2008: R+27.0
Not yet ingested
- Civics
- —
Market trends
- HPI YoY
- ▼ -32.14%
- Current HPI
- 267.9137
- Rent YoY
- ▲ 2.85%
- Metro
- The Villages, FL
- State GDP YoY
- ▲ 3.28%
- F500 in state
- 36
Industry mix (Fortune 500 HQ in FL)
| Industry | F500 HQs | Revenue |
|---|---|---|
| Industrial Technology | 2 | $29B |
|
||
| Insurance | 2 | $17B |
|
||
| Retail | 1 | $60B |
|
||
| Technology Distribution | 1 | $58B |
|
||
| Homebuilding | 1 | $35B |
|
||
| Technology Manufacturing | 1 | $35B |
|
||
Price history
-15.0% since first listed41 events — show timeline
- 2026-05-05 Price Changed $85,000 Stellar MLS as Distributed by MLS Grid
- 2026-04-23 Price Changed $90,000 Stellar MLS as Distributed by MLS Grid
- 2026-04-21 Price Changed $95,000 Stellar MLS as Distributed by MLS Grid
- 2026-04-06 Relisted — Stellar MLS as Distributed by MLS Grid
- 2026-04-06 Listing Removed — Stellar MLS as Distributed by MLS Grid
- 2026-03-06 Price Changed $98,000 Stellar MLS as Distributed by MLS Grid
- 2026-02-11 Price Changed $99,000 Stellar MLS as Distributed by MLS Grid
- 2026-01-13 Listed $105,000 Stellar MLS as Distributed by MLS Grid
- 2026-01-09 Relisted — Stellar MLS as Distributed by MLS Grid
- 2026-01-09 Listing Removed — Stellar MLS as Distributed by MLS Grid
- 2026-01-07 Relisted — Stellar MLS as Distributed by MLS Grid
- 2026-01-01 Listing Removed — Stellar MLS as Distributed by MLS Grid
- 2026-01-01 Listing Removed — Stellar MLS as Distributed by MLS Grid
- 2025-12-20 Price Changed $110,000 Stellar MLS as Distributed by MLS Grid
- 2025-11-19 Relisted — Stellar MLS as Distributed by MLS Grid
- 2025-11-19 Price Changed $120,000 Stellar MLS as Distributed by MLS Grid
- 2025-09-08 Pending — Stellar MLS as Distributed by MLS Grid
- 2025-08-25 Listed $125,000 Stellar MLS as Distributed by MLS Grid
- 2025-08-19 Listing Removed — Stellar MLS as Distributed by MLS Grid
- 2025-05-19 Price Changed $125,000 Stellar MLS as Distributed by MLS Grid
- 2025-03-24 Price Changed $143,000 Stellar MLS as Distributed by MLS Grid
- 2025-01-21 Listed $125,000 Stellar MLS as Distributed by MLS Grid
- 2024-06-19 Listing Removed — Stellar MLS as Distributed by MLS Grid
- 2024-06-05 Listed $149,300 Stellar MLS as Distributed by MLS Grid
- 2024-03-25 Listing Removed — Stellar MLS as Distributed by MLS Grid
- 2024-01-29 Relisted — Stellar MLS as Distributed by MLS Grid
- 2024-01-29 Price Changed $153,000 Stellar MLS as Distributed by MLS Grid
- 2024-01-20 Listing Removed — Stellar MLS as Distributed by MLS Grid
- 2024-01-12 Price Changed $157,000 Stellar MLS as Distributed by MLS Grid
- 2023-10-30 Relisted — Stellar MLS as Distributed by MLS Grid
- 2023-10-25 Listing Removed — Stellar MLS as Distributed by MLS Grid
- 2023-10-14 Price Changed $164,900 Stellar MLS as Distributed by MLS Grid
- 2023-07-26 Price Changed $169,900 Stellar MLS as Distributed by MLS Grid
- 2023-07-22 Listed $174,900 Stellar MLS as Distributed by MLS Grid
- 2021-02-09 Sold (MLS) $74,000 Stellar MLS as Distributed by MLS Grid
- 2020-07-24 Pending — Stellar MLS as Distributed by MLS Grid
- 2020-07-22 Price Changed $73,000 Stellar MLS as Distributed by MLS Grid
- 2020-01-04 Price Changed $76,900 Stellar MLS as Distributed by MLS Grid
- 2019-09-02 Listed $79,900 Stellar MLS as Distributed by MLS Grid
- 2005-09-09 Sold (Public Records) $59,900 Public Records
- 1990-01-01 Sold (Public Records) $100,000 Public Records
Property tax history
-0.4%/yrLatest (2025): $537 · -32.4% YoY. Source: county tax records.
Cash-flow waterfall
monthlySold comps — $/sqft
last 12 mo · ≤1 miLoading sold comps…