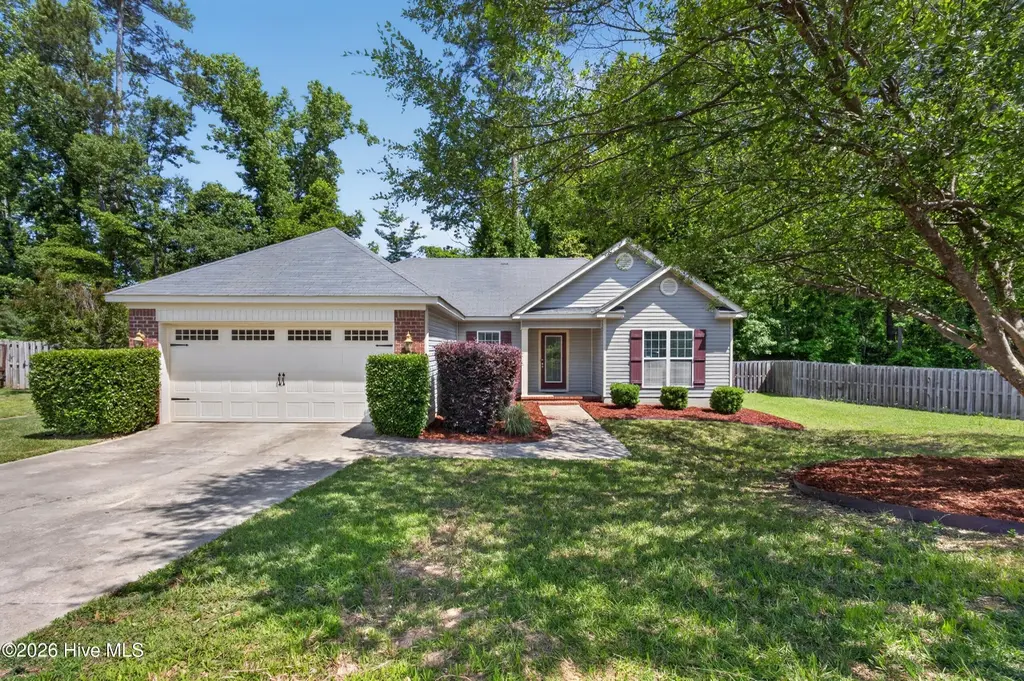
928 Arbor Springs Cir · Grovetown, GA
Flood risk 1/10 · Minimal
- FEMA flood zone
- X (unshaded)
- Chance of flooding over 30 yrs
- 0.0%
- Est. flood insurance / yr
- $507 – $1,088
Fire risk 4/10 · Minor
- Est. fire insurance / yr
- $963 – $1,789
Heat risk 7/10 · Major
- Hot days now (above 105°F)
- 7 days/yr
- Hot days in 30 yrs
- 17 days/yr
Wind risk 6/10 · Moderate
- Chance of severe wind over 30 yrs
- 65.0%
Air-quality risk 3/10 · Minor
- Unhealthy air days now
- 2 days/yr
- Unhealthy air days in 30 yrs
- 2 days/yr
Risk factors via First Street. Map © Google.
Why this score? — see what drove the D- grade
The composite is a weighted blend of 9 inputs, each scored 0–100. Each bar is that input's sub-score; the figure is the points it added to the 100-point composite (weight × sub-score).
- Cash flow +12.2/30.0
- ARV discount +7.5/15.0
- Schools +4.5/10.0
- Livability +3.7/5.0
- DSCR +3.6/10.0
- 1% rule +3.1/10.0
- Rent growth +2.8/5.0
- Condition / age +2.5/5.0
- Appreciation +0.0/10.0
$250,000
🖨 Deal sheet (PDF) 📄 Offer letter ✓ Due diligence
Listing remarks MLS
Home is under contract
Key facts
- Brand new roof
- Covered rear patio
- Functional layout
Tags
Property features AI
Finance
- Other: Property located in Arbor Springs subdivision; Road frontage on city street and state road; Zoned R
Exterior
- Parking: Attached garage with garage door opener; 4 total parking spaces (4-car garage)
- Utilities: Public water; Underground utilities; Water connected
- Home design: Single-family residence; One story, entry level on first floor; Brick and vinyl siding exterior; Shingle roof
- Construction: Built on a slab foundation
- Exterior features: Front porch; Rear porch; Back yard fencing; Has a view
Interior
- Kitchen: Eat-in kitchen (appliances not listed)
- Bedrooms: 7 total rooms (includes bedrooms and living spaces)
- Bathrooms: 2 full bathrooms
- Heating & cooling: Central air conditioning; Heat pump and electric heating; Fireplace(s)
- Interior features: Eat-in kitchen; No basement
Neighborhood map
What this means for you Summary
Snapshot
- This is a 4-bed/2.0-bath other listed at $250k.
Deal economics
- At list price, monthly cash flow is $-50 ($-595/yr) — negative.
- To cash-flow at today's rent, offer at most $241k (3.5% below list).
- To meet the 1% rule (rent ≥ 1% of price), the offer needs to be $204k (18.6% below list).
- Recommended offer: $204k (18.6% below list) — sets the bar for 1% rule.
- Cap rate 6.1% vs local median 4.6% in Grovetown — top-decile yield for the area; either an underpriced asset or a hidden risk that comps aren't pricing in. Stress-test before assuming the spread holds.
Location & tenants
- Location reads 73/100 on livability (#57 in GA) — a middle-class / working-renter tenant base. Strengths: crime A+, cost of living A+, housing A+; Watch: amenities F, commute F.
- Columbia County (suburban): math 49% / reading 52% proficiency, ranked #13 of 174 in GA (top 8%) — acceptable for families but not a draw, mixed tenant base, ~2y average lease.
- Zoned schools: Cedar Ridge Elementary School (math 45% / reading 44%, grade F, #336 of 1,228 statewide, top 29%, 1,150 students, 42% FRL); Grovetown Middle School (math 25% / reading 38%, grade F, #234 of 470 statewide, top 50%, 1,080 students, 49% FRL); Grovetown High School (math 15% / reading 25%, grade F, #232 of 424 statewide, top 56%, 2,236 students, 34% FRL) — zoned schools average 42% FRL vs 26% district-wide (16 pts higher); higher-poverty schools than district average — tighter screening recommended.
- Zoned-school proficiency averages 32% at this address vs 50% district-wide (-18 pts) — the specific schools serving this property underperform the Columbia County average; the district grade overstates school quality for this exact location.
- Market conditions: Rents rising (+1.1%/yr); 724 active listings in the ZIP; 21 comparable units currently listed for rent nearby; rentals at typical pace (median 24d on market — plan ~3-4 weeks tenant-placement turnaround); solid renter incomes; 1,213 units permitted in Columbia County in 2024 (0 in 5+ unit buildings).
Forward outlook
- Local home prices are declining (-3.0%/yr); year-one equity from $2k of loan paydown is wiped out by about $8k of value loss. Plan a longer hold.
- Columbia County population projected at +62% by 2050 — long-run rental-demand tailwind backs the buy-and-hold thesis.
Negotiation context
- Only 9 days on market — expect competitive offers; lowballing is unlikely to land.
- 7 sale attempts since 16y ago with the ask held roughly flat each time — persistent listings suggest the price (not the market) is what's stuck; bring a comps-based counter.
Risks & watch-outs
- Climate carrying-cost: major wind risk, 65% chance of damaging wind over 30y; extreme-heat days projected 7→17/yr by 2055 (HVAC capex compounding) — expect insurance premiums to compound above CPI over the hold.
Questions for the listing agent
- What do current leases actually rent for vs. the listed asking? Can we see a recent rent roll and the last 12 months of T-12 income?
- Is there a deadline driving the sale (1031 exchange, divorce, estate, relocation)? That informs how much negotiation room exists.
- The area grade is low — what's the realistic commute time and amenity access for the typical tenant pool here? Any planned neighborhood developments (good or bad) we should know about?
- What's the average days-on-market for RENTAL listings here right now (not sales)? A rising rental-DOM trend means longer vacancies and softer asking-rent achievability than the comps imply.
- What's the recent tenant-quality profile in this submarket — average credit score on applications, eviction rate, late-payment / NSF rate, and stable-employment percentage? A property-management company in the area should have these aggregated.
- How much new for-sale + rental construction is in the pipeline within 1–3 miles? Heavy new supply typically softens prices + rents 12–24 months out; constrained supply supports both.
Investment metrics
- 1% rule
- 0.81% ✗
- Cap rate
- 6.05%
- Cash-on-cash
- -0.85%
- DSCR
- 0.96
- GRM
- 10.2
CMA / ARV
No comps found within radius.
Projected returns pro-forma
-3.0% appreciation · 1.15% rent growth · sell at horizon
- IRR
- -19.7%
- Equity multiple
- 0.32×
- Total profit
- $-47,404
- Equity at exit
- $37,276
- IRR
- -16.8%
- Equity multiple
- 0.14×
- Total profit
- $-60,110
- Equity at exit
- $21,615
Cash invested: $70,000 (down + closing). Projections, not guarantees.
Landlord ↔ Tenant lean methodology
- Overall (STATE)
- 90 Strongly Landlord-Friendly
- State Georgia
- 90 Strongly Landlord-Friendly · R+3
- County
- — inherits STATE
- City
- — inherits STATE
ZIP-level market 30813
- Home prices YoY
- -29.2%
- Rents YoY
- 1.1%
- Active inventory
- 724
- Price-to-rent
- 10.2×
Monthly cashflow live
- Estimated rent
- $2,036 high interval (Pro) →
- Mortgage (P&I)
- −$1,311
- Tax from tax record
- −$243 /mo · $2,913/yr
- Insurance
- −$104
- HOA
- −$0
- Vacancy / Maint / Mgmt
- −$428
- Net cashflow
- $-50
Break-even live
Sensitivity live
| Price | -10% $92 | -5% $21 | +0% $-50 | +5% $-120 | +10% $-191 |
|---|---|---|---|---|---|
| Rent | -10% $-210 | -5% $-130 | +0% $-50 | +5% $31 | +10% $111 |
| Rate | -1.0pp $76 | -0.5pp $14 | base $-50 | +0.5pp $-114 | +1.0pp $-180 |
UW: 25.0% down · 7.5% · 30yr · 1.5% tax · 5.0% vac · 8.0% maint · 8.0% mgmt
Financing live
Cash to close
- Down payment
- $62,500
- Closing costs
- $7,500
- Reserves months
- —
- Total cash needed
- —
Loan-product check · same deal, 3 products live
Conventional
25% down · 7.5% · 30yr
- Down + closing
- —
- Monthly P&I
- —
- Monthly cashflow
- —
- DSCR
- —
- Eligible?
- —
Personal DTI + credit; lowest rate.
DSCR
20% down · 8.5% · 30yr
- Down + closing
- —
- Monthly P&I
- —
- Monthly cashflow
- —
- DSCR
- —
- Eligible?
- —
No personal income docs; deal must DSCR.
Hard money
10% down · 12.0% · 12mo
- Down + closing
- —
- Monthly P&I
- —
- Monthly cashflow
- —
- DSCR
- —
- Eligible?
- —
Short-term bridge; refi at stabilization.
Rent comps 21 comps
| Address | Beds | Baths | Sqft | Rent | $/sqft | DOM | Units | Dist |
|---|---|---|---|---|---|---|---|---|
| 937 Arbor Springs Cir Grovetown, GA | 4.0 | 2.0 | 1438 | $1,950 | $1.36 | 24d | 1 | 0.14mi |
| 937 Arbor Springs Cir Grovetown, GA | 4.0 | 2.0 | 1438 | $2,000 | $1.39 | 44d | 1 | 0.14mi |
| 301 Hazelnut Dr Grovetown, GA | 3.0 | 2.0 | 1572 | $1,500 | $0.95 | 24d | 1 | 0.33mi |
| 301 Hazelnut Dr Grovetown, GA | 3.0 | 2.0 | 1572 | $1,500 | $0.95 | 44d | 1 | 0.33mi |
| 2057 Lake Forest Dr Grovetown, GA | 4.0 | 2.0 | 1737 | $1,825 | $1.05 | 14d | 1 | 0.68mi |
| 302 Dorn St Grovetown, GA | 4.0 | 3.0 | 1698 | $1,960 | $1.15 | 44d | 1 | 0.74mi |
| 445 Northrop Pl Grovetown, GA | 3.0 | 2.0 | 1300 | $1,535 | $1.18 | 24d | 1 | 0.74mi |
| 345 Washington St Grovetown, GA | 3.0 | 2.0 | 1455 | $1,961 | $1.35 | 21d | 1 | 0.90mi |
| 134 Barbara St Grovetown, GA | 4.0 | 2.5 | 1701 | $1,820 | $1.07 | 44d | 1 | 0.93mi |
| 444 Madison St Grovetown, GA | 3.0 | 2.0 | 1546 | $1,750 | $1.13 | 44d | 1 | 0.94mi |
| 444 Madison St Grovetown, GA | 3.0 | 2.0 | 1546 | $1,700 | $1.10 | 21d | 1 | 0.94mi |
| 4023 Rosedale Pl Grovetown, GA | 3.0 | 2.0 | 1402 | $1,935 | $1.38 | 14d | 1 | 1.02mi |
| 4041 Rosedale Pl #1 Grovetown, GA | 3.0 | 2.0 | 1516 | $1,800 | $1.19 | 44d | 1 | 1.10mi |
| 4041 Rosedale Pl #1 Grovetown, GA | 3.0 | 2.0 | 1516 | $1,800 | $1.19 | 24d | 1 | 1.10mi |
| 1000 Station Dr Grovetown, GA | 1.0–3.0 | 1.0–2.5 | 1226 | $2,435 | $1.99 | 14d | 26 | 1.10mi |
| 945 Cannock St Grovetown, GA | 4.0 | 2.0 | 1786 | $2,000 | $1.12 | 24d | 1 | 1.11mi |
| 1010 Salford Pl Grovetown, GA | 3.0 | 2.0 | 1527 | $1,800 | $1.18 | 21d | 1 | 1.15mi |
| 135 Brighton Landing Dr Grovetown, GA | 3.0 | 2.0 | 1588 | $1,925 | $1.21 | 24d | 1 | 1.36mi |
| 5107 Heathbrook Dr Grovetown, GA | 3.0 | 2.0 | 1570 | $1,900 | $1.21 | 21d | 1 | 1.36mi |
| 5112 Heathbrook Dr Grovetown, GA | 3.0 | 2.5 | 1844 | $2,000 | $1.08 | 24d | 1 | 1.40mi |
| 701 Benelli Ct Unit 00 740 Grovetown, GA | 3.0 | 2.5 | 1500 | $1,750 | $1.17 | 44d | 1 | 1.41mi |
Listing history 16 events
-
2026-05-18$250,000 Active
-
2024-01-19soldstatus $231,000
-
2024-01-16soldstatus $231,000 22-char remark
Show marketing remark (22 chars)
Home is under contract
-
2024-01-16soldstatus $231,000 22-char remark
Show marketing remark (22 chars)
Home is under contract
-
2023-12-15$231,000 22-char remark
Show marketing remark (22 chars)
Home is under contract
-
2023-12-15$231,000 22-char remark
Show marketing remark (22 chars)
Home is under contract
-
2017-09-08soldstatus $145,500
-
2017-09-01soldstatus $145,500
-
2017-09-01soldstatus $145,500
-
2017-08-16$149,900
-
2017-08-16$149,900
-
2010-07-29soldstatus $149,900
-
2010-07-29soldstatus $149,900
-
2010-01-25$144,900
-
2010-01-25$144,900
-
2009-11-24soldstatus $29,900
ⓘ Source: listings_history table (triggers on properties + properties_extension) + one-shot
backfill from property_details.listing_events for pre-trigger history.
Tax reassessment forecast GA · Resets to sale price
- Current annual tax
- $2,913 · $243/mo
- Projected year-2 tax
- $2,913 · $243/mo
- Expected delta
- $0/yr ($0/mo · 0.0%)
ⓘ Screening estimate from a state-policy table — verify with the county assessor before closing.
Climate risk First Street
- Flood 1/10 Low FEMA zone X (unshaded) · 0% chance over 30 yrs
- Wildfire 4/10 Moderate
- Heat 7/10 Severe 7 d/yr ≥105°F today · 17 d/yr by 30 yrs out
- Wind 6/10 Major 65% chance of damaging wind over 30 yrs
- Air quality 3/10 Moderate 2 unhealthy d/yr today · 2 by 30 yrs out
Nearby sold comps map
Loading sold comps map…
Walkable amenities ~0.75 mi
Loading nearby amenities…
Taxation est. · year 1
- Rental income
- $24,430
- − Mortgage interest
- −$14,004
- − Property taxes
- −$2,913
- − Insurance
- −$1,250
- − Repairs & maintenance
- −$1,954
- − Management
- −$1,954
- − Depreciation
- −$7,273
- Taxable loss
- −$4,918
- Est. tax savings @ 24.0%
- +$1,180
- After-tax cash flow
- $585/yr
For passive investors: Depreciation is non-cash, so a rental often shows a tax loss while cash-flowing — sheltering income. Rental losses are passive: they offset passive income freely, and up to $25,000/yr can offset ordinary (W-2) income if you actively participate and your MAGI is under $100k (phasing out to $0 by $150k); unused losses carry forward. On sale, claimed depreciation is recaptured at up to 25%, and gains may owe capital-gains tax (a 1031 exchange can defer both). Figures are a year-1 estimate at your 24.0% rate — not tax advice; consult a CPA.
Schools (NCES district)
- District
- Columbia County
- NCES district ID
- 1301410
- Math proficiency
- 49% ▼ -6.00%
- Reading proficiency
- 52% ▼ -4.00%
- Median HH income
- $69,358
- Composite
- 45.04/100
- National rank
- #2695
- State rank
- #13 of 174 in GA
Livability — Grovetown
- Score
- 73/100
- State rank
- #57
- US rank
- #5433
Category grades
Schools grade is shown separately in the Schools card above.
Census & demographics
- Census place
- Grovetown, GA
- County
- Columbia County · 154,184 people
- City population
- 52,466
- Metro
- Augusta-Richmond County, GA-SC
- Population (ZIP)
- 52,466
- Household income
- $86,923
- Rent vs Own
- Severe rent burden
- 960.0
Population outlook (Columbia County) Hauer SSP2
- Today (2025)
- 189,073 people
- By 2030
- 212,277 · +12.3%
- By 2040
- 259,480 · +37.2%
- By 2050
- 306,991 · +62.4%
- By 2075
- 421,213 · +122.8%
- By 2100
- 496,722 · +162.7%
Race, ethnicity, and origin ACS 2023
- Neighborhood character
- Diverse neighborhood (Simpson 0.65)
- Race & ethnicity
- White 51% Black 29% Hispanic / Latino 11% Two or more races 10% Asian 2%
- Hispanic origin (detail)
- Mexican 5% Puerto Rican 3%
- Common ancestry
- Italian 2% Serbian 1% Lithuanian 1%
- Foreign-born
- 6% · Canada, Vietnam
- Languages at home
- 88% English-only · Spanish 7% German/W. Germanic 2% Other Indo-European 1%
Political lean MEDSL · Columbia
- 2024 margin
- Strong R (+25.6) · D 36.8% · R 62.5%
- 2008→2024 swing
- +17.0pp toward D · 2008: -42.7pp · 2024: -25.6pp
- All cycles
- 2024: R+25.6 2020: R+25.8 2016: R+37.7 2012: R+43.0 2008: R+42.7
Not yet ingested
- Civics
- —
Market trends
- HPI YoY
- ▼ -96.24%
- Current HPI
- 233.821
- Rent YoY
- ▲ 1.15%
- Metro
- Augusta-Richmond County, GA-SC
- State GDP YoY
- ▲ 2.66%
- F500 in state
- 28
Industry mix (Fortune 500 HQ in GA)
| Industry | F500 HQs | Revenue |
|---|---|---|
| Paper / Packaging | 2 | $29B |
|
||
| Retail | 1 | $160B |
|
||
| Transportation / Logistics | 1 | $91B |
|
||
| Airlines | 1 | $62B |
|
||
| Consumer Goods | 1 | $47B |
|
||
| Utilities | 1 | $25B |
|
||
Price history
+736.1% since first listed16 events — show timeline
- 2026-05-18 Listed $250,000 Hive MLS
- 2024-01-19 Sold (Public Records) $231,000 Public Records
- 2024-01-16 Sold (MLS) $231,000 Hive MLS
- 2024-01-16 Sold (MLS) $231,000 Hive MLS
- 2023-12-15 Listed $231,000 Hive MLS
- 2023-12-15 Listed $231,000 Hive MLS
- 2017-09-08 Sold (Public Records) $145,500 Public Records
- 2017-09-01 Sold (MLS) $145,500 Hive MLS
- 2017-09-01 Sold (MLS) $145,500 Hive MLS
- 2017-08-16 Listed $149,900 Hive MLS
- 2017-08-16 Listed $149,900 Hive MLS
- 2010-07-29 Sold (MLS) $149,900 Hive MLS
- 2010-07-29 Sold (MLS) $149,900 Hive MLS
- 2010-01-25 Listed $144,900 Hive MLS
- 2010-01-25 Listed $144,900 Hive MLS
- 2009-11-24 Sold (Public Records) $29,900 Public Records
Property tax history
+5.0%/yrLatest (2025): $2,913 · -1.9% YoY. Source: county tax records.
Cash-flow waterfall
monthlySold comps — $/sqft
last 12 mo · ≤1 miLoading sold comps…