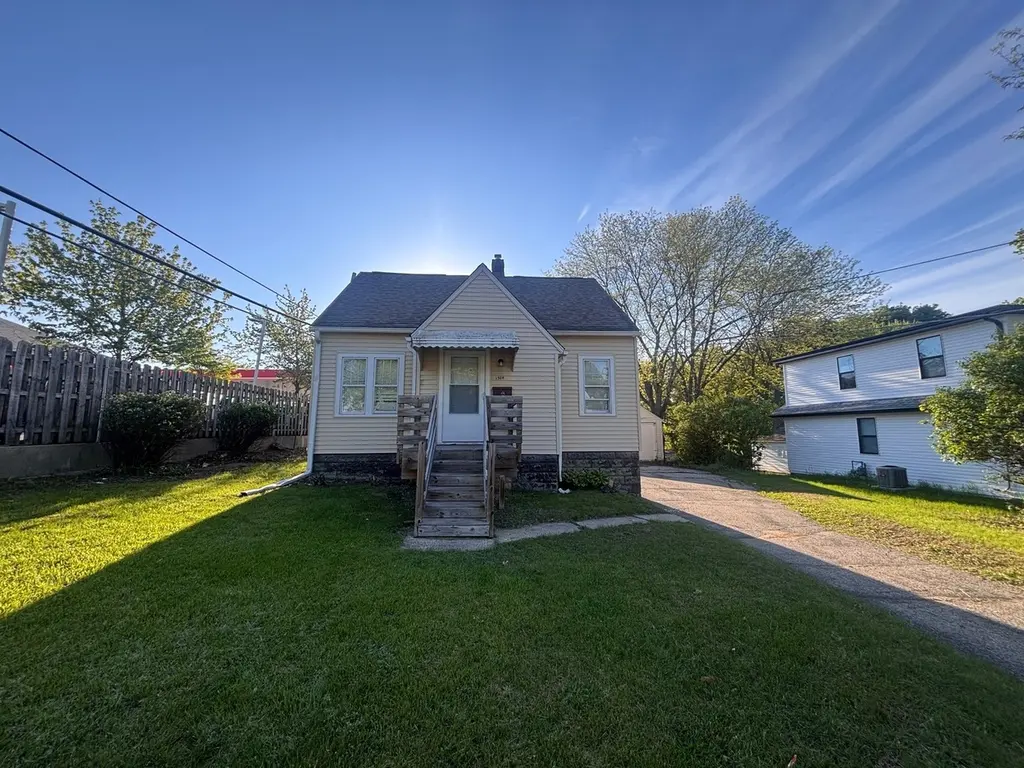
1504 Eastmoreland Ave · Rockford, IL
Flood risk 1/10 · Minimal
- FEMA flood zone
- X (unshaded)
- Chance of flooding over 30 yrs
- 0.0%
- Est. flood insurance / yr
- $473 – $860
Fire risk 1/10 · Minimal
- Est. fire insurance / yr
- $804 – $1,492
Heat risk 2/10 · Minimal
- Hot days now (above 101°F)
- 7 days/yr
- Hot days in 30 yrs
- 15 days/yr
Wind risk 2/10 · Minimal
- Chance of severe wind over 30 yrs
- —
Air-quality risk 3/10 · Minor
- Unhealthy air days now
- 2 days/yr
- Unhealthy air days in 30 yrs
- 3 days/yr
Risk factors via First Street. Map © Google.
Why this score? — see what drove the C+ grade
The composite is a weighted blend of 9 inputs, each scored 0–100. Each bar is that input's sub-score; the figure is the points it added to the 100-point composite (weight × sub-score).
- Cash flow +24.0/30.0
- ARV discount +11.8/15.0
- DSCR +7.7/10.0
- 1% rule +5.9/10.0
- Rent growth +4.5/5.0
- Livability +3.1/5.0
- Condition / age +2.5/5.0
- Schools +1.2/10.0
- Appreciation +0.0/10.0
$124,900
🖨 Deal sheet 📄 Offer letter ✓ Due diligence
Listing remarks
Spacious and full of potential, this 3-bedroom, 1-bath home sits on nearly half an acre, offering plenty of room to spread out both inside and out. The property features a detached 2-car garage, ideal for parking, storage, or a workshop. This home is move-in ready with solid bones, making it a great opportunity for buyers looking to add their personal touch and build equity over time. With a generous lot size, there's ample space for outdoor entertaining, gardening, or future improvements. Being sold as-is, this property is perfect for investors, first-time buyers, or anyone ready to bring a little vision and TLC to make it truly shine. Agent owned interest.
Key facts
- 2 garage spots
- Built 1930
- Listed 22 days
Neighborhood map
What this means for you Summary
Snapshot
- This is a 3-bed/1.0-bath single-family listed at $125k.
Deal economics
- At list price, monthly cash flow is $244 ($3k/yr) — positive.
- The deal already cash-flows at list — no discount required.
- Meets the 1% rule at list price ($1k rent vs $125k).
- Recommended offer: $123k (1.5% below list) — sets the bar for market timing.
- Cap rate 8.6% vs local median 6.1% in Rockford — top-decile yield for the area; either an underpriced asset or a hidden risk that comps aren't pricing in. Stress-test before assuming the spread holds.
Location & tenants
- Location reads 62/100 on livability (#876 in IL) — a middle-class / working-renter tenant base. Strengths: cost of living A+, housing A+, health & safety A+; Watch: schools F, crime F, amenities F.
- Rockford SD 205 (urban): math 12% / reading 16% proficiency, ranked #533 of 620 in IL (top 86%) — low school quality limits family demand, transient renter base, plan for 1-2y turnover; 73% free/reduced lunch — lower-income household profile, screen leases tightly.
- Market conditions: Rents rising fast (+8.1%/yr); 114 active listings in the ZIP; 11 comparable units currently listed for rent nearby; rentals at typical pace (median 21d on market — plan ~3-4 weeks tenant-placement turnaround); 45% of comp listings sitting > 30 days — soft ceiling on asking rent; 285 units permitted in Winnebago County in 2024 (0 in 5+ unit buildings).
Forward outlook
- Local home prices are declining (-3.0%/yr); year-one equity from $864 of loan paydown is wiped out by about $4k of value loss. Plan a longer hold.
- Winnebago County population projected at -20% by 2050 — secular population decline; favor cash flow + early exit over multi-decade hold.
- At projected returns (-3.0% appreciation + 8.0% rent growth), your $35k cash investment doubles in ~8 years — after that, you're playing with house money.
Negotiation context
- It's been on market 22 days — a 2% lower offer ($123k) is reasonable based on typical stale-listing flexibility.
- 2 sale attempts since 3y ago with the ask held roughly flat each time — persistent listings suggest the price (not the market) is what's stuck; bring a comps-based counter.
Risks & watch-outs
- Watch-outs: built in 1930 — expect roof / HVAC / electrical / plumbing capex.
Questions for the listing agent
- Built in 1930 — when were the roof, HVAC, electrical panel, plumbing, and water heater last replaced?
- Is there a deadline driving the sale (1031 exchange, divorce, estate, relocation)? That informs how much negotiation room exists.
- Schools are F-rated, which usually means shorter tenancies and higher turnover. Who's the typical renter profile here, and what's been the actual vacancy rate?
- Crime grade is F in this area — have there been break-ins, vandalism, or insurance claims at this property in the last 3 years? What carrier currently insures it and at what premium?
- What's the average days-on-market for RENTAL listings here right now (not sales)? A rising rental-DOM trend means longer vacancies and softer asking-rent achievability than the comps imply.
- What's the recent tenant-quality profile in this submarket — average credit score on applications, eviction rate, late-payment / NSF rate, and stable-employment percentage? A property-management company in the area should have these aggregated.
- How much new for-sale + rental construction is in the pipeline within 1–3 miles? Heavy new supply typically softens prices + rents 12–24 months out; constrained supply supports both.
Investment metrics
- 1% rule
- 1.09% ✓
- Cap rate
- 8.64%
- Cash-on-cash
- 8.38%
- DSCR
- 1.37
- GRM
- 7.7
CMA / ARV
- ARV (median comp)
- $138,014
- List price
- $124,900
- Delta
- -9.50%
- Verdict
- FAIR
- Comps
- 20 within 1.0 mi
Show comp detail 12 sales within ~0.75 mi
| Address | Dist | Beds/Ba | Sqft | Sold | Price | $/sf | Match |
|---|---|---|---|---|---|---|---|
| 1607 Macarthur Dr | 0.19mi | 2/1.0 (-1) | 781 (-15%) | 3mo | $85,000 | $109 | 59 |
| 4011 Larson Ave | 0.40mi | 3/2.0 | 962 (+5%) | 15mo | $140,000 | $146 | 56 |
| 2016 Ridgeland Rd | 0.44mi | 2/1.0 (-1) | 823 (-10%) | 6mo | $115,000 | $140 | 53 |
| 815 Woodland Dr | 0.50mi | 2/1.0 (-1) | 980 (+7%) | 9mo | $165,000 | $168 | 53 |
| 4024 Florida Dr | 0.50mi | 2/1.0 (-1) | 950 (+4%) | 18mo | $150,000 | $158 | 50 |
| 3208 Maryland Rd | 0.59mi | 3/1.0 | 998 (+9%) | 8mo | $163,000 | $163 | 50 |
| 1819 East Gate Pkwy | 0.44mi | 3/1.0 | 1,015 (+11%) | 15mo | $152,350 | $150 | 49 |
| 2003 Oregon Ave | 0.67mi | 3/1.0 | 956 (+4%) | 19mo | $130,000 | $136 | 46 |
| 912 Peter Ave | 0.55mi | 2/1.0 (-1) | 1,032 (+13%) | 10mo | $130,000 | $126 | 40 |
| 1830 Ohio Pkwy | 0.56mi | 2/1.0 (-1) | 796 (-13%) | 11mo | $97,500 | $122 | 38 |
| 4558 Cleveland Ave | 0.66mi | 2/1.0 (-1) | 984 (+7%) | 19mo | $147,500 | $150 | 36 |
| 820 29th St | 0.68mi | 2/1.0 (-1) | 1,050 (+15%) | 14mo | $129,900 | $124 | 28 |
Match score weights: distance 35% · size 25% · config 20% · recency 20%. Top-matched comps best support the ARV.
Projected returns pro-forma
-3.0% appreciation · 8.0% rent growth · sell at horizon
- IRR
- 1.8%
- Equity multiple
- 1.07×
- Total profit
- $2,469
- Equity at exit
- $18,623
- IRR
- 15.7%
- Equity multiple
- 2.57×
- Total profit
- $54,760
- Equity at exit
- $10,799
Cash invested: $34,972 (down + closing). Projections, not guarantees.
Landlord ↔ Tenant lean methodology
- Overall (STATE)
- 43 Moderately Tenant-Leaning
- State Illinois
- 43 Moderately Tenant-Leaning · D+7
- County
- — inherits STATE
- City
- — inherits STATE
ZIP-level market 61108
- Home prices YoY
- -29.2%
- Rents YoY
- 8.1%
- Active inventory
- 114
- Price-to-rent
- 7.7×
Monthly cashflow live
- Estimated rent
- $1,355 high interval (Pro) →
- Mortgage (P&I)
- −$655
- Tax from tax record
- −$119 /mo · $1,433/yr
- Insurance
- −$52
- HOA
- −$0
- Vacancy / Maint / Mgmt
- −$285
- Net cashflow
- $244
Break-even live
UW: 25.0% down · 7.5% · 30yr · 1.5% tax · 5.0% vac · 8.0% maint · 8.0% mgmt
Financing live
Cash to close
- Down payment
- $31,225
- Closing costs
- $3,747
- Reserves months
- —
- Total cash needed
- —
Loan-product check · same deal, 3 products live
Conventional
25% down · 7.5% · 30yr
- Down + closing
- —
- Monthly P&I
- —
- Monthly cashflow
- —
- DSCR
- —
- Eligible?
- —
Personal DTI + credit; lowest rate.
DSCR
20% down · 8.5% · 30yr
- Down + closing
- —
- Monthly P&I
- —
- Monthly cashflow
- —
- DSCR
- —
- Eligible?
- —
No personal income docs; deal must DSCR.
Hard money
10% down · 12.0% · 12mo
- Down + closing
- —
- Monthly P&I
- —
- Monthly cashflow
- —
- DSCR
- —
- Eligible?
- —
Short-term bridge; refi at stabilization.
Rent comps 11 comps
| Address | Beds | Baths | Sqft | Rent | $/sqft | DOM | Units | Dist |
|---|---|---|---|---|---|---|---|---|
| 3902 15th Ave Unit 3902-7 Rockford, IL | 2.0 | 1.0 | 900 | $1,375 | $1.53 | 21d | 1 | 0.18mi |
| 4455 Charles St Rockford, IL | 1.0–2.0 | 1.0 | 787 | $1,299 | $1.65 | 12d | 1 | 0.51mi |
| 515 Fairview Ave Rockford, IL | 2.0 | 1.0 | 800 | $1,400 | $1.75 | 21d | 1 | 0.74mi |
| 4815 Creek View Rd Rockford, IL | 2.0 | 1.0 | 800 | $1,100 | $1.38 | 43d | 1 | 0.87mi |
| 4752 E Lawn Dr Rockford, IL | 1.0–2.0 | 1.0 | 887 | $1,095 | $1.23 | 12d | 1 | 0.90mi |
| 4242 Harrison Ave Rockford, IL | 1.0–2.0 | 1.0 | 692 | $1,299 | $1.88 | 12d | 1 | 0.96mi |
| 4860 Creek View Rd Unit 3 Rockford, IL | 2.0 | 1.0 | 800 | $1,000 | $1.25 | 43d | 1 | 0.97mi |
| 2723 Silent Wood Trl Unit 2735-7 Rockford, IL | 3.0 | 1.5 | 1050 | $1,310 | $1.25 | 21d | 1 | 1.10mi |
| 4960 Hinsdale Ave Rockford, IL | 2.0 | 1.0 | 900 | $1,100 | $1.22 | 43d | 1 | 1.16mi |
| 4960 Hinsdale Ave Unit 8 8 Rockford, IL | 2.0 | 1.5 | 900 | $1,100 | $1.22 | 43d | 1 | 1.16mi |
| 4173 Eastridge Dr Rockford, IL | 3.0 | 1.0 | 1000 | $1,250 | $1.25 | 43d | 1 | 1.26mi |
Listing history 7 events
-
2026-05-06$129,000 Active 668-char remark
-
2023-06-12historical
-
2023-05-12historical
-
2023-05-05price
-
2023-05-05price $109,000
-
2023-04-25Active
-
2021-12-10soldstatus $880,000
ⓘ Source: listings_history table (triggers on properties + properties_extension) + one-shot
backfill from property_details.listing_events for pre-trigger history.
Tax reassessment forecast IL · Partial reset (capped growth)
- Current annual tax
- $1,433 · $119/mo
- Projected year-2 tax
- $2,134 · $178/mo
- Expected delta
- +$701/yr (+$58/mo · 48.9%)
ⓘ Screening estimate from a state-policy table — verify with the county assessor before closing.
Climate risk First Street
- Flood 1/10 Low FEMA zone X (unshaded) · 0% chance over 30 yrs
- Wildfire 1/10 Low
- Heat 2/10 Low 7 d/yr ≥101°F today · 15 d/yr by 30 yrs out
- Wind 2/10 Low
- Air quality 3/10 Moderate 2 unhealthy d/yr today · 3 by 30 yrs out
Nearby sold comps map
Loading sold comps map…
Walkable amenities ~0.75 mi
Loading nearby amenities…
Taxation est. · year 1
- Rental income
- $16,262
- − Mortgage interest
- −$6,996
- − Property taxes
- −$1,433
- − Insurance
- −$624
- − Repairs & maintenance
- −$1,301
- − Management
- −$1,301
- − Depreciation
- −$3,633
- Taxable income
- $973
- Est. tax owed @ 24.0%
- −$233
- After-tax cash flow
- $2,696/yr
For passive investors: Depreciation is non-cash, so a rental often shows a tax loss while cash-flowing — sheltering income. Rental losses are passive: they offset passive income freely, and up to $25,000/yr can offset ordinary (W-2) income if you actively participate and your MAGI is under $100k (phasing out to $0 by $150k); unused losses carry forward. On sale, claimed depreciation is recaptured at up to 25%, and gains may owe capital-gains tax (a 1031 exchange can defer both). Figures are a year-1 estimate at your 24.0% rate — not tax advice; consult a CPA.
Schools (NCES district)
- District
- Rockford SD 205
- NCES district ID
- 1734510
- Math proficiency
- 12% ▼ -2.00%
- Reading proficiency
- 16% ▼ -3.00%
- Median HH income
- $42,533
- Composite
- 12.21/100
- National rank
- #9649
- State rank
- #533 of 620 in IL
Livability — Rockford
- Score
- 62/100
- State rank
- #876
- US rank
- #17035
Category grades
Schools grade is shown separately in the Schools card above.
Census & demographics
- Census place
- Rockford, IL
- County
- Winnebago County · 147,297 people
- City population
- 147,297
- Metro
- Rockford, IL
- Population (ZIP)
- 30,355
- Household income
- $64,415
- Rent vs Own
- Severe rent burden
- 1199.0
Population outlook (Winnebago County) Hauer SSP2
- Today (2025)
- 271,080 people
- By 2030
- 260,684 · -3.8%
- By 2040
- 238,405 · -12.1%
- By 2050
- 216,129 · -20.3%
- By 2075
- 172,882 · -36.2%
- By 2100
- 135,336 · -50.1%
Race, ethnicity, and origin ACS 2023
- Neighborhood character
- Diverse neighborhood (Simpson 0.60)
- Race & ethnicity
- White 57% Hispanic / Latino 24% Black 11% Two or more races 10% Asian 5%
- Hispanic origin (detail)
- Mexican 18% Puerto Rican 2%
- Common ancestry
- Romanian 3% Portuguese 3% Arab 2%
- Foreign-born
- 15% · Canada, Philippines, China
- Languages at home
- 75% English-only · Spanish 16% Arabic 3% Other Asian/Pacific 2%
Political lean MEDSL · Winnebago
- 2024 margin
- Toss-up / Even · D 49.5% · R 49.0% · Other 1.5%
- 2008→2024 swing
- -12.2pp toward R · 2008: 12.8pp · 2024: 0.6pp
- All cycles
- 2024: D+0.6 2020: D+2.5 2016: R+1.2 2012: D+5.7 2008: D+12.8
Not yet ingested
- Civics
- —
Market trends
- HPI YoY
- ▼ -90.38%
- Current HPI
- 218.6339
- Rent YoY
- ▲ 8.11%
- Metro
- Rockford, IL
- State GDP YoY
- ▲ 1.59%
- F500 in state
- 60
Industry mix (Fortune 500 HQ in IL)
| Industry | F500 HQs | Revenue |
|---|---|---|
| Insurance | 4 | $201B |
|
||
| Consumer Goods | 4 | $87B |
|
||
| Industrial Machinery | 3 | $64B |
|
||
| Healthcare | 2 | $55B |
|
||
| Retail / Pharmacy | 1 | $148B |
|
||
| Agriculture / Food | 1 | $86B |
|
||
Price history
-85.8% since first listed9 events — show timeline
- 2026-05-28 Pending — MRED as Distributed by MLS Grid
- 2026-05-26 Price Changed $124,900 MRED as Distributed by MLS Grid
- 2026-05-06 Listed $129,000 MRED as Distributed by MLS Grid
- 2023-06-12 Rental Removed — RENT.
- 2023-05-12 Listing Removed — MRED as Distributed by MLS Grid
- 2023-05-05 Price Changed — MRED as Distributed by MLS Grid
- 2023-05-05 Price Changed $109,000 NWIAR
- 2023-04-25 Listed — MRED as Distributed by MLS Grid
- 2021-12-10 Sold (Public Records) $880,000 Public Records
Property tax history
-1.6%/yrLatest (2025): $1,433 · +8.4% YoY. Source: county tax records.
Cash-flow waterfall
monthlySold comps — $/sqft
last 12 mo · ≤1 miLoading sold comps…