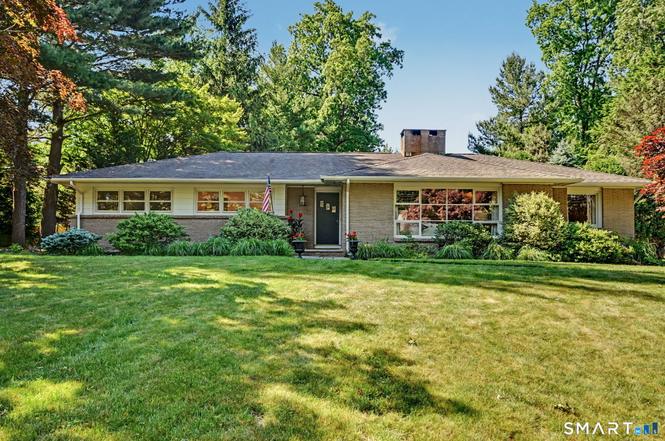
19 Crooked Trl · Norwalk, CT
Flood risk 1/10 · Minimal
- FEMA flood zone
- X (unshaded)
- Chance of flooding over 30 yrs
- 0.0%
- Est. flood insurance / yr
- $473 – $860
Fire risk 1/10 · Minimal
- Est. fire insurance / yr
- $829 – $1,539
Heat risk 5/10 · Moderate
- Hot days now (above 99°F)
- 7 days/yr
- Hot days in 30 yrs
- 15 days/yr
Wind risk 6/10 · Moderate
- Chance of severe wind over 30 yrs
- 73.0%
Air-quality risk 8/10 · Major
- Unhealthy air days now
- 13 days/yr
- Unhealthy air days in 30 yrs
- 18 days/yr
Risk factors via First Street. Map © Google.
Why this score? — see what drove the B- grade
The composite is a weighted blend of 9 inputs, each scored 0–100. Each bar is that input's sub-score; the figure is the points it added to the 100-point composite (weight × sub-score).
- Cash flow +26.0/30.0
- ARV discount +15.0/15.0
- DSCR +8.7/10.0
- 1% rule +6.3/10.0
- Livability +3.9/5.0
- Schools +3.4/10.0
- Rent growth +2.5/5.0
- Condition / age +2.5/5.0
- Appreciation +0.0/10.0
$1,495,000
🖨 Deal sheet (PDF) 📄 Offer letter ✓ Due diligence
Listing remarks MLS
Spacious, comfortable ranch on .50 level acre in Rowayton. Huge backyard deck; nicely screened and landscaped to create a private, natural setting. Custom stone retaining wall frames paved drive. Hardwood floors as seen and throughout w. exception of EIK and baths. Light and open layout, w. excellent flow for entertaining family and friends. Large unfinished basement w. separate storage/room and two vehicle bays. Plumbed for water and toliet. Current owners hooked up to sewer and installed central air + warranteed "dry basement" system. Clean, move-in ready and priced to sell!
Key facts
- Recreation room
- One-floor living
- Spacious deck
Tags
Property features AI
Exterior
- Parking: Under-house garage; 2-car garage
- Utilities: Public water connected; Public sewer connected; Fuel tank located in garage
- Home design: Single-family home
- Construction: Built with frame and brick construction; Brick and block exterior siding; Asphalt shingle roof; Block foundation
- Exterior features: Level lot; Beach rights
Interior
- Kitchen: Cooktop; Wall oven; Microwave; Refrigerator; Dishwasher
- Bedrooms: 3 bedrooms
- Bathrooms: 2 full bathrooms
- Heating & cooling: Baseboard heating (oil); Central air conditioning
- Interior features: 7 total rooms; One fireplace; Partial basement with concrete floor, interior access, garage access; Attic with pull-down stairs
- Laundry & utility: Washer and dryer included; Oil-fired hot water (domestic)
Neighborhood map
What this means for you Summary
Snapshot
- This is a 3-bed/2.0-bath single-family listed at $1.50M.
Deal economics
- At list price, monthly cash flow is $4k ($45k/yr) — positive.
- The deal already cash-flows at list — no discount required.
- Meets the 1% rule at list price ($17k rent vs $1.50M).
- Cap rate 9.3% vs local median 3.4% in Norwalk — top-decile yield for the area; either an underpriced asset or a hidden risk that comps aren't pricing in. Stress-test before assuming the spread holds.
Location & tenants
- Location reads 77/100 on livability (#41 in CT, #2,966 nationally) — a middle-class / working-renter tenant base. Strengths: employment A+, health & safety A+, crime A; Watch: amenities C-, cost of living F.
- Norwalk School District (urban): math 29% / reading 44% proficiency, ranked #104 of 153 in CT (top 68%) — families likely to look elsewhere, expect single-tenant / working-renter base with shorter leases.
- Market conditions: 25 active listings in the ZIP; 10 comparable units currently listed for rent nearby; rentals lingering (median 45d on market — plan ~5-8 weeks vacancy on turnover, expect pricing pressure); 50% of comp listings sitting > 30 days — soft ceiling on asking rent; 1,151 units permitted in Western Connecticut Planning Region in 2024 (714 in 5+ unit buildings).
Forward outlook
- Local home prices are declining (-3.0%/yr); year-one equity from $10k of loan paydown is wiped out by about $45k of value loss. Plan a longer hold.
Negotiation context
- Only 11 days on market — expect competitive offers; lowballing is unlikely to land.
- 5 sale attempts since 20y ago with the ask held roughly flat each time — persistent listings suggest the price (not the market) is what's stuck; bring a comps-based counter.
- Current owner paid $685k; list at $1.50M implies a 118% gain — meaningful room to come down on a strong offer.
Risks & watch-outs
- Climate carrying-cost: major wind risk, 73% chance of damaging wind over 30y; extreme-heat days projected 7→15/yr by 2055 (HVAC capex compounding) — expect insurance premiums to compound above CPI over the hold.
Questions for the listing agent
- Built in 1960 — when were the roof, HVAC, electrical panel, plumbing, and water heater last replaced?
- Is there a deadline driving the sale (1031 exchange, divorce, estate, relocation)? That informs how much negotiation room exists.
- What's the average days-on-market for RENTAL listings here right now (not sales)? A rising rental-DOM trend means longer vacancies and softer asking-rent achievability than the comps imply.
- What's the recent tenant-quality profile in this submarket — average credit score on applications, eviction rate, late-payment / NSF rate, and stable-employment percentage? A property-management company in the area should have these aggregated.
- How much new for-sale + rental construction is in the pipeline within 1–3 miles? Heavy new supply typically softens prices + rents 12–24 months out; constrained supply supports both.
Investment metrics
- 1% rule
- 1.13% ✓
- Cap rate
- 9.28%
- Cash-on-cash
- 10.66%
- DSCR
- 1.47
- GRM
- 7.4
CMA / ARV
- ARV (on-the-fly)
- $1,883,791
- Comps found
- 12
Show comp detail 12 sales within ~0.75 mi
| Address | Dist | Beds/Ba | Sqft | Sold | Price | $/sf | Match |
|---|---|---|---|---|---|---|---|
| 199 Highland Ave | 0.14mi | 2/2.0 (-1) | 2,037 (-4%) | 12mo | $1,600,000 | $785 | 72 |
| 36 Hunt St | 0.39mi | 3/2.0 | 2,100 (-1%) | 10mo | $1,195,000 | $569 | 72 |
| 9 Arnold Ln | 0.45mi | 3/2.0 | 2,264 (+7%) | 2mo | $1,100,700 | $486 | 66 |
| 7 Thomes St | 0.47mi | 3/2.5 | 1,940 (-8%) | 1mo | $2,000,000 | $1,031 | 61 |
| 34 Crest Rd | 0.57mi | 3/2.5 | 2,122 (+0%) | 12mo | $2,075,000 | $978 | 61 |
| 209 Rowayton Ave | 0.54mi | 4/2.5 (+1) | 2,068 (-2%) | 4mo | $2,640,000 | $1,277 | 60 |
| 17 Burchard Ln | 0.23mi | 3/2.5 | 1,818 (-14%) | 8mo | $1,617,000 | $889 | 56 |
| 1 Flicker Ln | 0.52mi | 4/2.5 (+1) | 2,240 (+6%) | 5mo | $2,350,000 | $1,049 | 55 |
| 10 Hunt St | 0.50mi | 3/2.5 | 1,858 (-12%) | 0mo | $1,608,000 | $865 | 54 |
| 21 Gilbert Hill Rd | 0.43mi | 3/2.0 | 2,336 (+10%) | 11mo | $900,000 | $385 | 54 |
| 27 Deepwood Ln | 0.48mi | 4/2.0 (+1) | 2,004 (-5%) | 13mo | $775,000 | $387 | 53 |
| 34 Wilson Ave | 0.64mi | 3/2.0 | 1,862 (-12%) | 13mo | $1,810,000 | $972 | 39 |
Match score weights: distance 35% · size 25% · config 20% · recency 20%. Top-matched comps best support the ARV.
Projected returns pro-forma
-3.0% appreciation · 3.0% rent growth · sell at horizon
- IRR
- -0.4%
- Equity multiple
- 0.99×
- Total profit
- $-5,585
- Equity at exit
- $222,909
- IRR
- 9.3%
- Equity multiple
- 1.72×
- Total profit
- $299,427
- Equity at exit
- $129,260
Cash invested: $418,600 (down + closing). Projections, not guarantees.
Landlord ↔ Tenant lean methodology
- Overall (STATE)
- 27 Tenant-Leaning
- State Connecticut
- 27 Tenant-Leaning · D+7
- County
- — inherits STATE
- City
- — inherits STATE
ZIP-level market 06853
- Home prices YoY
- -26.8%
- Active inventory
- 25
- Price-to-rent
- 7.4×
Monthly cashflow live
- Estimated rent
- $16,918 high interval (Pro) →
- Mortgage (P&I)
- −$7,840
- Tax from tax record
- −$1,184 /mo · $14,210/yr
- Insurance
- −$623
- HOA
- −$0
- Vacancy / Maint / Mgmt
- −$3,553
- Net cashflow
- $3,719
Break-even live
Sensitivity live
| Price | -10% $4,565 | -5% $4,142 | +0% $3,719 | +5% $3,295 | +10% $2,872 |
|---|---|---|---|---|---|
| Rent | -10% $2,382 | -5% $3,050 | +0% $3,719 | +5% $4,387 | +10% $5,055 |
| Rate | -1.0pp $4,471 | -0.5pp $4,099 | base $3,719 | +0.5pp $3,331 | +1.0pp $2,937 |
UW: 25.0% down · 7.5% · 30yr · 1.5% tax · 5.0% vac · 8.0% maint · 8.0% mgmt
Financing live
Cash to close
- Down payment
- $373,750
- Closing costs
- $44,850
- Reserves months
- —
- Total cash needed
- —
Loan-product check · same deal, 3 products live
Conventional
25% down · 7.5% · 30yr
- Down + closing
- —
- Monthly P&I
- —
- Monthly cashflow
- —
- DSCR
- —
- Eligible?
- —
Personal DTI + credit; lowest rate.
DSCR
20% down · 8.5% · 30yr
- Down + closing
- —
- Monthly P&I
- —
- Monthly cashflow
- —
- DSCR
- —
- Eligible?
- —
No personal income docs; deal must DSCR.
Hard money
10% down · 12.0% · 12mo
- Down + closing
- —
- Monthly P&I
- —
- Monthly cashflow
- —
- DSCR
- —
- Eligible?
- —
Short-term bridge; refi at stabilization.
Rent comps 10 comps
| Address | Beds | Baths | Sqft | Rent | $/sqft | DOM | Units | Dist |
|---|---|---|---|---|---|---|---|---|
| 233 Rowayton Ave Norwalk, CT | 3.0 | 2.5 | 2579 | $26,000 | $10.08 | 3d | 1 | 0.57mi |
| 168 Rowayton Ave Unit A Norwalk, CT | 3.0 | 3.0 | 1400 | $8,750 | $6.25 | 3d | 1 | 0.60mi |
| 111 Rowayton Ave #201 Norwalk, CT | 3.0 | 3.0 | 2399 | $30,000 | $12.51 | 3d | 1 | 0.85mi |
| 8 Woodchuck Ln Norwalk, CT | 2.0 | 2.0 | 1500 | $4,200 | $2.80 | 15d | 1 | 0.94mi |
| 6 Edgewood St Unit A Norwalk, CT | 3.0 | 2.5 | 1900 | $4,950 | $2.61 | 45d | 1 | 0.94mi |
| 12 Splitrock Rd Norwalk, CT | 3.0 | 3.0 | 1658 | $16,000 | $9.65 | 45d | 1 | 1.00mi |
| 1 Cottontail Rd Norwalk, CT | 4.0 | 3.0 | 1458 | $6,500 | $4.46 | 3d | 1 | 1.08mi |
| 104 Roton Ave Norwalk, CT | 3.0 | 4.0 | 2449 | $28,000 | $11.43 | 45d | 1 | 1.17mi |
| 31 Ensign Rd Norwalk, CT | 4.0 | 2.5 | 1952 | $9,999 | $5.12 | 45d | 1 | 1.27mi |
| 134 Woodward Ave Unit 2 Norwalk, CT | 4.0 | 3.0 | 1681 | $3,500 | $2.08 | 45d | 1 | 1.36mi |
Listing history 8 events
-
2026-06-21days on market $1,495,000 Active 11 DOM
-
2026-06-18days on market $1,495,000 Active 8 DOM
-
2026-06-17days on market $1,495,000 Active 7 DOM
-
2026-06-16days on market $1,495,000 Active 6 DOM
-
2026-06-15days on market $1,495,000 Active 5 DOM
-
2026-06-13days on market $1,495,000 Active 3 DOM
-
2026-06-13remarks 699-char remark
-
2026-06-13$1,495,000 Active 2 DOM
ⓘ Source: listings_history table (triggers on properties + properties_extension) + one-shot
backfill from property_details.listing_events for pre-trigger history.
Tax reassessment forecast CT · Partial reset (capped growth)
- Current annual tax
- $14,210 · $1,184/mo
- Projected year-2 tax
- $23,102 · $1,925/mo
- Expected delta
- +$8,892/yr (+$741/mo · 62.6%)
ⓘ Screening estimate from a state-policy table — verify with the county assessor before closing.
Climate risk First Street
- Flood 1/10 Low FEMA zone X (unshaded) · 0% chance over 30 yrs
- Wildfire 1/10 Low
- Heat 5/10 Major 7 d/yr ≥99°F today · 15 d/yr by 30 yrs out
- Wind 6/10 Major 73% chance of damaging wind over 30 yrs
- Air quality 8/10 Severe 13 unhealthy d/yr today · 18 by 30 yrs out
Nearby sold comps map
Loading sold comps map…
Walkable amenities ~0.75 mi
Loading nearby amenities…
Taxation est. · year 1
- Rental income
- $203,021
- − Mortgage interest
- −$83,743
- − Property taxes
- −$14,210
- − Insurance
- −$7,475
- − Repairs & maintenance
- −$16,242
- − Management
- −$16,242
- − Depreciation
- −$43,491
- Taxable income
- $21,618
- Est. tax owed @ 24.0%
- −$5,188
- After-tax cash flow
- $39,434/yr
For passive investors: Depreciation is non-cash, so a rental often shows a tax loss while cash-flowing — sheltering income. Rental losses are passive: they offset passive income freely, and up to $25,000/yr can offset ordinary (W-2) income if you actively participate and your MAGI is under $100k (phasing out to $0 by $150k); unused losses carry forward. On sale, claimed depreciation is recaptured at up to 25%, and gains may owe capital-gains tax (a 1031 exchange can defer both). Figures are a year-1 estimate at your 24.0% rate — not tax advice; consult a CPA.
Schools (NCES district)
- District
- Norwalk School District
- NCES district ID
- 0903090
- Math proficiency
- 29% ▼ -11.00%
- Reading proficiency
- 44% ▼ -6.00%
- Median HH income
- $76,540
- Composite
- 34.07/100
- National rank
- #5297
- State rank
- #104 of 153 in CT
Livability — Norwalk
- Score
- 77/100
- State rank
- #41
- US rank
- #2966
Category grades
Schools grade is shown separately in the Schools card above.
Census & demographics
- Census place
- Norwalk, CT
- City population
- 89,026
- Population (ZIP)
- 3,229
Population outlook (Western Connecticut County) Hauer SSP2
- By 2040
- 685,031
Race, ethnicity, and origin ACS 2023
- Neighborhood character
- Predominantly White (90%)
- Race & ethnicity
- White 90% Two or more races 6% Hispanic / Latino 2% Asian 2% Black 2%
- Common ancestry
- Lithuanian 5% Romanian 4% Italian 3%
- Foreign-born
- 6% · Canada, China
- Languages at home
- 93% English-only · German/W. Germanic 3% Spanish 3% Russian/Polish/Slavic 1%
Political lean MEDSL · Western Connecticut
- 2024 margin
- D (+19.1) · D 58.8% · R 39.7% · Other 1.6%
- All cycles
- 2024: D+19.1
Not yet ingested
- Civics
- —
Market trends
- HPI YoY
- ▼ -77.55%
- Current HPI
- 212.295
- Rent YoY
- —
- Metro
- —
- State GDP YoY
- ▲ 1.06%
- F500 in state
- 38
Industry mix (Fortune 500 HQ in CT)
| Industry | F500 HQs | Revenue |
|---|---|---|
| Industrial Machinery | 4 | $38B |
|
||
| Insurance | 3 | $71B |
|
||
| Financial Services | 2 | $25B |
|
||
| Transportation / Logistics | 2 | $18B |
|
||
| Healthcare | 1 | $247B |
|
||
| Telecommunications | 1 | $55B |
|
||
Price history
+75.9% since first listed12 events — show timeline
- 2026-06-11 Listed $1,495,000 Smart MLS
- 2026-06-10 Coming Soon $1,495,000 Smart MLS
- 2014-05-20 Sold (Public Records) $685,000 Public Records
- 2014-05-20 Sold (MLS) $685,000 Smart MLS
- 2014-03-14 Listed $685,000 Smart MLS
- 2007-05-17 Sold (MLS) $957,500 Smart MLS
- 2006-12-01 Listing Removed — Smart MLS
- 2006-12-01 Listed $995,000 Smart MLS
- 2006-08-04 Listed $1,050,000 Smart MLS
- 2006-03-27 Sold (Public Records) $850,000 Public Records
- 2006-03-27 Sold (MLS) $850,000 Smart MLS
- 2006-02-16 Listed $850,000 Smart MLS
Property tax history
-0.2%/yrLatest (2023): $14,210 · +4.3% YoY. Source: county tax records.
Cash-flow waterfall
monthlySold comps — $/sqft
last 12 mo · ≤1 miLoading sold comps…