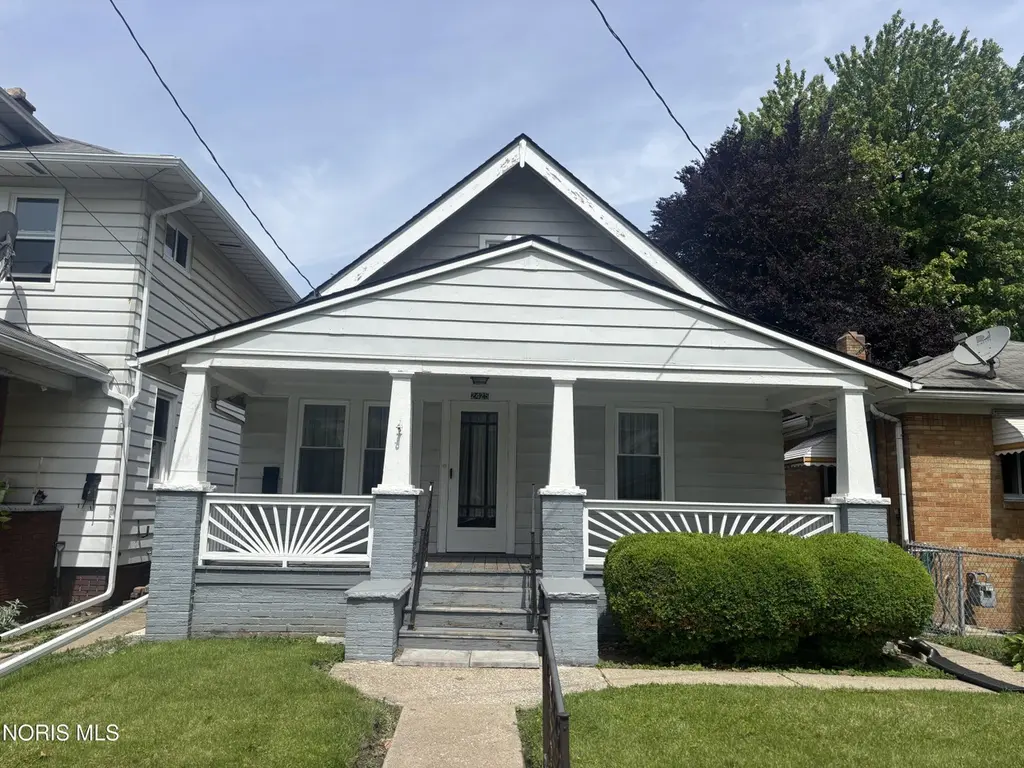
2425 Caledonia St · Toledo, OH
Flood risk 1/10 · Minimal
- FEMA flood zone
- X (unshaded)
- Chance of flooding over 30 yrs
- 0.0%
- Est. flood insurance / yr
- $473 – $860
Fire risk 1/10 · Minimal
- Est. fire insurance / yr
- $713 – $1,323
Heat risk 3/10 · Minor
- Hot days now (above 100°F)
- 7 days/yr
- Hot days in 30 yrs
- 16 days/yr
Wind risk 2/10 · Minimal
- Chance of severe wind over 30 yrs
- —
Air-quality risk 2/10 · Minimal
- Unhealthy air days now
- 1 days/yr
- Unhealthy air days in 30 yrs
- 3 days/yr
Risk factors via First Street. Map © Google.
Why this score? — see what drove the C grade
The composite is a weighted blend of 9 inputs, each scored 0–100. Each bar is that input's sub-score; the figure is the points it added to the 100-point composite (weight × sub-score).
- Cash flow +27.8/30.0
- DSCR +9.8/10.0
- 1% rule +6.5/10.0
- Rent growth +3.8/5.0
- Livability +3.3/5.0
- Condition / age +2.5/5.0
- Schools +1.6/10.0
- ARV discount +0.0/15.0
- Appreciation +0.0/10.0
$89,900
🖨 Deal sheet 📄 Offer letter ✓ Due diligence
Listing remarks
Move-in ready 3-bedroom home offering 1,238 square feet with beautiful hardwood floors throughout and numerous updates. Features include one full bath and 2 beds on the main floor and a clean freshly painted basement providing additional usable space. Recent improvements include NEW windows and NEW central air, along with a recently improved furnace and hot water tank (2017). Enjoy the fenced backyard and convenient location. A well-maintained home with charm, character, and major mechanical updates already completed.
Key facts
- 3,600 sq ft lot
- 3 parking spots
- Built 1925
Property features AI
Finance
- Other: Lot approximately 0.08 acres (3,600 sq ft); Road frontage on a city street
Exterior
- Parking: On-street parking for 3 vehicles
- Utilities: Public water; Public sewer; Electricity connected; Cable available; Fiber available; WiFi available; Internet available
- Home design: Single-family house; One and one-half levels (2 stories total); No attached units or common walls; Residential zoning (10-RD6)
- Construction: Aluminum siding; Block foundation; Shingle roof; Year built source: public records
- Exterior features: Deck; Front porch; Shed(s); Chain link and wood fencing
Interior
- Kitchen: Gas range
- Bedrooms: Bedroom on upper level (35 x 11); Bedroom on main level (10 x 11); Bedroom on main level (13 x 12)
- Flooring: Hardwood; Linoleum; Wood
- Bathrooms: 1 full bathroom
- Heating & cooling: Forced air heating (natural gas); Central air conditioning
- Interior features: Crown molding; Storage in exterior but accessible from interior areas
- Laundry & utility: Laundry area (other)
Neighborhood map
What this means for you Summary
Snapshot
- This is a 3-bed/1.0-bath single-family listed at $90k.
Deal economics
- At list price, monthly cash flow is $275 ($3k/yr) — positive.
- The deal already cash-flows at list — no discount required.
- Meets the 1% rule at list price ($1k rent vs $90k).
- Cap rate 10.0% vs local median 7.6% in Toledo — top-decile yield for the area; either an underpriced asset or a hidden risk that comps aren't pricing in. Stress-test before assuming the spread holds.
Location & tenants
- Location reads 66/100 on livability (#645 in OH) — a middle-class / working-renter tenant base. Strengths: cost of living A+, housing A+, health & safety A+; Watch: amenities C-, crime F, commute F.
- Toledo City (urban): math 15% / reading 24% proficiency, ranked #634 of 656 in OH (top 97%) — low school quality limits family demand, transient renter base, plan for 1-2y turnover; 72% free/reduced lunch — lower-income household profile, screen leases tightly.
- Zoned schools: Birmingham Elementary School (math 8% / reading 12%, grade F, #1,471 of 1,584 statewide, top 95%, 299 students, 0% FRL); Waite High School (math 12% / reading 24%, grade F, #687 of 781 statewide, top 88%, 997 students, 0% FRL) — zoned schools average 0% FRL vs 72% district-wide (72 pts lower); this property's tenant base skews higher-income than the district average.
- Market conditions: Rents rising fast (+5.4%/yr); 117 active listings in the ZIP; 11 comparable units currently listed for rent nearby; rentals at typical pace (median 24d on market — plan ~3-4 weeks tenant-placement turnaround); lower-income renter base — watch delinquency; 415 units permitted in Lucas County in 2024 (122 in 5+ unit buildings).
- This rent runs 32% of the median local income ($39k/yr) — at the standard rent-burdened threshold; future hikes will face affordability resistance.
Forward outlook
- Local home prices are declining (-3.0%/yr); year-one equity from $622 of loan paydown is wiped out by about $3k of value loss. Plan a longer hold.
- Lucas County population projected at -16% by 2050 — secular population decline; favor cash flow + early exit over multi-decade hold.
- At projected returns (-3.0% appreciation + 5.4% rent growth), your $25k cash investment doubles in ~8 years — after that, you're playing with house money.
Negotiation context
- Only 14 days on market — expect competitive offers; lowballing is unlikely to land.
Risks & watch-outs
- Watch-outs: built in 1925 — expect roof / HVAC / electrical / plumbing capex.
Questions for the listing agent
- Built in 1925 — when were the roof, HVAC, electrical panel, plumbing, and water heater last replaced?
- Is there a deadline driving the sale (1031 exchange, divorce, estate, relocation)? That informs how much negotiation room exists.
- Schools are D-rated, which usually means shorter tenancies and higher turnover. Who's the typical renter profile here, and what's been the actual vacancy rate?
- Crime grade is F in this area — have there been break-ins, vandalism, or insurance claims at this property in the last 3 years? What carrier currently insures it and at what premium?
- What's the average days-on-market for RENTAL listings here right now (not sales)? A rising rental-DOM trend means longer vacancies and softer asking-rent achievability than the comps imply.
- What's the recent tenant-quality profile in this submarket — average credit score on applications, eviction rate, late-payment / NSF rate, and stable-employment percentage? A property-management company in the area should have these aggregated.
- How much new for-sale + rental construction is in the pipeline within 1–3 miles? Heavy new supply typically softens prices + rents 12–24 months out; constrained supply supports both.
Investment metrics
- 1% rule
- 1.15% ✓
- Cap rate
- 9.97%
- Cash-on-cash
- 13.12%
- DSCR
- 1.58
- GRM
- 7.2
CMA / ARV
- ARV (on-the-fly)
- $73,042
- Comps found
- 12
Show comp detail 12 sales within ~0.75 mi
| Address | Dist | Beds/Ba | Sqft | Sold | Price | $/sf | Match |
|---|---|---|---|---|---|---|---|
| 2232 Caledonia St | 0.24mi | 3/1.0 | 1,273 (+3%) | 11mo | $75,000 | $59 | 75 |
| 2137 Valentine St | 0.36mi | 3/1.0 | 1,272 (+3%) | 6mo | $47,500 | $37 | 74 |
| 2418 Valentine St | 0.04mi | 3/1.0 | 1,339 (+8%) | 14mo | $79,500 | $59 | 73 |
| 2315 Caledonia St | 0.14mi | 3/1.0 | 1,370 (+11%) | 4mo | $12,000 | $9 | 72 |
| 2617 York St | 0.22mi | 3/1.0 | 1,154 (-7%) | 9mo | $78,000 | $68 | 71 |
| 2550 York St | 0.10mi | 3/1.0 | 1,398 (+13%) | 6mo | $113,700 | $81 | 69 |
| 2125 Valentine St | 0.38mi | 3/1.0 | 1,265 (+2%) | 12mo | $59,000 | $47 | 69 |
| 2220 Genesee St | 0.30mi | 3/2.0 | 1,362 (+10%) | 6mo | $80,000 | $59 | 60 |
| 310 Whittemore St | 0.45mi | 3/3.0 | 1,296 (+5%) | 4mo | $79,800 | $62 | 60 |
| 2023 Woodford St | 0.49mi | 2/1.0 (-1) | 1,152 (-7%) | 3mo | $26,000 | $23 | 58 |
| 266 Milford St | 0.66mi | 3/1.0 | 1,060 (-14%) | 6mo | $120,000 | $113 | 40 |
| 2002 Bakewell St | 0.54mi | 3/1.0 | 1,414 (+14%) | 14mo | $42,500 | $30 | 40 |
Match score weights: distance 35% · size 25% · config 20% · recency 20%. Top-matched comps best support the ARV.
Projected returns pro-forma
-3.0% appreciation · 5.37% rent growth · sell at horizon
- IRR
- 5.5%
- Equity multiple
- 1.22×
- Total profit
- $5,458
- Equity at exit
- $13,404
- IRR
- 16.7%
- Equity multiple
- 2.51×
- Total profit
- $38,091
- Equity at exit
- $7,773
Cash invested: $25,172 (down + closing). Projections, not guarantees.
Landlord ↔ Tenant lean methodology
- Overall (STATE)
- 73 Landlord-Friendly
- State Ohio
- 73 Landlord-Friendly · R+6
- County
- — inherits STATE
- City
- — inherits STATE
ZIP-level market 43605
- Home prices YoY
- -25.6%
- Rents YoY
- 5.4%
- Active inventory
- 117
- Price-to-rent
- 7.2×
Monthly cashflow live
- Estimated rent
- $1,037 high interval (Pro) →
- Mortgage (P&I)
- −$471
- Tax from tax record
- −$35 /mo · $418/yr
- Insurance
- −$37
- HOA
- −$0
- Vacancy / Maint / Mgmt
- −$218
- Net cashflow
- $275
Break-even live
UW: 25.0% down · 7.5% · 30yr · 1.5% tax · 5.0% vac · 8.0% maint · 8.0% mgmt
Financing live
Cash to close
- Down payment
- $22,475
- Closing costs
- $2,697
- Reserves months
- —
- Total cash needed
- —
Loan-product check · same deal, 3 products live
Conventional
25% down · 7.5% · 30yr
- Down + closing
- —
- Monthly P&I
- —
- Monthly cashflow
- —
- DSCR
- —
- Eligible?
- —
Personal DTI + credit; lowest rate.
DSCR
20% down · 8.5% · 30yr
- Down + closing
- —
- Monthly P&I
- —
- Monthly cashflow
- —
- DSCR
- —
- Eligible?
- —
No personal income docs; deal must DSCR.
Hard money
10% down · 12.0% · 12mo
- Down + closing
- —
- Monthly P&I
- —
- Monthly cashflow
- —
- DSCR
- —
- Eligible?
- —
Short-term bridge; refi at stabilization.
Rent comps 11 comps
| Address | Beds | Baths | Sqft | Rent | $/sqft | DOM | Units | Dist |
|---|---|---|---|---|---|---|---|---|
| 2453 Caledonia St Toledo, OH | 2.0 | 1.0 | 1179 | $810 | $0.69 | 14d | 1 | 0.06mi |
| 622 Whitlock Ave Toledo, OH | 3.0 | 1.0 | 925 | $1,195 | $1.29 | 43d | 1 | 0.30mi |
| 1964 Burr St Toledo, OH | 3.0 | 1.0 | 1159 | $1,250 | $1.08 | 43d | 1 | 0.73mi |
| 1848 Genesee St Toledo, OH | 3.0 | 1.0 | 1069 | $1,200 | $1.12 | 43d | 1 | 0.73mi |
| 1848 Genesee St Toledo, OH | 3.0 | 1.0 | 1069 | $1,300 | $1.22 | 23d | 1 | 0.73mi |
| 1951 N Summit St Unit 2 Toledo, OH | 2.0 | 1.0 | 835 | $800 | $0.96 | 43d | 1 | 0.95mi |
| 413 Sandusky St Toledo, OH | 2.0 | 1.0 | 900 | $775 | $0.86 | 23d | 1 | 0.97mi |
| 3148 Corduroy Rd Oregon, OH | 1.0–2.0 | 1.0–1.5 | 800 | $870 | $1.09 | 14d | 1 | 1.02mi |
| 2932 N Ontario St Toledo, OH | 2.0 | 1.0 | 750 | $750 | $1.00 | 23d | 1 | 1.16mi |
| 128 Carbon St Toledo, OH | 3.0 | 1.0 | 1113 | $1,200 | $1.08 | 23d | 1 | 1.37mi |
| 221 Licking St Unit 2 Toledo, OH | 3.0 | 1.0 | 1048 | $1,099 | $1.05 | 23d | 1 | 1.44mi |
Listing history 16 events
-
2026-06-18days on market $89,900 Active 14 DOM
-
2026-06-17days on market $89,900 Active 13 DOM
-
2026-06-16days on market $89,900 Active 12 DOM
-
2026-06-15days on market $89,900 Active 11 DOM
-
2026-06-14days on market $89,900 Active 9 DOM
-
2026-06-10days on market $89,900 Active 6 DOM
-
2026-06-09days on market $89,900 Active 5 DOM
-
2026-06-08days on market $89,900 Active 4 DOM
-
2026-06-07days on market $89,900 Active 3 DOM
-
2026-06-05statusdays on market $89,900 Active 1 DOM
-
2026-06-03days on market $89,900 Coming Soon 8 DOM
-
2026-06-02days on market $89,900 Coming Soon 7 DOM
-
2026-06-01days on market $89,900 Coming Soon 6 DOM
-
2026-05-31days on market $89,900 Coming Soon 5 DOM
-
2026-05-30days on market $89,900 Coming Soon 4 DOM
-
2026-05-26historical $89,900
ⓘ Source: listings_history table (triggers on properties + properties_extension) + one-shot
backfill from property_details.listing_events for pre-trigger history.
Tax reassessment forecast OH · Partial reset (capped growth)
- Current annual tax
- $418 · $35/mo
- Projected year-2 tax
- $910 · $76/mo
- Expected delta
- +$492/yr (+$41/mo · 117.9%)
ⓘ Screening estimate from a state-policy table — verify with the county assessor before closing.
Climate risk First Street
- Flood 1/10 Low FEMA zone X (unshaded) · 0% chance over 30 yrs
- Wildfire 1/10 Low
- Heat 3/10 Moderate 7 d/yr ≥100°F today · 16 d/yr by 30 yrs out
- Wind 2/10 Low
- Air quality 2/10 Low 1 unhealthy d/yr today · 3 by 30 yrs out
Nearby sold comps map
Loading sold comps map…
Walkable amenities ~0.75 mi
Loading nearby amenities…
Taxation est. · year 1
- Rental income
- $12,439
- − Mortgage interest
- −$5,036
- − Property taxes
- −$418
- − Insurance
- −$450
- − Repairs & maintenance
- −$995
- − Management
- −$995
- − Depreciation
- −$2,615
- Taxable income
- $1,931
- Est. tax owed @ 24.0%
- −$463
- After-tax cash flow
- $2,839/yr
For passive investors: Depreciation is non-cash, so a rental often shows a tax loss while cash-flowing — sheltering income. Rental losses are passive: they offset passive income freely, and up to $25,000/yr can offset ordinary (W-2) income if you actively participate and your MAGI is under $100k (phasing out to $0 by $150k); unused losses carry forward. On sale, claimed depreciation is recaptured at up to 25%, and gains may owe capital-gains tax (a 1031 exchange can defer both). Figures are a year-1 estimate at your 24.0% rate — not tax advice; consult a CPA.
Schools (NCES district)
- District
- Toledo City
- NCES district ID
- 3904490
- Math proficiency
- 15% ▼ -16.00%
- Reading proficiency
- 24% ▼ -13.00%
- Median HH income
- $32,137
- Composite
- 15.76/100
- National rank
- #9276
- State rank
- #634 of 656 in OH
Livability — Toledo
- Score
- 66/100
- State rank
- #645
- US rank
- #11442
Category grades
Schools grade is shown separately in the Schools card above.
Census & demographics
- Census place
- Toledo, OH
- County
- Lucas County · 380,724 people
- City population
- 280,811
- Metro
- Toledo, OH
- Population (ZIP)
- 24,441
- Household income
- $39,118
- Rent vs Own
- Severe rent burden
- 1257.0
Population outlook (Lucas County) Hauer SSP2
- Today (2025)
- 420,751 people
- By 2030
- 410,187 · -2.5%
- By 2040
- 384,019 · -8.7%
- By 2050
- 355,125 · -15.6%
- By 2075
- 291,683 · -30.7%
- By 2100
- 233,670 · -44.5%
Race, ethnicity, and origin ACS 2023
- Neighborhood character
- Diverse neighborhood (Simpson 0.61)
- Race & ethnicity
- White 57% Hispanic / Latino 21% Black 14% Two or more races 14%
- Hispanic origin (detail)
- Mexican 17% Puerto Rican 2%
- Common ancestry
- Romanian 3% Lithuanian 2% Portuguese 1%
- Foreign-born
- 3% · Canada
- Languages at home
- 91% English-only · Spanish 7% Arabic 1%
Political lean MEDSL · Lucas
- 2024 margin
- D (+12.6) · D 55.8% · R 43.2%
- 2008→2024 swing
- -18.9pp toward R · 2008: 31.4pp · 2024: 12.6pp
- All cycles
- 2024: D+12.6 2020: D+16.8 2016: D+17.4 2012: D+30.4 2008: D+31.4
Not yet ingested
- Civics
- —
Market trends
- HPI YoY
- ▼ -47.85%
- Current HPI
- 138.6894
- Rent YoY
- ▲ 5.37%
- Metro
- Toledo, OH
- State GDP YoY
- ▲ 1.98%
- F500 in state
- 48
Industry mix (Fortune 500 HQ in OH)
| Industry | F500 HQs | Revenue |
|---|---|---|
| Insurance | 3 | $145B |
|
||
| Industrial Machinery | 3 | $49B |
|
||
| Financial Services | 3 | $24B |
|
||
| Consumer Goods | 2 | $93B |
|
||
| Aerospace / Defense | 2 | $47B |
|
||
| Utilities | 2 | $33B |
|
||
Price history
1 event — show timeline
- 2026-05-26 Coming Soon $89,900 NORIS
Property tax history
+3.5%/yrLatest (2025): $418 · -0.3% YoY. Source: county tax records.
Cash-flow waterfall
monthlySold comps — $/sqft
last 12 mo · ≤1 miLoading sold comps…