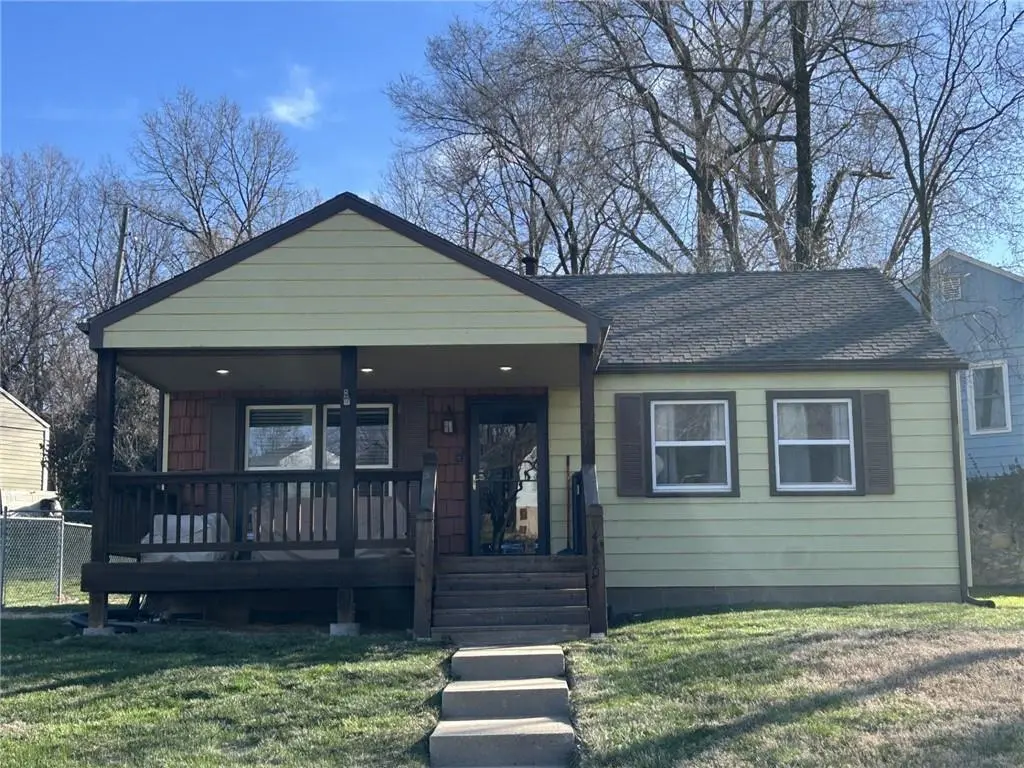
4880 Oakland Ave · Kansas City, KS
Flood risk 4/10 · Minor
- FEMA flood zone
- X (unshaded)
- Chance of flooding over 30 yrs
- 0.22%
- Est. flood insurance / yr
- $473 – $860
Fire risk 1/10 · Minimal
- Est. fire insurance / yr
- $1,154 – $2,142
Heat risk 4/10 · Minor
- Hot days now (above 107°F)
- 7 days/yr
- Hot days in 30 yrs
- 17 days/yr
Wind risk 2/10 · Minimal
- Chance of severe wind over 30 yrs
- —
Air-quality risk 2/10 · Minimal
- Unhealthy air days now
- 2 days/yr
- Unhealthy air days in 30 yrs
- 2 days/yr
Risk factors via First Street. Map © Google.
Why this score? — see what drove the D grade
The composite is a weighted blend of 9 inputs, each scored 0–100. Each bar is that input's sub-score; the figure is the points it added to the 100-point composite (weight × sub-score).
- Cash flow +15.1/30.0
- ARV discount +7.5/15.0
- DSCR +4.6/10.0
- Rent growth +4.6/5.0
- 1% rule +4.0/10.0
- Livability +3.6/5.0
- Condition / age +2.5/5.0
- Schools +0.9/10.0
- Appreciation +0.0/10.0
$140,000
🖨 Deal sheet (PDF) 📄 Offer letter ✓ Due diligence
Listing remarks
* * * MAJOR PRICE DROP - MOTIVATED SELLERS * * * Welcome to this beautifully maintained home, proudly owned by the same sellers since 1978! Built in 1951, it blends timeless charm with meaningful modern updates for comfort, efficiency, and peace of mind. Major system upgrades include a new air conditioner, furnace, hot water heater, and a durable composition roof. Updated plumbing and sewer lines add long-term reliability, while recent tree removal enhances maintenance ease. Inside, original hardwood floors have been professionally refinished and paired with fresh interior paint throughout, creating a bright and inviting feel. The updated kitchen features ceramic tile flooring and cust
Key facts
- 9,148 sq ft lot
- Built 1951
- Listed 57 days
Property features AI
Finance
- Other: Above-grade finished area reported as 768 (per public records)
- HOA & community: No association fees
Exterior
- Parking: Off-street parking
- Utilities: Public water; Public sewer
- Home design: Single-family residence; Ranch floor plan; Residential property; Inside city limits
- Construction: Metal siding; Composition roof; Has crawl space basement; Built approximately 51–75 years ago
- Exterior features: Corner lot; Metal fencing; Accessible doors; Public road maintenance
Interior
- Kitchen: Quartz countertops; Ceramic tile in kitchen; Dishwasher; Gas range; Microwave; Refrigerator; Stainless steel appliances
- Bedrooms: 2 bedrooms on the main level
- Flooring: Tile; Wood
- Bathrooms: 1 full bathroom on the main level
- Heating & cooling: Natural gas heating (hot water); Electric cooling
- Interior features: Ceiling fans; Custom cabinets with painted cabinet finish; All drapes/curtains throughout; Area rugs in living room; Kit/dining combo
- Laundry & utility: Washer and dryer included; Laundry located in the kitchen on the main level
Neighborhood map
What this means for you Summary
Snapshot
- This is a 2-bed/1.0-bath single-family listed at $140k.
Deal economics
- At list price, monthly cash flow is $45 ($542/yr) — positive.
- The deal already cash-flows at list — no discount required.
- To meet the 1% rule (rent ≥ 1% of price), the offer needs to be $125k (10.4% below list).
- Recommended offer: $125k (10.4% below list) — sets the bar for 1% rule.
- Cap rate 6.7% vs local median 4.8% in Kansas City — top-decile yield for the area; either an underpriced asset or a hidden risk that comps aren't pricing in. Stress-test before assuming the spread holds.
Location & tenants
- Location reads 72/100 on livability (#103 in KS) — a middle-class / working-renter tenant base. Strengths: commute A+, cost of living A+, housing A+; Watch: crime F, employment D-.
- Kansas City (urban): math 8% / reading 15% proficiency, ranked #169 of 169 in KS (top 100%) — low school quality limits family demand, transient renter base, plan for 1-2y turnover; 81% free/reduced lunch — lower-income household profile, screen leases tightly.
- Zoned schools: Eugene Ware Elem (math 8% / reading 17%, grade F, #643 of 684 statewide, top 95%, 246 students, 92% FRL); F L Schlagle High (math 2% / reading 8%, grade F, #319 of 327 statewide, top 99%, 792 students, 79% FRL).
- Market conditions: Rents rising fast (+8.4%/yr); 113 active listings in the ZIP; 1 comparable units currently listed for rent nearby; 369 units permitted in Wyandotte County in 2024 (236 in 5+ unit buildings).
Forward outlook
- Local home prices are declining (-3.0%/yr); year-one equity from $968 of loan paydown is wiped out by about $4k of value loss. Plan a longer hold.
- Wyandotte County population projected at +17% by 2050 — long-run rental-demand tailwind backs the buy-and-hold thesis.
Negotiation context
- It's been on market 57 days — a 3% lower offer ($136k) is reasonable based on typical stale-listing flexibility.
Risks & watch-outs
- Watch-outs: built in 1951 — expect roof / HVAC / electrical / plumbing capex.
Questions for the listing agent
- It's been on market 57 days. Have you received any prior offers? Is the seller open to a 10% concession, seller financing, or rate buy-down credit?
- Built in 1951 — when were the roof, HVAC, electrical panel, plumbing, and water heater last replaced?
- Is there a deadline driving the sale (1031 exchange, divorce, estate, relocation)? That informs how much negotiation room exists.
- Schools are F-rated, which usually means shorter tenancies and higher turnover. Who's the typical renter profile here, and what's been the actual vacancy rate?
- Crime grade is F in this area — have there been break-ins, vandalism, or insurance claims at this property in the last 3 years? What carrier currently insures it and at what premium?
- The area grade is low — what's the realistic commute time and amenity access for the typical tenant pool here? Any planned neighborhood developments (good or bad) we should know about?
- What's the average days-on-market for RENTAL listings here right now (not sales)? A rising rental-DOM trend means longer vacancies and softer asking-rent achievability than the comps imply.
- What's the recent tenant-quality profile in this submarket — average credit score on applications, eviction rate, late-payment / NSF rate, and stable-employment percentage? A property-management company in the area should have these aggregated.
- How much new for-sale + rental construction is in the pipeline within 1–3 miles? Heavy new supply typically softens prices + rents 12–24 months out; constrained supply supports both.
Investment metrics
- 1% rule
- 0.90% ✗
- Cap rate
- 6.68%
- Cash-on-cash
- 1.38%
- DSCR
- 1.06
- GRM
- 9.3
CMA / ARV
No comps found within radius.
Projected returns pro-forma
-3.0% appreciation · 8.0% rent growth · sell at horizon
- IRR
- -8.7%
- Equity multiple
- 0.66×
- Total profit
- $-13,178
- Equity at exit
- $20,874
- IRR
- 6.3%
- Equity multiple
- 1.57×
- Total profit
- $22,411
- Equity at exit
- $12,105
Cash invested: $39,200 (down + closing). Projections, not guarantees.
Landlord ↔ Tenant lean methodology
- Overall (STATE)
- 83 Strongly Landlord-Friendly
- State Kansas
- 83 Strongly Landlord-Friendly · R+10
- County
- — inherits STATE
- City
- — inherits STATE
ZIP-level market 66102
- Home prices YoY
- -8.7%
- Rents YoY
- 8.4%
- Active inventory
- 113
- Price-to-rent
- 9.3×
Monthly cashflow live
- Estimated rent
- $1,254 medium interval (Pro) →
- Mortgage (P&I)
- −$734
- Tax from tax record
- −$153 /mo · $1,836/yr
- Insurance
- −$58
- HOA
- −$0
- Vacancy / Maint / Mgmt
- −$263
- Net cashflow
- $45
Break-even live
Sensitivity live
| Price | -10% $124 | -5% $85 | +0% $45 | +5% $6 | +10% $-34 |
|---|---|---|---|---|---|
| Rent | -10% $-54 | -5% $-4 | +0% $45 | +5% $95 | +10% $144 |
| Rate | -1.0pp $116 | -0.5pp $81 | base $45 | +0.5pp $9 | +1.0pp $-28 |
UW: 25.0% down · 7.5% · 30yr · 1.5% tax · 5.0% vac · 8.0% maint · 8.0% mgmt
Financing live
Cash to close
- Down payment
- $35,000
- Closing costs
- $4,200
- Reserves months
- —
- Total cash needed
- —
Loan-product check · same deal, 3 products live
Conventional
25% down · 7.5% · 30yr
- Down + closing
- —
- Monthly P&I
- —
- Monthly cashflow
- —
- DSCR
- —
- Eligible?
- —
Personal DTI + credit; lowest rate.
DSCR
20% down · 8.5% · 30yr
- Down + closing
- —
- Monthly P&I
- —
- Monthly cashflow
- —
- DSCR
- —
- Eligible?
- —
No personal income docs; deal must DSCR.
Hard money
10% down · 12.0% · 12mo
- Down + closing
- —
- Monthly P&I
- —
- Monthly cashflow
- —
- DSCR
- —
- Eligible?
- —
Short-term bridge; refi at stabilization.
Rent comps 1 comps
| Address | Beds | Baths | Sqft | Rent | $/sqft | DOM | Units | Dist |
|---|---|---|---|---|---|---|---|---|
| 1707 Meadowlark Ln Kansas City, KS | 2.0–3.0 | 2.0 | 1236 | $1,395 | $1.13 | 25d | 1 | 1.04mi |
Listing history 7 events
-
2026-05-17status Pending
-
2026-05-15price $140,000
-
2026-05-06price $175,000
-
2026-05-02price $177,655
-
2026-04-10price $179,450
-
2026-03-21$185,000 Active
-
2026-03-21historical $185,000
ⓘ Source: listings_history table (triggers on properties + properties_extension) + one-shot
backfill from property_details.listing_events for pre-trigger history.
Tax reassessment forecast KS · Resets to sale price
- Current annual tax
- $1,836 · $153/mo
- Projected year-2 tax
- $1,974 · $164/mo
- Expected delta
- +$138/yr (+$11/mo · 7.5%)
ⓘ Screening estimate from a state-policy table — verify with the county assessor before closing.
Climate risk First Street
- Flood 4/10 Moderate FEMA zone X (unshaded) · 22% chance over 30 yrs
- Wildfire 1/10 Low
- Heat 4/10 Moderate 7 d/yr ≥107°F today · 17 d/yr by 30 yrs out
- Wind 2/10 Low
- Air quality 2/10 Low 2 unhealthy d/yr today · 2 by 30 yrs out
Nearby sold comps map
Loading sold comps map…
Walkable amenities ~0.75 mi
Loading nearby amenities…
Taxation est. · year 1
- Rental income
- $15,048
- − Mortgage interest
- −$7,842
- − Property taxes
- −$1,836
- − Insurance
- −$700
- − Repairs & maintenance
- −$1,204
- − Management
- −$1,204
- − Depreciation
- −$4,073
- Taxable loss
- −$1,811
- Est. tax savings @ 24.0%
- +$435
- After-tax cash flow
- $976/yr
For passive investors: Depreciation is non-cash, so a rental often shows a tax loss while cash-flowing — sheltering income. Rental losses are passive: they offset passive income freely, and up to $25,000/yr can offset ordinary (W-2) income if you actively participate and your MAGI is under $100k (phasing out to $0 by $150k); unused losses carry forward. On sale, claimed depreciation is recaptured at up to 25%, and gains may owe capital-gains tax (a 1031 exchange can defer both). Figures are a year-1 estimate at your 24.0% rate — not tax advice; consult a CPA.
Schools (NCES district)
- District
- Kansas City
- NCES district ID
- 2007950
- Math proficiency
- 8% ▼ -10.00%
- Reading proficiency
- 15% ▼ -4.00%
- Median HH income
- $34,774
- Composite
- 9.38/100
- National rank
- #9856
- State rank
- #169 of 169 in KS
Livability — Kansas City
- Score
- 72/100
- State rank
- #103
- US rank
- #6054
Category grades
Schools grade is shown separately in the Schools card above.
Census & demographics
- Census place
- Kansas City, KS
- County
- Wyandotte County · 130,206 people
- City population
- 130,206
- Metro
- Kansas City, MO-KS
- Population (ZIP)
- 29,443
- Household income
- $52,861
- Rent vs Own
- Severe rent burden
- 1253.0
Population outlook (Wyandotte County) Hauer SSP2
- Today (2025)
- 177,063 people
- By 2030
- 183,212 · +3.5%
- By 2040
- 195,697 · +10.5%
- By 2050
- 207,897 · +17.4%
- By 2075
- 236,169 · +33.4%
- By 2100
- 255,790 · +44.5%
Race, ethnicity, and origin ACS 2023
- Neighborhood character
- Diverse neighborhood (Simpson 0.65)
- Race & ethnicity
- Hispanic / Latino 53% White 19% Black 17% Two or more races 15% Asian 6% Native American 1%
- Hispanic origin (detail)
- Mexican 43%
- Common ancestry
- Italian 1% Romanian 0%
- Foreign-born
- 28% · Canada, Philippines
- Languages at home
- 52% English-only · Spanish 42% Other Asian/Pacific 5% Other Indo-European 1%
Political lean MEDSL · Wyandotte
- 2024 margin
- Strong D (+23.9) · D 61.1% · R 37.3% · Other 1.6%
- 2008→2024 swing
- -17.0pp toward R · 2008: 40.9pp · 2024: 23.9pp
- All cycles
- 2024: D+23.9 2020: D+30.9 2016: D+29.1 2012: D+36.4 2008: D+40.9
Not yet ingested
- Civics
- —
Market trends
- HPI YoY
- ▼ -36.64%
- Current HPI
- 383.6185
- Rent YoY
- ▲ 8.36%
- Metro
- Kansas City, MO-KS
- State GDP YoY
- —
- F500 in state
- 0
Price history
-24.3% since first listed7 events — show timeline
- 2026-05-17 Pending — Heartland MLS as Distributed by MLS Grid
- 2026-05-15 Price Changed $140,000 Heartland MLS as Distributed by MLS Grid
- 2026-05-06 Price Changed $175,000 Heartland MLS as Distributed by MLS Grid
- 2026-05-02 Price Changed $177,655 Heartland MLS as Distributed by MLS Grid
- 2026-04-10 Price Changed $179,450 Heartland MLS as Distributed by MLS Grid
- 2026-03-21 Listed $185,000 Heartland MLS as Distributed by MLS Grid
- 2026-03-21 Coming Soon $185,000 Heartland MLS as Distributed by MLS Grid
Property tax history
+5.8%/yrLatest (2025): $1,836 · +19.9% YoY. Source: county tax records.
Cash-flow waterfall
monthlySold comps — $/sqft
last 12 mo · ≤1 miLoading sold comps…