225 Jones Rd #104 · Ocean Acres, NJ
Flood risk 1/10 · Minimal
- FEMA flood zone
- X (unshaded)
- Chance of flooding over 30 yrs
- 0.0%
- Est. flood insurance / yr
- $507 – $1,088
Fire risk 8/10 · Major
- Est. fire insurance / yr
- $526 – $976
Heat risk 6/10 · Moderate
- Hot days now (above 102°F)
- 7 days/yr
- Hot days in 30 yrs
- 15 days/yr
Wind risk 6/10 · Moderate
- Chance of severe wind over 30 yrs
- 70.0%
Air-quality risk 2/10 · Minimal
- Unhealthy air days now
- 1 days/yr
- Unhealthy air days in 30 yrs
- 3 days/yr
Risk factors via First Street. Map © Google.
Why this score? — see what drove the C+ grade
The composite is a weighted blend of 9 inputs, each scored 0–100. Each bar is that input's sub-score; the figure is the points it added to the 100-point composite (weight × sub-score).
- Cash flow +27.1/30.0
- DSCR +9.4/10.0
- ARV discount +7.5/15.0
- 1% rule +7.3/10.0
- Livability +3.2/5.0
- Schools +2.7/10.0
- Rent growth +2.5/5.0
- Condition / age +1.0/5.0
- Appreciation +0.0/10.0
$200,000
🖨 Deal sheet 📄 Offer letter ✓ Due diligence
Listing remarks MLS
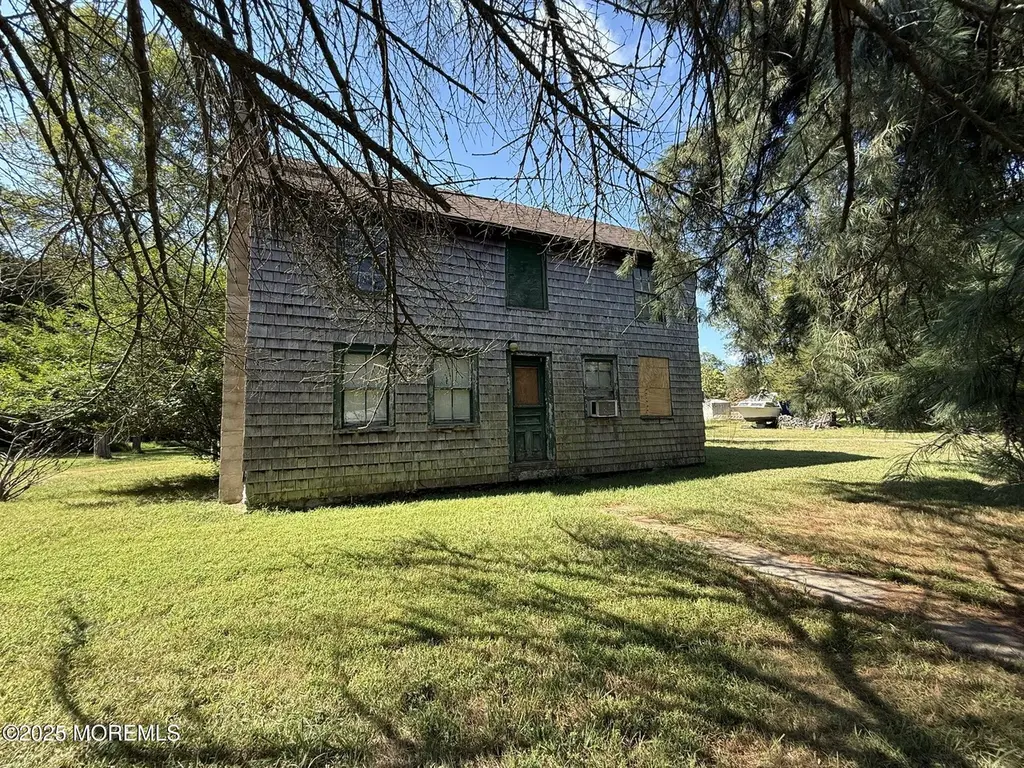
Welcome to your next big adventure: an 1800s house standing proudly (and a bit wobbly) on over an acre of potential paradise! While this charming relic has seen better days- think dusty floors and creaky doors- it's actually a diamond in the rough just waiting for its grand demolition! It's a real tear-down treasure--a time capsule just waiting for you to un-pack its potential! Just picture it: a brand-new home where every wall is straight, every window is shiny, and every creak is replaced with the comforting sound of modern living! Imagine the stories you'll tell about the day you gave this old beauty a one-way ticket to the architectural afterlife! Sure, this property may need a little love (and a bulldozer), but think of it as your golden opportunity to raise the roof and build the home of your dreams! With enough space to do some serious dreaming, you'll have room for everything from a garden, outdoor oasis, or even a mini petting zoo (who doesn't want goats in their backyard?), the sky's the limit! Why settle for a cookie-cutter home when you can craft your own masterpiece in this historical canvas? Grab this opportunity and make your dream home a reality! After all, sometimes you have to break down the past to build a brilliant future.
Key facts
- 1.54 acre lot
- Built 1843
- Listed 78 days
Neighborhood map
What this means for you Summary
Snapshot
- This is a 2-bed/1.0-bath single-family listed at $200k. Condition is rated poor.
Deal economics
- At list price, monthly cash flow is $563 ($7k/yr) — positive.
- The deal already cash-flows at list — no discount required.
- Meets the 1% rule at list price ($2k rent vs $200k).
- Recommended offer: $188k (6.0% below list) — sets the bar for market timing.
- Cap rate 9.7% vs local median 3.2% in Ocean Acres — top-decile yield for the area; either an underpriced asset or a hidden risk that comps aren't pricing in. Stress-test before assuming the spread holds.
Location & tenants
- Location reads 63/100 on livability (#425 in NJ) — a middle-class / working-renter tenant base. Strengths: employment A+, housing A+; Watch: schools C-, amenities F, commute F.
- Ocean Township School District (rural): math 17% / reading 40% proficiency, ranked #345 of 472 in NJ (top 73%) — low school quality limits family demand, transient renter base, plan for 1-2y turnover.
- Market conditions: 253 active listings in the ZIP; solid renter incomes; 4,434 units permitted in Ocean County in 2024 (868 in 5+ unit buildings).
- This rent runs 32% of the median local income ($94k/yr) — at the standard rent-burdened threshold; future hikes will face affordability resistance.
Forward outlook
- Local home prices are declining (-3.0%/yr); year-one equity from $1k of loan paydown is wiped out by about $6k of value loss. Plan a longer hold.
- Ocean County population projected to shrink 8% by 2050 — rents likely to lag national; underwrite the cash flow, not the appreciation.
- At projected returns (-3.0% appreciation + 3.0% rent growth), your $56k cash investment doubles in ~10 years — after that, you're playing with house money.
Negotiation context
- It's been on market 78 days — a 6% lower offer ($188k) is reasonable based on typical stale-listing flexibility.
- 4 sale attempts with the ask held roughly flat each time — persistent listings suggest the price (not the market) is what's stuck; bring a comps-based counter.
Risks & watch-outs
- Watch-outs: built in 1843 — expect roof / HVAC / electrical / plumbing capex.
- Climate carrying-cost: major wind risk, 70% chance of damaging wind over 30y; severe wildfire risk; extreme-heat days projected 7→15/yr by 2055 (HVAC capex compounding) — expect insurance premiums to compound above CPI over the hold.
Questions for the listing agent
- It's been on market 78 days. Have you received any prior offers? Is the seller open to a 6% concession, seller financing, or rate buy-down credit?
- Have any recent inspections been done? Can we get a copy of the seller's disclosures and any deferred-maintenance estimates?
- Built in 1843 — when were the roof, HVAC, electrical panel, plumbing, and water heater last replaced?
- Why hasn't it sold? Are there any deal-killer items the seller is aware of (foundation, flood, title, zoning, code violations)?
- Is there a deadline driving the sale (1031 exchange, divorce, estate, relocation)? That informs how much negotiation room exists.
- What's the average days-on-market for RENTAL listings here right now (not sales)? A rising rental-DOM trend means longer vacancies and softer asking-rent achievability than the comps imply.
- What's the recent tenant-quality profile in this submarket — average credit score on applications, eviction rate, late-payment / NSF rate, and stable-employment percentage? A property-management company in the area should have these aggregated.
- How much new for-sale + rental construction is in the pipeline within 1–3 miles? Heavy new supply typically softens prices + rents 12–24 months out; constrained supply supports both.
Investment metrics
- 1% rule
- 1.23% ✓
- Cap rate
- 9.67%
- Cash-on-cash
- 12.07%
- DSCR
- 1.54
- GRM
- 6.8
CMA / ARV
No comps found within radius.
Projected returns pro-forma
-3.0% appreciation · 3.0% rent growth · sell at horizon
- IRR
- 1.6%
- Equity multiple
- 1.06×
- Total profit
- $3,506
- Equity at exit
- $29,821
- IRR
- 11.3%
- Equity multiple
- 1.88×
- Total profit
- $49,403
- Equity at exit
- $17,292
Cash invested: $56,000 (down + closing). Projections, not guarantees.
Landlord ↔ Tenant lean methodology
- Overall (STATE)
- 21 Tenant-Leaning
- State New Jersey
- 21 Tenant-Leaning · D+6
- County
- — inherits STATE
- City
- — inherits STATE
ZIP-level market 08005
- Active inventory
- 253
- Price-to-rent
- 6.8×
Monthly cashflow live
- Estimated rent
- $2,463 medium interval (Pro) →
- Mortgage (P&I)
- −$1,049
- Tax est. 1.5%
- −$250 /mo · $3,000/yr
- Insurance
- −$83
- HOA
- −$0
- Vacancy / Maint / Mgmt
- −$517
- Net cashflow
- $563
Break-even live
UW: 25.0% down · 7.5% · 30yr · 1.5% tax · 5.0% vac · 8.0% maint · 8.0% mgmt
Financing live
Cash to close
- Down payment
- $50,000
- Closing costs
- $6,000
- Reserves months
- —
- Total cash needed
- —
Loan-product check · same deal, 3 products live
Conventional
25% down · 7.5% · 30yr
- Down + closing
- —
- Monthly P&I
- —
- Monthly cashflow
- —
- DSCR
- —
- Eligible?
- —
Personal DTI + credit; lowest rate.
DSCR
20% down · 8.5% · 30yr
- Down + closing
- —
- Monthly P&I
- —
- Monthly cashflow
- —
- DSCR
- —
- Eligible?
- —
No personal income docs; deal must DSCR.
Hard money
10% down · 12.0% · 12mo
- Down + closing
- —
- Monthly P&I
- —
- Monthly cashflow
- —
- DSCR
- —
- Eligible?
- —
Short-term bridge; refi at stabilization.
Listing history 17 events
-
2026-06-18days on market $200,000 Active 78 DOM
-
2026-06-17days on market $200,000 Active 77 DOM
-
2026-06-16days on market $200,000 Active 76 DOM
-
2026-06-15days on market $200,000 Active 75 DOM
-
2026-06-13days on market $200,000 Active 73 DOM
-
2026-06-09days on market $200,000 Active 69 DOM
-
2026-06-08days on market $200,000 Active 68 DOM
-
2026-06-07days on market $200,000 Active 67 DOM
-
2026-06-04days on market $200,000 Active 64 DOM
-
2026-06-03days on market $200,000 Active 63 DOM
-
2026-06-02days on market $200,000 Active 62 DOM
-
2026-06-01days on market $200,000 Active 61 DOM
-
2026-05-31days on market $200,000 Active 60 DOM
-
2026-04-01$200,000 Active 1262-char remark
Show marketing remark (1262 chars)
Welcome to your next big adventure: an 1800s house standing proudly (and a bit wobbly) on over an acre of potential paradise! While this charming relic has seen better days- think dusty floors and creaky doors- it's actually a diamond in the rough just waiting for its grand demolition! It's a real tear-down treasure--a time capsule just waiting for you to un-pack its potential! Just picture it: a brand-new home where every wall is straight, every window is shiny, and every creak is replaced with the comforting sound of modern living! Imagine the stories you'll tell about the day you gave this old beauty a one-way ticket to the architectural afterlife! Sure, this property may need a little love (and a bulldozer), but think of it as your golden opportunity to raise the roof and build the home of your dreams! With enough space to do some serious dreaming, you'll have room for everything from a garden, outdoor oasis, or even a mini petting zoo (who doesn't want goats in their backyard?), the sky's the limit! Why settle for a cookie-cutter home when you can craft your own masterpiece in this historical canvas? Grab this opportunity and make your dream home a reality! After all, sometimes you have to break down the past to build a brilliant future.
-
2025-09-11$250,000 Active
-
2025-09-11$250,000 Active
ⓘ Source: listings_history table (triggers on properties + properties_extension) + one-shot
backfill from property_details.listing_events for pre-trigger history.
Climate risk First Street
- Flood 1/10 Low FEMA zone X (unshaded) · 0% chance over 30 yrs
- Wildfire 8/10 Severe
- Heat 6/10 Major 7 d/yr ≥102°F today · 15 d/yr by 30 yrs out
- Wind 6/10 Major 70% chance of damaging wind over 30 yrs
- Air quality 2/10 Low 1 unhealthy d/yr today · 3 by 30 yrs out
Nearby sold comps map
Loading sold comps map…
Walkable amenities ~0.75 mi
Loading nearby amenities…
Taxation est. · year 1
- Rental income
- $29,551
- − Mortgage interest
- −$11,203
- − Property taxes
- −$3,000
- − Insurance
- −$1,000
- − Repairs & maintenance
- −$2,364
- − Management
- −$2,364
- − Depreciation
- −$5,818
- Taxable income
- $3,802
- Est. tax owed @ 24.0%
- −$912
- After-tax cash flow
- $5,847/yr
For passive investors: Depreciation is non-cash, so a rental often shows a tax loss while cash-flowing — sheltering income. Rental losses are passive: they offset passive income freely, and up to $25,000/yr can offset ordinary (W-2) income if you actively participate and your MAGI is under $100k (phasing out to $0 by $150k); unused losses carry forward. On sale, claimed depreciation is recaptured at up to 25%, and gains may owe capital-gains tax (a 1031 exchange can defer both). Figures are a year-1 estimate at your 24.0% rate — not tax advice; consult a CPA.
Condition & rehab AI · 12 photos
This property requires extensive renovation, including new kitchen and bathroom fixtures, HVAC system, and landscaping. It has significant potential for resale and rental value once updated.
Repairs flagged
- Major Kitchen countertops — Severe wear and tear.
- Major Kitchen cabinets — Severe wear and tear.
- Major Bathroom fixtures — Severe wear and tear.
- Major Windows — Some windows appear boarded up.
- Major HVAC system — Appears old and may need replacement.
- Major Landscaping — Overgrown lawn and lack of landscaping
Value-add opportunities
- Resale New kitchen countertops and cabinets — Modernizes the kitchen and improves aesthetics.
- Resale New bathroom fixtures — Modernizes the bathroom and improves aesthetics.
- Both New HVAC system — Improves comfort and energy efficiency.
- Both Landscaping and curb appeal — Enhances the home's curb appeal and value.
- Both Painting — Improves the home's appearance and value.
Renovation cost estimate screening
| Repair item | Severity | Est. cost |
|---|---|---|
| Kitchen countertops · Severe wear and tear. | Major | $15,000–50,000 |
| Kitchen cabinets · Severe wear and tear. | Major | $15,000–50,000 |
| Bathroom fixtures · Severe wear and tear. | Major | $15,000–50,000 |
| Windows · Some windows appear boarded up. | Major | $15,000–50,000 |
| HVAC system · Appears old and may need replacement. | Major | $15,000–50,000 |
| Landscaping · Overgrown lawn and lack of landscaping | Major | $15,000–50,000 |
| Total estimated repair cost · 6 items | $90,000–300,000 |
Value-add ROI direction
- Resale New kitchen countertops and cabinets — Modernizes the kitchen and improves aesthetics. ↑
- Resale New bathroom fixtures — Modernizes the bathroom and improves aesthetics. ↑
- Both New HVAC system — Improves comfort and energy efficiency. ↑
- Both Landscaping and curb appeal — Enhances the home's curb appeal and value. ↑
- Both Painting — Improves the home's appearance and value. ↑
ⓘ Cost ranges are severity-bucket heuristics (US national rule-of-thumb). Get contractor quotes + a written scope before underwriting a rehab budget.
Schools (NCES district)
- District
- Ocean Township School District
- NCES district ID
- 3412090
- Math proficiency
- 17% ▼ -19.00%
- Reading proficiency
- 40% ▼ -2.00%
- Median HH income
- $69,115
- Composite
- 26.7/100
- National rank
- #7154
- State rank
- #345 of 472 in NJ
Livability — Ocean Acres
- Score
- 63/100
- State rank
- #425
- US rank
- #15187
Category grades
Schools grade is shown separately in the Schools card above.
Census & demographics
- County
- Ocean County · 439,426 people
- City population
- 25,936
- Metro
- New York-Newark-Jersey City, NY-NJ-PA
- Population (ZIP)
- 26,866
- Household income
- $93,584
- Rent vs Own
- Severe rent burden
- 384.0
Population outlook (Ocean County) Hauer SSP2
- Today (2025)
- 586,991 people
- By 2030
- 581,403 · -1.0%
- By 2040
- 564,913 · -3.8%
- By 2050
- 538,149 · -8.3%
- By 2075
- 468,845 · -20.1%
- By 2100
- 350,297 · -40.3%
Race, ethnicity, and origin ACS 2023
- Neighborhood character
- Predominantly White (86%)
- Race & ethnicity
- White 86% Two or more races 7% Hispanic / Latino 6% Black 3% Asian 1%
- Hispanic origin (detail)
- Puerto Rican 3%
- Common ancestry
- Romanian 9% Scotch-Irish 2% Serbian 1%
- Foreign-born
- 5% · Canada, Vietnam, China
- Languages at home
- 94% English-only · Spanish 2% Other Indo-European 1% Arabic 1%
Political lean MEDSL · Ocean
- 2024 margin
- Solid R (+36.0) · D 31.4% · R 67.4% · Other 1.2%
- 2008→2024 swing
- -17.6pp toward R · 2008: -18.4pp · 2024: -36.0pp
- All cycles
- 2024: R+36.0 2020: R+28.7 2016: R+34.0 2012: R+17.7 2008: R+18.4
Not yet ingested
- Civics
- —
Market trends
- HPI YoY
- ▼ -204.01%
- Current HPI
- 344.3189
- Rent YoY
- —
- Metro
- New York-Newark-Jersey City, NY-NJ-PA
- State GDP YoY
- ▲ 2.05%
- F500 in state
- 34
Industry mix (Fortune 500 HQ in NJ)
| Industry | F500 HQs | Revenue |
|---|---|---|
| Consumer Goods | 3 | $31B |
|
||
| Pharmaceuticals | 2 | $153B |
|
||
| Technology | 2 | $21B |
|
||
| Insurance | 2 | $20B |
|
||
| Healthcare | 2 | $19B |
|
||
| Financial Services | 1 | $70B |
|
||
Price history
-20.0% since first listed4 events — show timeline
- 2026-04-01 Listed $200,000 MOMLS
- 2026-04-01 Listed $200,000 MOMLS
- 2025-09-11 Listed $250,000 MOMLS
- 2025-09-11 Listed $250,000 MOMLS
Cash-flow waterfall
monthlySold comps — $/sqft
last 12 mo · ≤1 miLoading sold comps…