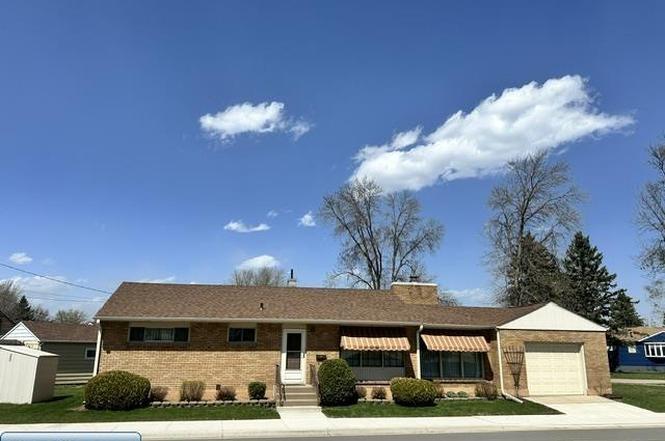
1102 S 12th St · Virginia, MN
Flood risk 7/10 · Major
- FEMA flood zone
- —
- Chance of flooding over 30 yrs
- 0.99%
- Est. flood insurance / yr
- —
Fire risk 4/10 · Minor
- Est. fire insurance / yr
- $888 – $1,650
Heat risk 1/10 · Minimal
- Hot days now (above 91°F)
- 7 days/yr
- Hot days in 30 yrs
- 12 days/yr
Wind risk 1/10 · Minimal
- Chance of severe wind over 30 yrs
- —
Air-quality risk 2/10 · Minimal
- Unhealthy air days now
- 1 days/yr
- Unhealthy air days in 30 yrs
- 2 days/yr
Risk factors via First Street. Map © Google.
Why this score? — see what drove the F grade
The composite is a weighted blend of 9 inputs, each scored 0–100. Each bar is that input's sub-score; the figure is the points it added to the 100-point composite (weight × sub-score).
- Cash flow +10.6/30.0
- Schools +5.0/10.0
- Livability +3.2/5.0
- DSCR +3.1/10.0
- Rent growth +2.5/5.0
- Condition / age +2.5/5.0
- 1% rule +2.0/10.0
- ARV discount +1.0/15.0
- Appreciation +0.0/10.0
$175,000
🖨 Deal sheet (PDF) 📄 Offer letter ✓ Due diligence
Listing remarks
This charming corner-lot brick home has been lovingly maintained by the same family for over 60 years. The main level features three bedrooms, an eat-in kitchen, and a cozy den with a wood-burning fireplace. An attached one-car garage adds everyday convenience. The home offers a poured concrete basement with a bathroom already in place and plenty of space ready for you to finish and make your own. Recent updates include a brand-new gas forced-air furnace, new washer and dryer, a new roof and gutters installed in fall of 2024, and a newer dishwasher. A solid, well-cared-for home with great potential—ready for its next chapter.
Key facts
- Corner-lot
- Brick home
- Eat-in kitchen
Tags
Property features AI
Exterior
- Parking: Attached garage (1 car)
- Utilities: Public water; Public sewer
- Home design: Single family residence; One-story
- Construction: Frame construction; Asphalt shingle roof
- Exterior features: Patio; Irregular lot
Interior
- Kitchen: Dishwasher; Electric range
- Heating & cooling: Forced air heating (natural gas and electric); Window unit cooling
- Interior features: Wood-burning fireplace (1); Full basement
- Laundry & utility: Washer; Dryer; Electric dryer hookup; Electric water heater
Neighborhood map
What this means for you Summary
Snapshot
- This is a 2-bed/2.0-bath single-family listed at $175k.
Deal economics
- At list price, monthly cash flow is $-87 ($-1k/yr) — negative.
- To cash-flow at today's rent, offer at most $160k (8.7% below list).
- To meet the 1% rule (rent ≥ 1% of price), the offer needs to be $123k (29.8% below list).
- Recommended offer: $123k (29.8% below list) — sets the bar for 1% rule.
- Cap rate 5.7% vs local median 7.7% in Virginia — below-typical yield; the buyer is paying a premium for something (appreciation thesis, condition, location) that the cap rate doesn't capture.
Location & tenants
- Location reads 63/100 on livability (#664 in MN) — a middle-class / working-renter tenant base. Strengths: cost of living A+, housing A+; Watch: schools C-, crime D, health & safety D.
- Market conditions: 65 active listings in the ZIP; 1 comparable units currently listed for rent nearby; 639 units permitted in St. Louis County in 2024 (338 in 5+ unit buildings).
Forward outlook
- Local home prices are declining (-3.0%/yr); year-one equity from $1k of loan paydown is wiped out by about $5k of value loss. Plan a longer hold.
Negotiation context
- It's been on market 109 days — a 9% lower offer ($159k) is reasonable based on typical stale-listing flexibility.
Risks & watch-outs
- Watch-outs: built in 1953 — expect roof / HVAC / electrical / plumbing capex.
- Climate carrying-cost: major flood risk — expect insurance premiums to compound above CPI over the hold.
Questions for the listing agent
- What do current leases actually rent for vs. the listed asking? Can we see a recent rent roll and the last 12 months of T-12 income?
- It's been on market 109 days. Have you received any prior offers? Is the seller open to a 30% concession, seller financing, or rate buy-down credit?
- Built in 1953 — when were the roof, HVAC, electrical panel, plumbing, and water heater last replaced?
- Why hasn't it sold? Are there any deal-killer items the seller is aware of (foundation, flood, title, zoning, code violations)?
- Is there a deadline driving the sale (1031 exchange, divorce, estate, relocation)? That informs how much negotiation room exists.
- Crime grade is D in this area — have there been break-ins, vandalism, or insurance claims at this property in the last 3 years? What carrier currently insures it and at what premium?
- The area grade is low — what's the realistic commute time and amenity access for the typical tenant pool here? Any planned neighborhood developments (good or bad) we should know about?
- What's the average days-on-market for RENTAL listings here right now (not sales)? A rising rental-DOM trend means longer vacancies and softer asking-rent achievability than the comps imply.
- What's the recent tenant-quality profile in this submarket — average credit score on applications, eviction rate, late-payment / NSF rate, and stable-employment percentage? A property-management company in the area should have these aggregated.
- How much new for-sale + rental construction is in the pipeline within 1–3 miles? Heavy new supply typically softens prices + rents 12–24 months out; constrained supply supports both.
Investment metrics
- 1% rule
- 0.70% ✗
- Cap rate
- 5.70%
- Cash-on-cash
- -2.12%
- DSCR
- 0.91
- GRM
- 11.9
CMA / ARV
- ARV (on-the-fly)
- $153,035
- Comps found
- 12
Show comp detail 12 sales within ~0.75 mi
| Address | Dist | Beds/Ba | Sqft | Sold | Price | $/sf | Match |
|---|---|---|---|---|---|---|---|
| 1101 13th St S | 0.03mi | 3/2.0 (+1) | 1,351 (+12%) | 2mo | $185,500 | $137 | 72 |
| 1509 11th St St S | 0.41mi | 3/1.8 (+1) | 1,248 (+4%) | 5mo | $122,000 | $98 | 65 |
| 1319 13th St S | 0.23mi | 3/2.0 (+1) | 1,378 (+14%) | 6mo | $189,000 | $137 | 56 |
| 1428 10th St St S | 0.38mi | 3/1.0 (+1) | 1,344 (+12%) | 2mo | $131,500 | $98 | 52 |
| 1510 9th St S | 0.45mi | 3/1.0 (+1) | 1,120 (-7%) | 7mo | $85,000 | $76 | 52 |
| 522 S 11th St | 0.48mi | 2/2.0 | 1,296 (+8%) | 20mo | $131,000 | $101 | 49 |
| 605 13th St S | 0.40mi | 2/1.2 | 1,080 (-10%) | 15mo | $122,000 | $113 | 48 |
| 815 6th St St S | 0.42mi | 3/1.8 (+1) | 1,258 (+4%) | 23mo | $160,000 | $127 | 48 |
| 311 S 9th St | 0.72mi | 3/2.0 (+1) | 1,296 (+8%) | 2mo | $103,000 | $79 | 47 |
| 1534 10th Street South St | 0.47mi | 3/1.8 (+1) | 1,357 (+13%) | 12mo | $174,900 | $129 | 41 |
| 301 S 10th Ave | 0.60mi | 3/1.5 (+1) | 1,251 (+4%) | 22mo | $165,000 | $132 | 40 |
| 1510 12th Street South St | 0.39mi | 3/1.5 (+1) | 1,046 (-13%) | 18mo | $150,000 | $143 | 37 |
Match score weights: distance 35% · size 25% · config 20% · recency 20%. Top-matched comps best support the ARV.
Projected returns pro-forma
-3.0% appreciation · 3.0% rent growth · sell at horizon
- IRR
- -19.9%
- Equity multiple
- 0.31×
- Total profit
- $-33,946
- Equity at exit
- $26,093
- IRR
- -12.9%
- Equity multiple
- 0.25×
- Total profit
- $-36,964
- Equity at exit
- $15,131
Cash invested: $49,000 (down + closing). Projections, not guarantees.
Landlord ↔ Tenant lean methodology
- Overall (STATE)
- 46 Balanced
- State Minnesota
- 46 Balanced · D+2
- County
- — inherits STATE
- City
- — inherits STATE
ZIP-level market 55792
- Home prices YoY
- -26.5%
- Active inventory
- 65
- Price-to-rent
- 11.9×
Monthly cashflow live
- Estimated rent
- $1,229 medium interval (Pro) →
- Mortgage (P&I)
- −$918
- Tax from tax record
- −$67 /mo · $804/yr
- Insurance
- −$73
- HOA
- −$0
- Vacancy / Maint / Mgmt
- −$258
- Net cashflow
- $-87
Break-even live
Sensitivity live
| Price | -10% $12 | -5% $-37 | +0% $-87 | +5% $-136 | +10% $-186 |
|---|---|---|---|---|---|
| Rent | -10% $-184 | -5% $-135 | +0% $-87 | +5% $-38 | +10% $11 |
| Rate | -1.0pp $2 | -0.5pp $-42 | base $-87 | +0.5pp $-132 | +1.0pp $-178 |
UW: 25.0% down · 7.5% · 30yr · 1.5% tax · 5.0% vac · 8.0% maint · 8.0% mgmt
Financing live
Cash to close
- Down payment
- $43,750
- Closing costs
- $5,250
- Reserves months
- —
- Total cash needed
- —
Loan-product check · same deal, 3 products live
Conventional
25% down · 7.5% · 30yr
- Down + closing
- —
- Monthly P&I
- —
- Monthly cashflow
- —
- DSCR
- —
- Eligible?
- —
Personal DTI + credit; lowest rate.
DSCR
20% down · 8.5% · 30yr
- Down + closing
- —
- Monthly P&I
- —
- Monthly cashflow
- —
- DSCR
- —
- Eligible?
- —
No personal income docs; deal must DSCR.
Hard money
10% down · 12.0% · 12mo
- Down + closing
- —
- Monthly P&I
- —
- Monthly cashflow
- —
- DSCR
- —
- Eligible?
- —
Short-term bridge; refi at stabilization.
Rent comps 1 comps
| Address | Beds | Baths | Sqft | Rent | $/sqft | DOM | Units | Dist |
|---|---|---|---|---|---|---|---|---|
| 117 2nd St N Unit 2 Virginia, MN | 3.0 | 1.0 | 970 | $1,535 | $1.58 | 15d | 1 | 1.23mi |
Listing history 20 events
-
2026-06-21days on market $175,000 Active 109 DOM
-
2026-06-19days on market $175,000 Active 107 DOM
-
2026-06-18days on market $175,000 Active 106 DOM
-
2026-06-17days on market $175,000 Active 105 DOM
-
2026-06-16days on market $175,000 Active 104 DOM
-
2026-06-15days on market $175,000 Active 103 DOM
-
2026-06-14days on market $175,000 Active 101 DOM
-
2026-06-13days on market $175,000 Active 100 DOM
-
2026-06-10days on market $175,000 Active 98 DOM
-
2026-06-09days on market $175,000 Active 97 DOM
-
2026-06-08days on market $175,000 Active 96 DOM
-
2026-06-07days on market $175,000 Active 95 DOM
-
2026-06-05days on market $175,000 Active 92 DOM
-
2026-06-03days on market $175,000 Active 91 DOM
-
2026-06-02days on market $175,000 Active 90 DOM
-
2026-06-01days on market $175,000 Active 89 DOM
-
2026-05-31days on market $175,000 Active 88 DOM
-
2026-05-30days on market $175,000 Active 87 DOM
-
2026-05-12price $175,000
-
2026-03-03$185,000 Active
ⓘ Source: listings_history table (triggers on properties + properties_extension) + one-shot
backfill from property_details.listing_events for pre-trigger history.
Tax reassessment forecast MN · Partial reset (capped growth)
- Current annual tax
- $804 · $67/mo
- Projected year-2 tax
- $1,382 · $115/mo
- Expected delta
- +$578/yr (+$48/mo · 71.9%)
ⓘ Screening estimate from a state-policy table — verify with the county assessor before closing.
Climate risk First Street
- Flood 7/10 Severe 99% chance over 30 yrs
- Wildfire 4/10 Moderate
- Heat 1/10 Low 7 d/yr ≥91°F today · 12 d/yr by 30 yrs out
- Wind 1/10 Low
- Air quality 2/10 Low 1 unhealthy d/yr today · 2 by 30 yrs out
Nearby sold comps map
Loading sold comps map…
Walkable amenities ~0.75 mi
Loading nearby amenities…
Taxation est. · year 1
- Rental income
- $14,750
- − Mortgage interest
- −$9,803
- − Property taxes
- −$804
- − Insurance
- −$875
- − Repairs & maintenance
- −$1,180
- − Management
- −$1,180
- − Depreciation
- −$5,091
- Taxable loss
- −$4,182
- Est. tax savings @ 24.0%
- +$1,004
- After-tax cash flow
- $-35/yr
For passive investors: Depreciation is non-cash, so a rental often shows a tax loss while cash-flowing — sheltering income. Rental losses are passive: they offset passive income freely, and up to $25,000/yr can offset ordinary (W-2) income if you actively participate and your MAGI is under $100k (phasing out to $0 by $150k); unused losses carry forward. On sale, claimed depreciation is recaptured at up to 25%, and gains may owe capital-gains tax (a 1031 exchange can defer both). Figures are a year-1 estimate at your 24.0% rate — not tax advice; consult a CPA.
Schools (NCES district)
No district data.
Livability — Virginia
- Score
- 63/100
- State rank
- #664
- US rank
- #15991
Category grades
Schools grade is shown separately in the Schools card above.
Census & demographics
- Census place
- Virginia, MN
- County
- Saint Louis County · 115,152 people
- City population
- 9,663
- Metro
- Duluth, MN-WI
- Population (ZIP)
- 9,663
- Household income
- $53,750
- Rent vs Own
- Severe rent burden
- 286.0
Population outlook (St. Louis County) Hauer SSP2
- Today (2025)
- 202,411 people
- By 2030
- 203,234 · +0.4%
- By 2040
- 202,520 · +0.1%
- By 2050
- 200,853 · -0.8%
- By 2075
- 200,943 · -0.7%
- By 2100
- 192,058 · -5.1%
Race, ethnicity, and origin ACS 2023
- Neighborhood character
- Predominantly White (90%)
- Race & ethnicity
- White 90% Two or more races 4% Native American 3% Asian 1%
- Common ancestry
- Portuguese 12% Romanian 4% Lithuanian 2%
- Foreign-born
- 2% · Canada, Vietnam
- Languages at home
- 96% English-only · Spanish 1% Other Asian/Pacific 1%
Political lean MEDSL · St. Louis
- 2024 margin
- D (+13.7) · D 55.9% · R 42.2% · Other 1.8%
- 2008→2024 swing
- -18.8pp toward R · 2008: 32.5pp · 2024: 13.7pp
- All cycles
- 2024: D+13.7 2020: D+15.6 2016: D+11.8 2012: D+29.6 2008: D+32.5
Not yet ingested
- Civics
- —
Market trends
- HPI YoY
- ▼ -72.05%
- Current HPI
- 199.7165
- Rent YoY
- —
- Metro
- Duluth, MN-WI
- State GDP YoY
- ▲ 2.41%
- F500 in state
- 34
Industry mix (Fortune 500 HQ in MN)
| Industry | F500 HQs | Revenue |
|---|---|---|
| Healthcare | 2 | $407B |
|
||
| Retail | 2 | $150B |
|
||
| Consumer Goods | 2 | $32B |
|
||
| Industrial Machinery | 2 | $6B |
|
||
| Agriculture | 1 | $40B |
|
||
| Healthcare / Medical Devices | 1 | $32B |
|
||
Price history
-5.4% since first listed2 events — show timeline
- 2026-05-12 Price Changed $175,000 RAOR
- 2026-03-03 Listed $185,000 RAOR
Property tax history
-2.4%/yrLatest (2025): $804 · -56.6% YoY. Source: county tax records.
Cash-flow waterfall
monthlySold comps — $/sqft
last 12 mo · ≤1 miLoading sold comps…