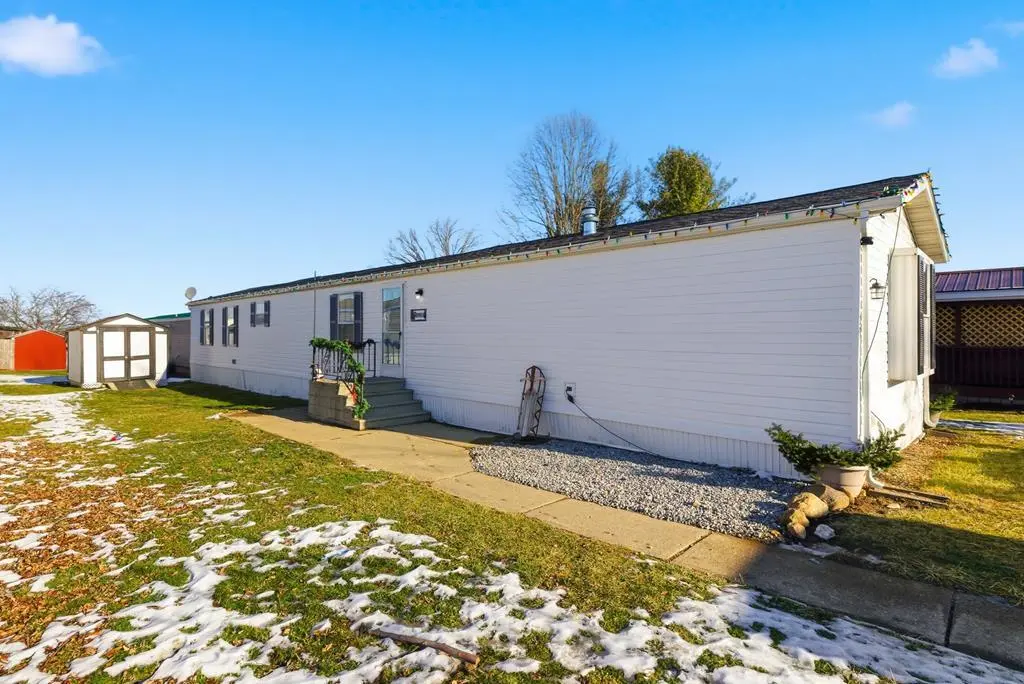
107 Township Rd. 810 Lot 23 · West Salem, OH
Flood risk 1/10 · Minimal
- FEMA flood zone
- X (unshaded)
- Chance of flooding over 30 yrs
- 0.0%
- Est. flood insurance / yr
- $507 – $1,088
Fire risk 1/10 · Minimal
- Est. fire insurance / yr
- $713 – $1,323
Heat risk 2/10 · Minimal
- Hot days now (above 97°F)
- 7 days/yr
- Hot days in 30 yrs
- 16 days/yr
Wind risk 2/10 · Minimal
- Chance of severe wind over 30 yrs
- —
Air-quality risk 2/10 · Minimal
- Unhealthy air days now
- 1 days/yr
- Unhealthy air days in 30 yrs
- 2 days/yr
Risk factors via First Street. Map © Google.
Why this score? — see what drove the A grade
The composite is a weighted blend of 9 inputs, each scored 0–100. Each bar is that input's sub-score; the figure is the points it added to the 100-point composite (weight × sub-score).
- Cash flow +30.0/30.0
- ARV discount +15.0/15.0
- 1% rule +10.0/10.0
- DSCR +10.0/10.0
- Appreciation +10.0/10.0
- Schools +5.2/10.0
- Livability +3.4/5.0
- Rent growth +2.5/5.0
- Condition / age +2.5/5.0
$44,900
🖨 Deal sheet 📄 Offer letter ✓ Due diligence
Listing remarks MLS
Check out this 3 bedroom, 2 bath manufactured home located in Hidden Acres Park. Spacious open concept living, primary bedroom with full bath. Newer roof and gutters. Lake and seasonal pool use included with lot rent. Water, sewer and trash is also included. Call today to schedule a showing!
Key facts
- Roof 2019
- Built 1992
- Listed 130 days
Tags
Neighborhood map
What this means for you Summary
Snapshot
- This is a 3-bed/2.0-bath single-family listed at $45k.
Deal economics
- At list price, monthly cash flow is $581 ($7k/yr) — positive.
- The deal already cash-flows at list — no discount required.
- Meets the 1% rule at list price ($1k rent vs $45k).
- Recommended offer: $40k (12.0% below list) — sets the bar for market timing.
Location & tenants
- Location reads 67/100 on livability (#611 in OH) — a middle-class / working-renter tenant base. Strengths: crime A+, cost of living A+, housing A+; Watch: amenities F, commute F, health & safety F.
- Black River Local (rural): math 55% / reading 66% proficiency, ranked #278 of 656 in OH (top 42%) — acceptable for families but not a draw, mixed tenant base, ~2y average lease.
- Market conditions: 59 active listings in the ZIP; 61 units permitted in Ashland County in 2024 (0 in 5+ unit buildings).
Forward outlook
- In year one you build about $5k of equity ($310 loan paydown + $4k appreciation (10.0% local appreciation)).
- Ashland County population projected at -13% by 2050 — secular population decline; favor cash flow + early exit over multi-decade hold.
- At projected returns (10.0% appreciation + 3.0% rent growth), your $13k cash investment doubles in ~2 years — after that, you're playing with house money.
- By year 7, paydown + projected appreciation supports a ~$35k cash-out refi (75% LTV) — recoverable capital for the next deal without selling this one.
Negotiation context
- It's been on market 130 days — a 12% lower offer ($40k) is reasonable based on typical stale-listing flexibility.
- 4 sale attempts since 9y ago; this cycle's ask has dropped $25k (36%) from the opening price — seller is motivated, your offer sets the floor, not the list.
- Current owner paid $33k; 36% above their basis — modest negotiation headroom, anchor on the comps not their cost.
Questions for the listing agent
- It's been on market 130 days. Have you received any prior offers? Is the seller open to a 12% concession, seller financing, or rate buy-down credit?
- Why hasn't it sold? Are there any deal-killer items the seller is aware of (foundation, flood, title, zoning, code violations)?
- Is there a deadline driving the sale (1031 exchange, divorce, estate, relocation)? That informs how much negotiation room exists.
- What's the average days-on-market for RENTAL listings here right now (not sales)? A rising rental-DOM trend means longer vacancies and softer asking-rent achievability than the comps imply.
- What's the recent tenant-quality profile in this submarket — average credit score on applications, eviction rate, late-payment / NSF rate, and stable-employment percentage? A property-management company in the area should have these aggregated.
- How much new for-sale + rental construction is in the pipeline within 1–3 miles? Heavy new supply typically softens prices + rents 12–24 months out; constrained supply supports both.
Investment metrics
- 1% rule
- 2.51% ✓
- Cap rate
- 21.83%
- Cash-on-cash
- 55.48%
- DSCR
- 3.47
- GRM
- 3.3
CMA / ARV
- ARV (on-the-fly)
- $64,448
- Comps found
- 4
Show comp detail 4 sales within ~0.75 mi
| Address | Dist | Beds/Ba | Sqft | Sold | Price | $/sf | Match |
|---|---|---|---|---|---|---|---|
| 107 Township Road 810 Lot 23 | 0.00mi | 3/2.0 | 1,216 (0%) | 0mo | $49,900 | $41 | 100 |
| 107 Township Road 810 #17 | 0.02mi | 3/2.0 | 1,216 (0%) | 1mo | $64,000 | $53 | 98 |
| 107 Township Road 810 #17 | 0.02mi | 3/2.0 | 1,216 (0%) | 1mo | $64,000 | $53 | 98 |
| 107 Township Road 810 #12 | 0.02mi | 3/2.0 | 1,152 (-5%) | 0mo | $63,400 | $55 | 90 |
Match score weights: distance 35% · size 25% · config 20% · recency 20%. Top-matched comps best support the ARV.
Projected returns pro-forma
10.0% appreciation · 3.0% rent growth · sell at horizon
- IRR
- 68.3%
- Equity multiple
- 5.89×
- Total profit
- $61,493
- Equity at exit
- $40,449
- IRR
- 62.0%
- Equity multiple
- 13.09×
- Total profit
- $152,007
- Equity at exit
- $87,231
Cash invested: $12,572 (down + closing). Projections, not guarantees.
Landlord ↔ Tenant lean methodology
- Overall (STATE)
- 73 Landlord-Friendly
- State Ohio
- 73 Landlord-Friendly · R+6
- County
- — inherits STATE
- City
- — inherits STATE
ZIP-level market 44287
- Home prices YoY
- 6.5%
- Active inventory
- 59
- Price-to-rent
- 3.3×
Monthly cashflow live
- Estimated rent
- $1,129 medium interval (Pro) →
- Mortgage (P&I)
- −$235
- Tax est. 1.5%
- −$56 /mo · $674/yr
- Insurance
- −$19
- HOA
- −$0
- Vacancy / Maint / Mgmt
- −$237
- Net cashflow
- $581
Break-even live
UW: 25.0% down · 7.5% · 30yr · 1.5% tax · 5.0% vac · 8.0% maint · 8.0% mgmt
Financing live
Cash to close
- Down payment
- $11,225
- Closing costs
- $1,347
- Reserves months
- —
- Total cash needed
- —
Loan-product check · same deal, 3 products live
Conventional
25% down · 7.5% · 30yr
- Down + closing
- —
- Monthly P&I
- —
- Monthly cashflow
- —
- DSCR
- —
- Eligible?
- —
Personal DTI + credit; lowest rate.
DSCR
20% down · 8.5% · 30yr
- Down + closing
- —
- Monthly P&I
- —
- Monthly cashflow
- —
- DSCR
- —
- Eligible?
- —
No personal income docs; deal must DSCR.
Hard money
10% down · 12.0% · 12mo
- Down + closing
- —
- Monthly P&I
- —
- Monthly cashflow
- —
- DSCR
- —
- Eligible?
- —
Short-term bridge; refi at stabilization.
Listing history 18 events
-
2026-04-30status Pending
-
2026-04-29status Pending
-
2026-04-29historical
-
2026-04-07price $44,900
-
2026-04-07price $44,900
-
2026-03-19price $49,900
-
2026-03-19price $49,900
-
2026-03-01price $54,900
-
2026-03-01price $54,900
-
2026-01-15price $59,000
-
2026-01-15price $59,000
-
2025-12-20$69,900 Active
-
2025-12-20$69,900 Active
-
2024-06-03soldstatus $33,000 Closed 292-char remark
Show marketing remark (292 chars)
Check out this 3 bedroom, 2 bath manufactured home located in Hidden Acres Park. Spacious open concept living, primary bedroom with full bath. Newer roof and gutters. Lake and seasonal pool use included with lot rent. Water, sewer and trash is also included. Call today to schedule a showing!
-
2024-04-26historical Active Under Contract 292-char remark
Show marketing remark (292 chars)
Check out this 3 bedroom, 2 bath manufactured home located in Hidden Acres Park. Spacious open concept living, primary bedroom with full bath. Newer roof and gutters. Lake and seasonal pool use included with lot rent. Water, sewer and trash is also included. Call today to schedule a showing!
-
2024-04-22$33,000 Active 292-char remark
Show marketing remark (292 chars)
Check out this 3 bedroom, 2 bath manufactured home located in Hidden Acres Park. Spacious open concept living, primary bedroom with full bath. Newer roof and gutters. Lake and seasonal pool use included with lot rent. Water, sewer and trash is also included. Call today to schedule a showing!
-
2017-06-02soldstatus $20,000
-
2017-02-22$20,000
ⓘ Source: listings_history table (triggers on properties + properties_extension) + one-shot
backfill from property_details.listing_events for pre-trigger history.
Climate risk First Street
- Flood 1/10 Low FEMA zone X (unshaded) · 0% chance over 30 yrs
- Wildfire 1/10 Low
- Heat 2/10 Low 7 d/yr ≥97°F today · 16 d/yr by 30 yrs out
- Wind 2/10 Low
- Air quality 2/10 Low 1 unhealthy d/yr today · 2 by 30 yrs out
Nearby sold comps map
Loading sold comps map…
Walkable amenities ~0.75 mi
Loading nearby amenities…
Taxation est. · year 1
- Rental income
- $13,543
- − Mortgage interest
- −$2,515
- − Property taxes
- −$674
- − Insurance
- −$224
- − Repairs & maintenance
- −$1,083
- − Management
- −$1,083
- − Depreciation
- −$1,306
- Taxable income
- $6,657
- Est. tax owed @ 24.0%
- −$1,598
- After-tax cash flow
- $5,378/yr
For passive investors: Depreciation is non-cash, so a rental often shows a tax loss while cash-flowing — sheltering income. Rental losses are passive: they offset passive income freely, and up to $25,000/yr can offset ordinary (W-2) income if you actively participate and your MAGI is under $100k (phasing out to $0 by $150k); unused losses carry forward. On sale, claimed depreciation is recaptured at up to 25%, and gains may owe capital-gains tax (a 1031 exchange can defer both). Figures are a year-1 estimate at your 24.0% rate — not tax advice; consult a CPA.
Schools (NCES district)
- District
- Black River Local
- NCES district ID
- 3904846
- Math proficiency
- 55% ▼ -14.00%
- Reading proficiency
- 66% ▼ -7.00%
- Median HH income
- $54,027
- Composite
- 51.84/100
- National rank
- #1665
- State rank
- #278 of 656 in OH
Livability — West Salem
- Score
- 67/100
- State rank
- #611
- US rank
- #10537
Category grades
Schools grade is shown separately in the Schools card above.
Census & demographics
- County
- Wayne · 117,095 people
- Population (ZIP)
- 7,892
- Household income
- $71,146
- Rent vs Own
- Severe rent burden
- 6.1
Population outlook (Ashland County) Hauer SSP2
- Today (2025)
- 52,732 people
- By 2030
- 51,728 · -1.9%
- By 2040
- 48,956 · -7.2%
- By 2050
- 46,070 · -12.6%
- By 2075
- 38,945 · -26.1%
- By 2100
- 30,883 · -41.4%
Race, ethnicity, and origin ACS 2023
- Neighborhood character
- Predominantly White (97%)
- Race & ethnicity
- White 97% Two or more races 2% Hispanic / Latino 2%
- Common ancestry
- Iranian 7% Romanian 5% Subsaharan African 3%
- Foreign-born
- 4% · Canada
- Languages at home
- 89% English-only · German/W. Germanic 9% Other Indo-European 2%
Political lean MEDSL · Ashland
- 2024 margin
- Solid R (+50.0) · D 24.5% · R 74.5%
- 2008→2024 swing
- -26.7pp toward R · 2008: -23.3pp · 2024: -50.0pp
- All cycles
- 2024: R+50.0 2020: R+48.7 2016: R+47.8 2012: R+30.0 2008: R+23.3
Not yet ingested
- Civics
- —
Market trends
- HPI YoY
- ▲ 25.98%
- Current HPI
- 426.21
- Rent YoY
- —
- Metro
- —
- State GDP YoY
- ▲ 1.98%
- F500 in state
- 48
Industry mix (Fortune 500 HQ in OH)
| Industry | F500 HQs | Revenue |
|---|---|---|
| Insurance | 3 | $145B |
|
||
| Industrial Machinery | 3 | $49B |
|
||
| Financial Services | 3 | $24B |
|
||
| Consumer Goods | 2 | $93B |
|
||
| Aerospace / Defense | 2 | $47B |
|
||
| Utilities | 2 | $33B |
|
||
Price history
+124.5% since first listed18 events — show timeline
- 2026-04-30 Pending — ABOR
- 2026-04-29 Pending — MLSNOW
- 2026-04-29 Listing Removed — MLSNOW
- 2026-04-07 Price Changed $44,900 ABOR
- 2026-04-07 Price Changed $44,900 MLSNOW
- 2026-03-19 Price Changed $49,900 MLSNOW
- 2026-03-19 Price Changed $49,900 ABOR
- 2026-03-01 Price Changed $54,900 ABOR
- 2026-03-01 Price Changed $54,900 MLSNOW
- 2026-01-15 Price Changed $59,000 MLSNOW
- 2026-01-15 Price Changed $59,000 ABOR
- 2025-12-20 Listed $69,900 ABOR
- 2025-12-20 Listed $69,900 MLSNOW
- 2024-06-03 Sold (MLS) $33,000 ABOR
- 2024-04-26 Contingent — ABOR
- 2024-04-22 Listed $33,000 ABOR
- 2017-06-02 Sold (MLS) $20,000 MLSNOW
- 2017-02-22 Listed $20,000 MLSNOW
Cash-flow waterfall
monthlySold comps — $/sqft
last 12 mo · ≤1 miLoading sold comps…