 🏷️ Likely Rental
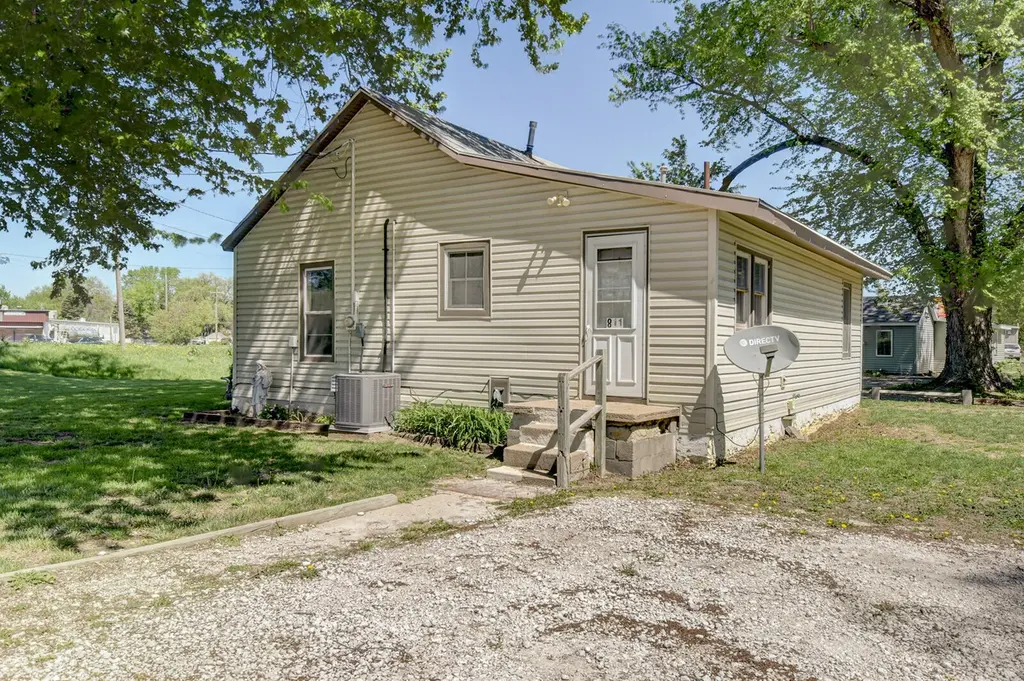
811 S Locust St · Glenwood, IA
Flood risk 9/10 · Severe
- FEMA flood zone
- AE
- Chance of flooding over 30 yrs
- 0.99%
- Est. flood insurance / yr
- $1,737 – $8,500
Fire risk 3/10 · Minor
- Est. fire insurance / yr
- $902 – $1,676
Heat risk 3/10 · Minor
- Hot days now (above 104°F)
- 7 days/yr
- Hot days in 30 yrs
- 15 days/yr
Wind risk 2/10 · Minimal
- Chance of severe wind over 30 yrs
- —
Air-quality risk 1/10 · Minimal
- Unhealthy air days now
- 0 days/yr
- Unhealthy air days in 30 yrs
- 0 days/yr
Risk factors via First Street. Map © Google.
Why this score? — see what drove the B- grade
The composite is a weighted blend of 9 inputs, each scored 0–100. Each bar is that input's sub-score; the figure is the points it added to the 100-point composite (weight × sub-score).
- Cash flow +22.6/30.0
- ARV discount +15.0/15.0
- DSCR +7.2/10.0
- Schools +6.7/10.0
- 1% rule +5.9/10.0
- Livability +4.0/5.0
- Rent growth +2.5/5.0
- Condition / age +2.5/5.0
- Appreciation +0.0/10.0
$110,000
🖨 Deal sheet 📄 Offer letter ✓ Due diligence
Listing remarks
Don't miss this unique opportunity to own two homes on one lot for the price of one! The main house is vacant and ready for some TLC--perfect for buyers looking to customize and make it their own or investors seeking value-add potential. The second, smaller home is already tenant-occupied, offering immediate rental income. Situated on a desirable corner lot, this property provides convenience and flexibility with close proximity to shopping centers, easy interstate access, and more. Whether you're looking to invest, live in one and rent the other, or expand your portfolio, the possibilities here are hard to beat!
Key facts
- Two homes on one lot
- Corner lot
- Built 1920
Tags
Property features AI
Exterior
- Utilities: Natural gas available; Electricity available; Public sewer
- Home design: Single-family residence; One-story
- Construction: Frame construction; Composition roof; Crawl space foundation; Built in 2026
- Exterior features: Other exterior features; Corner lot; Storage structure on property
Interior
- Heating & cooling: Natural gas forced air heating; Central air; Window air conditioning units
- Interior features: Other interior features
- Laundry & utility: Laundry on main level
Neighborhood map
What this means for you Summary
Snapshot
- This is a 2-bed/1.0-bath other listed at $110k.
Deal economics
- At list price, monthly cash flow is $-240 ($-3k/yr) — negative.
- To cash-flow at today's rent, offer at most $75k (31.6% below list).
- Meets the 1% rule at list price ($1k rent vs $110k).
- Recommended offer: $75k (31.6% below list) — sets the bar for cash-flow.
- Cap rate 8.3% vs local median 1.9% in Glenwood — top-decile yield for the area; either an underpriced asset or a hidden risk that comps aren't pricing in. Stress-test before assuming the spread holds.
Location & tenants
- Location reads 81/100 on livability (#56 in IA, #1,306 nationally) — a professional / high-income tenant draw. Strengths: crime A+, cost of living A+, housing A+; Watch: amenities F, commute F.
- Glenwood Community School District (town): math 79% / reading 76% proficiency, ranked #38 of 289 in IA (top 13%) — strong family-tenant draw, lease renewals of 3-5y typical.
- Zoned schools: Glenwood Middle School (math 81% / reading 74%, grade A+, #50 of 246 statewide, top 20%, 451 students, 38% FRL); Glenwood Senior High School (math 73% / reading 76%, grade B+, #89 of 336 statewide, top 30%, 600 students, 35% FRL).
- Market conditions: 31 active listings in the ZIP; 39 units permitted in Mills County in 2024 (0 in 5+ unit buildings).
Forward outlook
- Local home prices are declining (-3.0%/yr); year-one equity from $761 of loan paydown is wiped out by about $3k of value loss. Plan a longer hold.
- Mills County population projected at -16% by 2050 — secular population decline; favor cash flow + early exit over multi-decade hold.
Negotiation context
- Only 6 days on market — expect competitive offers; lowballing is unlikely to land.
Risks & watch-outs
- Watch-outs: flood insurance adds $427/mo; built in 1920 — expect roof / HVAC / electrical / plumbing capex.
- Climate carrying-cost: in FEMA flood zone AE (mandatory federal flood insurance) — expect insurance premiums to compound above CPI over the hold.
Questions for the listing agent
- What do current leases actually rent for vs. the listed asking? Can we see a recent rent roll and the last 12 months of T-12 income?
- Built in 1920 — when were the roof, HVAC, electrical panel, plumbing, and water heater last replaced?
- What's the actual annual flood-insurance premium (NFIP or private), and is the property in a SFHA with mandatory coverage?
- Is there a deadline driving the sale (1031 exchange, divorce, estate, relocation)? That informs how much negotiation room exists.
- Schools are A-rated — typically a magnet for longer-tenancy family renters. What's the average tenant stay here, and is there a school-zone premium baked into asking?
- What's the average days-on-market for RENTAL listings here right now (not sales)? A rising rental-DOM trend means longer vacancies and softer asking-rent achievability than the comps imply.
- What's the recent tenant-quality profile in this submarket — average credit score on applications, eviction rate, late-payment / NSF rate, and stable-employment percentage? A property-management company in the area should have these aggregated.
- How much new for-sale + rental construction is in the pipeline within 1–3 miles? Heavy new supply typically softens prices + rents 12–24 months out; constrained supply supports both.
Investment metrics
- 1% rule
- 1.09% ✓
- Cap rate
- 8.33%
- Cash-on-cash
- 7.27%
- DSCR
- 1.32
- GRM
- 7.6
CMA / ARV
- ARV (median comp)
- $143,255
- List price
- $110,000
- Delta
- -23.21%
- Verdict
- UNDERPRICED
- Comps
- 15 within 1.0 mi
Projected returns pro-forma
-3.0% appreciation · 3.0% rent growth · sell at horizon
- IRR
- -32.5%
- Equity multiple
- -0.07×
- Total profit
- $-32,827
- Equity at exit
- $16,401
- IRR
- -36.1%
- Equity multiple
- -0.53×
- Total profit
- $-47,125
- Equity at exit
- $9,511
Cash invested: $30,800 (down + closing). Projections, not guarantees.
Landlord ↔ Tenant lean methodology
- Overall (STATE)
- 83 Strongly Landlord-Friendly
- State Iowa
- 83 Strongly Landlord-Friendly · R+6
- County
- — inherits STATE
- City
- — inherits STATE
ZIP-level market 51534
- Home prices YoY
- -13.0%
- Active inventory
- 31
- Price-to-rent
- 7.6×
Monthly cashflow live
- Estimated rent
- $1,198 medium interval (Pro) →
- Mortgage (P&I)
- −$577
- Tax est. 1.5%
- −$138 /mo · $1,650/yr
- Insurance
- −$46
- Flood insurance flood zone
- −$427 /mo · $5,118/yr
- HOA
- −$0
- Vacancy / Maint / Mgmt
- −$252
- Net cashflow
- $-240
Break-even live
UW: 25.0% down · 7.5% · 30yr · 1.5% tax · 5.0% vac · 8.0% maint · 8.0% mgmt
Financing live
Cash to close
- Down payment
- $27,500
- Closing costs
- $3,300
- Reserves months
- —
- Total cash needed
- —
Loan-product check · same deal, 3 products live
Conventional
25% down · 7.5% · 30yr
- Down + closing
- —
- Monthly P&I
- —
- Monthly cashflow
- —
- DSCR
- —
- Eligible?
- —
Personal DTI + credit; lowest rate.
DSCR
20% down · 8.5% · 30yr
- Down + closing
- —
- Monthly P&I
- —
- Monthly cashflow
- —
- DSCR
- —
- Eligible?
- —
No personal income docs; deal must DSCR.
Hard money
10% down · 12.0% · 12mo
- Down + closing
- —
- Monthly P&I
- —
- Monthly cashflow
- —
- DSCR
- —
- Eligible?
- —
Short-term bridge; refi at stabilization.
Listing history 3 events
-
2026-05-13$110,000 Active 620-char remark
-
2026-01-27soldstatus $85,000
-
2022-10-28soldstatus $80,000
ⓘ Source: listings_history table (triggers on properties + properties_extension) + one-shot
backfill from property_details.listing_events for pre-trigger history.
Climate risk First Street
- Flood 9/10 Extreme FEMA zone AE · 99% chance over 30 yrs
- Wildfire 3/10 Moderate
- Heat 3/10 Moderate 7 d/yr ≥104°F today · 15 d/yr by 30 yrs out
- Wind 2/10 Low
- Air quality 1/10 Low 0 unhealthy d/yr today · 0 by 30 yrs out
Nearby sold comps map
Loading sold comps map…
Walkable amenities ~0.75 mi
Loading nearby amenities…
Taxation est. · year 1
- Rental income
- $14,382
- − Mortgage interest
- −$6,162
- − Property taxes
- −$1,650
- − Insurance
- −$5,668
- − Repairs & maintenance
- −$1,151
- − Management
- −$1,151
- − Depreciation
- −$3,200
- Taxable loss
- −$4,600
- Est. tax savings @ 24.0%
- +$1,104
- After-tax cash flow
- $-1,775/yr
For passive investors: Depreciation is non-cash, so a rental often shows a tax loss while cash-flowing — sheltering income. Rental losses are passive: they offset passive income freely, and up to $25,000/yr can offset ordinary (W-2) income if you actively participate and your MAGI is under $100k (phasing out to $0 by $150k); unused losses carry forward. On sale, claimed depreciation is recaptured at up to 25%, and gains may owe capital-gains tax (a 1031 exchange can defer both). Figures are a year-1 estimate at your 24.0% rate — not tax advice; consult a CPA.
Schools (NCES district)
- District
- Glenwood Community School District
- NCES district ID
- 1912690
- Math proficiency
- 79% ▬ 0.00%
- Reading proficiency
- 76% ▼ -2.00%
- Median HH income
- $64,166
- Composite
- 66.96/100
- National rank
- #396
- State rank
- #38 of 289 in IA
Livability — Glenwood
- Score
- 81/100
- State rank
- #56
- US rank
- #1306
Category grades
Schools grade is shown separately in the Schools card above.
Census & demographics
- Census place
- Glenwood, IA
- Population (ZIP)
- 9,238
Population outlook (Mills County) Hauer SSP2
- Today (2025)
- 14,342 people
- By 2030
- 13,928 · -2.9%
- By 2040
- 12,997 · -9.4%
- By 2050
- 12,123 · -15.5%
- By 2075
- 10,462 · -27.1%
- By 2100
- 9,025 · -37.1%
Race, ethnicity, and origin ACS 2023
- Neighborhood character
- Predominantly White (92%)
- Race & ethnicity
- White 92% Two or more races 5% Hispanic / Latino 5%
- Common ancestry
- Iranian 4% Italian 4% Portuguese 3%
- Foreign-born
- 1% · Canada
- Languages at home
- 98% English-only · Spanish 1%
Political lean MEDSL · Mills
- 2024 margin
- Solid R (+39.1) · D 29.9% · R 69.0% · Other 1.2%
- 2008→2024 swing
- -22.5pp toward R · 2008: -16.6pp · 2024: -39.1pp
- All cycles
- 2024: R+39.1 2020: R+37.2 2016: R+39.0 2012: R+19.1 2008: R+16.6
Not yet ingested
- Civics
- —
Market trends
- HPI YoY
- ▼ -37.30%
- Current HPI
- 250.2742
- Rent YoY
- —
- Metro
- —
- State GDP YoY
- ▲ 2.48%
- F500 in state
- 4
Industry mix (Fortune 500 HQ in IA)
| Industry | F500 HQs | Revenue |
|---|---|---|
| Financial Services | 1 | $16B |
|
||
| Retail / Convenience | 1 | $15B |
|
||
Price history
+28.7% since first listed5 events — show timeline
- 2026-06-02 Sold (Public Records) $103,000 Public Records
- 2026-05-19 Pending — SWIAR
- 2026-05-13 Listed $110,000 SWIAR
- 2026-01-27 Sold (Public Records) $85,000 Public Records
- 2022-10-28 Sold (Public Records) $80,000 Public Records
Property tax history
+6.3%/yrLatest (2025): $166 · +124.3% YoY. Source: county tax records.
Cash-flow waterfall
monthlySold comps — $/sqft
last 12 mo · ≤1 miLoading sold comps…