 6-Plex
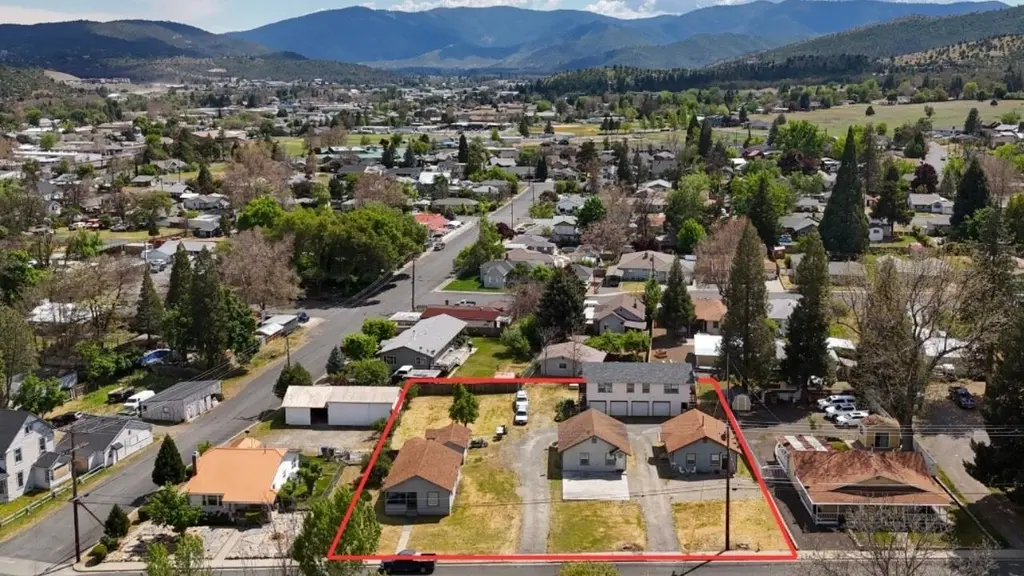
709 / 719 Lane St #709 · Yreka, CA
Flood risk 5/10 · Moderate
- FEMA flood zone
- X (shaded)
- Chance of flooding over 30 yrs
- 0.51%
- Est. flood insurance / yr
- $507 – $1,088
Fire risk 7/10 · Major
- Est. fire insurance / yr
- $659 – $1,223
Heat risk 5/10 · Moderate
- Hot days now (above 97°F)
- 7 days/yr
- Hot days in 30 yrs
- 16 days/yr
Wind risk 1/10 · Minimal
- Chance of severe wind over 30 yrs
- —
Air-quality risk 10/10 · Severe
- Unhealthy air days now
- 40 days/yr
- Unhealthy air days in 30 yrs
- 42 days/yr
Risk factors via First Street. Map © Google.
Why this score? — see what drove the C+ grade
The composite is a weighted blend of 9 inputs, each scored 0–100. Each bar is that input's sub-score; the figure is the points it added to the 100-point composite (weight × sub-score).
- Cash flow +27.7/30.0
- DSCR +9.8/10.0
- 1% rule +7.6/10.0
- ARV discount +7.5/15.0
- Schools +3.9/10.0
- Livability +3.0/5.0
- Rent growth +2.5/5.0
- Condition / age +2.2/5.0
- Appreciation +0.0/10.0
$550,000
🖨 Deal sheet (PDF) 📄 Offer letter ✓ Due diligence
Multi-family units
County records classify this as Multi-Family (5+ Unit). Listing-text estimate: 6 units. confirmed
5+ unit building — per-unit beds/baths from public records are typically unavailable; the breakdown below (if shown) is an estimate from the listing text.
Listing remarks
Excellent investment opportunity in Yreka, California! This 5-unit income property features three single-family homes with 2 bedrooms and 1 bath, plus a duplex offering two 1 bedroom, 1 bath units. Several of the units have been remodeled, creating an attractive mix of updated living spaces and strong rental potential. Property includes on-site laundry facilities Hock ups) for tenant convenience and offers multiple income streams in one centrally located investment. Whether you are looking to expand your portfolio or begin investing in multifamily real estate, this is a must-see property with upside potential. Conveniently located near shopping, schools, restaurants, and services with easy
Key facts
- Centrally located
- Remodeled units
- Income property
Tags
Property features AI
Exterior
- Parking: Gravel parking; 3-car garage
- Utilities: Public water
- Home design: Multi-family residential property; 2-story building; Zoned R1
- Construction: Wood siding; Composition and rolled/hot mop roofing
- Exterior features: Level lot; Lot with irregular dimensions; Located on Main St. to Lane St. (directions provided); Part of Hobbs & Hadleys Sub
Interior
- Flooring: Carpet; Laminate; Vinyl
- Interior features: Carpet, laminate, and vinyl flooring; Full basement
Neighborhood map
What this means for you Summary
Snapshot
- This is a 6 × 2-bed/1-bath units multifamily listed at $550k. Condition is rated fair.
Deal economics
- At list price, monthly cash flow is $2k ($20k/yr) — positive. Per door: $277/mo.
- The deal already cash-flows at list — no discount required.
- Meets the 1% rule at list price ($7k rent vs $550k).
- Recommended offer: $542k (1.5% below list) — sets the bar for market timing.
- Cap rate 9.9% vs local median 2.9% in Yreka — top-decile yield for the area; either an underpriced asset or a hidden risk that comps aren't pricing in. Stress-test before assuming the spread holds.
Location & tenants
- Location reads 60/100 on livability (#602 in CA) — a middle-class / working-renter tenant base. Strengths: health & safety A+, housing A; Watch: schools D+, crime F, amenities F.
- Yreka Union High (town): math 25% / reading 65% proficiency, ranked #630 of 1,400 in CA (top 45%) — families likely to look elsewhere, expect single-tenant / working-renter base with shorter leases.
- Market conditions: 122 active listings in the ZIP; 50 units permitted in Siskiyou County in 2024 (0 in 5+ unit buildings).
Forward outlook
- Local home prices are declining (-3.0%/yr); year-one equity from $4k of loan paydown is wiped out by about $16k of value loss. Plan a longer hold.
- Siskiyou County population projected at -26% by 2050 — secular population decline; favor cash flow + early exit over multi-decade hold.
- At projected returns (-3.0% appreciation + 3.0% rent growth), your $154k cash investment doubles in ~9 years — after that, you're playing with house money.
Negotiation context
- It's been on market 24 days — a 2% lower offer ($542k) is reasonable based on typical stale-listing flexibility.
Risks & watch-outs
- Climate carrying-cost: moderate flood risk; major wildfire risk; extreme-heat days projected 7→16/yr by 2055 (HVAC capex compounding) — expect insurance premiums to compound above CPI over the hold.
Questions for the listing agent
- Can we see the unit-by-unit rent roll, current vacancy, and any below-market leases? What's the average tenancy length?
- What capital expenditures (roof, boiler, parking lot, exteriors) have been made in the last 5 years, and what's planned in the next 2?
- Have any recent inspections been done? Can we get a copy of the seller's disclosures and any deferred-maintenance estimates?
- Is there a deadline driving the sale (1031 exchange, divorce, estate, relocation)? That informs how much negotiation room exists.
- Schools are D-rated, which usually means shorter tenancies and higher turnover. Who's the typical renter profile here, and what's been the actual vacancy rate?
- Crime grade is F in this area — have there been break-ins, vandalism, or insurance claims at this property in the last 3 years? What carrier currently insures it and at what premium?
- What's the average days-on-market for RENTAL listings here right now (not sales)? A rising rental-DOM trend means longer vacancies and softer asking-rent achievability than the comps imply.
- What's the recent tenant-quality profile in this submarket — average credit score on applications, eviction rate, late-payment / NSF rate, and stable-employment percentage? A property-management company in the area should have these aggregated.
- How much new apartment / multifamily construction is in the pipeline within 1–3 miles? Heavy new supply (>2% of stock underway) typically softens rents 12–24 months out; light construction supports rent growth.
Investment metrics
- 1% rule
- 1.26% ✓
- Cap rate
- 9.91%
- Cash-on-cash
- 12.93%
- DSCR
- 1.58
- GRM
- 6.6
CMA / ARV
No comps found within radius.
Projected returns pro-forma
-3.0% appreciation · 3.0% rent growth · sell at horizon
- IRR
- 2.8%
- Equity multiple
- 1.11×
- Total profit
- $16,679
- Equity at exit
- $82,007
- IRR
- 12.4%
- Equity multiple
- 1.98×
- Total profit
- $151,050
- Equity at exit
- $47,554
Cash invested: $154,000 (down + closing). Projections, not guarantees.
Landlord ↔ Tenant lean methodology
- Overall (STATE)
- 18 Strongly Tenant-Friendly
- State California
- 18 Strongly Tenant-Friendly · D+13
- County
- — inherits STATE
- City
- — inherits STATE
ZIP-level market 96097
- Active inventory
- 122
- Price-to-rent
- 39.8×
Monthly cashflow live
- Estimated rent
- $6,912 medium interval (Pro) →
- Mortgage (P&I)
- −$2,884
- Tax est. 1.5%
- −$688 /mo · $8,250/yr
- Insurance
- −$229
- HOA
- −$0
- Vacancy / Maint / Mgmt
- −$1,452
- Net cashflow
- $1,660
Break-even live
Sensitivity live
| Price | -10% $2,040 | -5% $1,850 | +0% $1,660 | +5% $1,470 | +10% $1,279 |
|---|---|---|---|---|---|
| Rent | -10% $1,114 | -5% $1,387 | +0% $1,660 | +5% $1,933 | +10% $2,206 |
| Rate | -1.0pp $1,937 | -0.5pp $1,799 | base $1,660 | +0.5pp $1,517 | +1.0pp $1,372 |
6-unit breakdown (identical units grouped — click to expand)
| Units | Beds | Baths | Est. rent |
|---|---|---|---|
| 6× units | 2 | 1 | $6,912 |
| #1 | 2 | 1 | $1,152 |
| #2 | 2 | 1 | $1,152 |
| #3 | 2 | 1 | $1,152 |
| #4 | 2 | 1 | $1,152 |
| #5 | 2 | 1 | $1,152 |
| #6 | 2 | 1 | $1,152 |
| Total (6 units) | $6,912 | ||
UW: 25.0% down · 7.5% · 30yr · 1.5% tax · 5.0% vac · 8.0% maint · 8.0% mgmt
Financing live
Cash to close
- Down payment
- $137,500
- Closing costs
- $16,500
- Reserves months
- —
- Total cash needed
- —
Loan-product check · same deal, 3 products live
Conventional
25% down · 7.5% · 30yr
- Down + closing
- —
- Monthly P&I
- —
- Monthly cashflow
- —
- DSCR
- —
- Eligible?
- —
Personal DTI + credit; lowest rate.
DSCR
20% down · 8.5% · 30yr
- Down + closing
- —
- Monthly P&I
- —
- Monthly cashflow
- —
- DSCR
- —
- Eligible?
- —
No personal income docs; deal must DSCR.
Hard money
10% down · 12.0% · 12mo
- Down + closing
- —
- Monthly P&I
- —
- Monthly cashflow
- —
- DSCR
- —
- Eligible?
- —
Short-term bridge; refi at stabilization.
Listing history 16 events
-
2026-06-19days on market $550,000 Active 24 DOM
-
2026-06-18days on market $550,000 Active 23 DOM
-
2026-06-17days on market $550,000 Active 22 DOM
-
2026-06-16days on market $550,000 Active 21 DOM
-
2026-06-15days on market $550,000 Active 20 DOM
-
2026-06-14days on market $550,000 Active 18 DOM
-
2026-06-12days on market $550,000 Active 17 DOM
-
2026-06-09days on market $550,000 Active 14 DOM
-
2026-06-08days on market $550,000 Active 13 DOM
-
2026-06-07days on market $550,000 Active 12 DOM
-
2026-06-04days on market $550,000 Active 8 DOM
-
2026-06-02days on market $550,000 Active 7 DOM
-
2026-06-01days on market $550,000 Active 6 DOM
-
2026-05-31days on market $550,000 Active 5 DOM
-
2026-05-31days on market $550,000 Active 4 DOM
-
2026-05-26$550,000 Active
ⓘ Source: listings_history table (triggers on properties + properties_extension) + one-shot
backfill from property_details.listing_events for pre-trigger history.
Climate risk First Street
- Flood 5/10 Major FEMA zone X (shaded) · 51% chance over 30 yrs
- Wildfire 7/10 Severe
- Heat 5/10 Major 7 d/yr ≥97°F today · 16 d/yr by 30 yrs out
- Wind 1/10 Low
- Air quality 10/10 Extreme 40 unhealthy d/yr today · 42 by 30 yrs out
Nearby sold comps map
Loading sold comps map…
Walkable amenities ~0.75 mi
Loading nearby amenities…
Taxation est. · year 1
- Rental income
- $82,944
- − Mortgage interest
- −$30,809
- − Property taxes
- −$8,250
- − Insurance
- −$2,750
- − Repairs & maintenance
- −$6,636
- − Management
- −$6,636
- − Depreciation
- −$16,000
- Taxable income
- $11,864
- Est. tax owed @ 24.0%
- −$2,847
- After-tax cash flow
- $17,067/yr
For passive investors: Depreciation is non-cash, so a rental often shows a tax loss while cash-flowing — sheltering income. Rental losses are passive: they offset passive income freely, and up to $25,000/yr can offset ordinary (W-2) income if you actively participate and your MAGI is under $100k (phasing out to $0 by $150k); unused losses carry forward. On sale, claimed depreciation is recaptured at up to 25%, and gains may owe capital-gains tax (a 1031 exchange can defer both). Figures are a year-1 estimate at your 24.0% rate — not tax advice; consult a CPA.
Condition & rehab AI · 14 photos
This multi-family property presents an opportunity for moderate renovations to improve its condition and increase its value. The home is in fair condition with some minor repairs and maintenance needed, and updates to the exterior and landscaping can significantly enhance its appeal.
Repairs flagged
- Minor Paint touch-ups — There are minor scuffs on the paint that can be easily fixed.
- Moderate Floor refinishing — The hardwood flooring is worn and could benefit from refinishing.
- Minor Landscaping maintenance — The landscaping is overgrown and could be trimmed and replanted.
Value-add opportunities
- Both Paint touch-ups and minor repairs — These updates will improve the home's appearance and make it more attractive to potential buyers and renters.
- Both Floor refinishing — Refinishing the hardwood flooring will enhance the home's curb appeal and increase its value.
- Both Landscaping maintenance — A well-maintained landscape will improve the home's curb appeal and attract more potential buyers and renters.
Renovation cost estimate screening
| Repair item | Severity | Est. cost |
|---|---|---|
| Paint touch-ups · There are minor scuffs on the paint that can be easily fixed. | Minor | $500–3,000 |
| Floor refinishing · The hardwood flooring is worn and could benefit from refinishing. | Moderate | $3,000–15,000 |
| Landscaping maintenance · The landscaping is overgrown and could be trimmed and replanted. | Minor | $500–3,000 |
| Total estimated repair cost · 3 items | $4,000–21,000 |
Value-add ROI direction
- Both Paint touch-ups and minor repairs — These updates will improve the home's appearance and make it more attractive to potential buyers and renters. ↑
- Both Floor refinishing — Refinishing the hardwood flooring will enhance the home's curb appeal and increase its value. ↑
- Both Landscaping maintenance — A well-maintained landscape will improve the home's curb appeal and attract more potential buyers and renters. ↑
ⓘ Cost ranges are severity-bucket heuristics (US national rule-of-thumb). Get contractor quotes + a written scope before underwriting a rehab budget.
Schools (NCES district)
- District
- Yreka Union High
- NCES district ID
- 0643410
- Math proficiency
- 25% ▼ -15.00%
- Reading proficiency
- 65% ▬ 0.00%
- Median HH income
- $34,206
- Composite
- 39.28/100
- National rank
- #8184
- State rank
- #630 of 1400 in CA
Livability — Yreka
- Score
- 60/100
- State rank
- #602
- US rank
- #19325
Category grades
Schools grade is shown separately in the Schools card above.
Census & demographics
- Census place
- Yreka, CA
- Population (ZIP)
- 10,220
Population outlook (Siskiyou County) Hauer SSP2
- Today (2025)
- 39,337 people
- By 2030
- 36,930 · -6.1%
- By 2040
- 32,367 · -17.7%
- By 2050
- 29,030 · -26.2%
- By 2075
- 23,534 · -40.2%
- By 2100
- 19,312 · -50.9%
Race, ethnicity, and origin ACS 2023
- Neighborhood character
- Predominantly White (78%)
- Race & ethnicity
- White 78% Hispanic / Latino 12% Two or more races 10% Native American 4% Black 1%
- Hispanic origin (detail)
- Mexican 10%
- Common ancestry
- Russian 5% Italian 3% Slovak 2%
- Foreign-born
- 2% · Canada
- Languages at home
- 94% English-only · Spanish 5%
Political lean MEDSL · Siskiyou
- 2024 margin
- R (+19.2) · D 38.8% · R 58.0% · Other 3.2%
- 2008→2024 swing
- -8.8pp toward R · 2008: -10.4pp · 2024: -19.2pp
- All cycles
- 2024: R+19.2 2020: R+15.8 2016: R+20.7 2012: R+15.6 2008: R+10.4
Not yet ingested
- Civics
- —
Market trends
- HPI YoY
- ▼ -157.34%
- Current HPI
- 116.3252
- Rent YoY
- —
- Metro
- —
- State GDP YoY
- ▲ 3.21%
- F500 in state
- 116
Industry mix (Fortune 500 HQ in CA)
| Industry | F500 HQs | Revenue |
|---|---|---|
| Technology | 27 | $1,492B |
|
||
| Financial Services | 3 | $174B |
|
||
| Retail | 3 | $44B |
|
||
| Insurance | 3 | $26B |
|
||
| Media / Entertainment | 2 | $115B |
|
||
| Pharmaceuticals / Biotech | 2 | $62B |
|
||
Price history
1 event — show timeline
- 2026-05-26 Listed $550,000 SMLS
Cash-flow waterfall
monthlySold comps — $/sqft
last 12 mo · ≤1 miLoading sold comps…