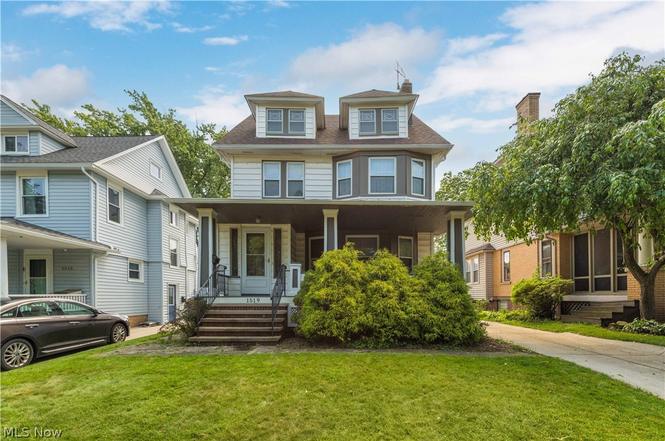
1519 Woodward Ave · Lakewood, OH
Flood risk 1/10 · Minimal
- FEMA flood zone
- X (unshaded)
- Chance of flooding over 30 yrs
- 0.0%
- Est. flood insurance / yr
- $473 – $860
Fire risk 1/10 · Minimal
- Est. fire insurance / yr
- $713 – $1,323
Heat risk 3/10 · Minor
- Hot days now (above 95°F)
- 7 days/yr
- Hot days in 30 yrs
- 18 days/yr
Wind risk 1/10 · Minimal
- Chance of severe wind over 30 yrs
- —
Air-quality risk 3/10 · Minor
- Unhealthy air days now
- 4 days/yr
- Unhealthy air days in 30 yrs
- 4 days/yr
Risk factors via First Street. Map © Google.
Why this score? — see what drove the D+ grade
The composite is a weighted blend of 9 inputs, each scored 0–100. Each bar is that input's sub-score; the figure is the points it added to the 100-point composite (weight × sub-score).
- ARV discount +15.0/15.0
- Cash flow +11.1/30.0
- Schools +5.5/10.0
- Livability +4.4/5.0
- 1% rule +4.3/10.0
- Rent growth +3.8/5.0
- DSCR +3.2/10.0
- Condition / age +2.5/5.0
- Appreciation +0.0/10.0
$199,900
🖨 Deal sheet 📄 Offer letter ✓ Due diligence
Listing remarks
Nestled on a beautiful tree-lined street in an outstanding location, this charming 3-bedroom Colonial is waiting for its new family and their personal touches to make this house a home. A welcoming front porch invites you inside to spacious, character-filled rooms designed for comfortable everyday living and memorable gatherings. The living room features a decorative fireplace that creates a warm focal point, while the formal dining room offers classic built-in cabinetry and timeless architectural details. The eat-in kitchen provides plenty of space for casual meals and opens to a small rear porch overlooking the partially fenced backyard — perfect for relaxing, gardening, or outdoor
Key facts
- Decorative fireplace
- Built-in cabinetry
- Tree-lined street
Tags
Neighborhood map
What this means for you Summary
Snapshot
- This is a 3-bed/1.0-bath single-family listed at $200k.
Deal economics
- At list price, monthly cash flow is $-81 ($-968/yr) — negative.
- To cash-flow at today's rent, offer at most $186k (7.1% below list).
- To meet the 1% rule (rent ≥ 1% of price), the offer needs to be $186k (7.1% below list).
- Recommended offer: $186k (7.1% below list) — sets the bar for cash-flow.
- Cap rate 5.8% vs local median 2.5% in Lakewood — top-decile yield for the area; either an underpriced asset or a hidden risk that comps aren't pricing in. Stress-test before assuming the spread holds.
Location & tenants
- Location reads 88/100 on livability (#29 in OH, #249 nationally) — a professional / high-income tenant draw. Strengths: schools A+, amenities A+, cost of living A+; Watch: commute F.
- Lakewood City (suburban): math 60% / reading 71% proficiency, ranked #213 of 656 in OH (top 32%) — acceptable for families but not a draw, mixed tenant base, ~2y average lease.
- Market conditions: Rents rising fast (+5.4%/yr); 201 active listings in the ZIP; 28 comparable units currently listed for rent nearby; rentals lingering (median 44d on market — plan ~5-8 weeks vacancy on turnover, expect pricing pressure); 50% of comp listings sitting > 30 days — soft ceiling on asking rent; 1,441 units permitted in Cuyahoga County in 2024 (700 in 5+ unit buildings).
- This rent runs 32% of the median local income ($69k/yr) — at the standard rent-burdened threshold; future hikes will face affordability resistance.
Forward outlook
- Local home prices are declining (-3.0%/yr); year-one equity from $1k of loan paydown is wiped out by about $6k of value loss. Plan a longer hold.
- Cuyahoga County population projected to shrink 8% by 2050 — rents likely to lag national; underwrite the cash flow, not the appreciation.
Negotiation context
- Only 2 days on market — expect competitive offers; lowballing is unlikely to land.
- Current owner paid $43k; list at $200k implies a 365% gain — meaningful room to come down on a strong offer.
Risks & watch-outs
- Watch-outs: built in 1910 — expect roof / HVAC / electrical / plumbing capex.
Questions for the listing agent
- What do current leases actually rent for vs. the listed asking? Can we see a recent rent roll and the last 12 months of T-12 income?
- Built in 1910 — when were the roof, HVAC, electrical panel, plumbing, and water heater last replaced?
- Is there a deadline driving the sale (1031 exchange, divorce, estate, relocation)? That informs how much negotiation room exists.
- Schools are A-rated — typically a magnet for longer-tenancy family renters. What's the average tenant stay here, and is there a school-zone premium baked into asking?
- The area grade is low — what's the realistic commute time and amenity access for the typical tenant pool here? Any planned neighborhood developments (good or bad) we should know about?
- What's the average days-on-market for RENTAL listings here right now (not sales)? A rising rental-DOM trend means longer vacancies and softer asking-rent achievability than the comps imply.
- What's the recent tenant-quality profile in this submarket — average credit score on applications, eviction rate, late-payment / NSF rate, and stable-employment percentage? A property-management company in the area should have these aggregated.
- How much new for-sale + rental construction is in the pipeline within 1–3 miles? Heavy new supply typically softens prices + rents 12–24 months out; constrained supply supports both.
Investment metrics
- 1% rule
- 0.93% ✗
- Cap rate
- 5.81%
- Cash-on-cash
- -1.73%
- DSCR
- 0.92
- GRM
- 9.0
CMA / ARV
- ARV (on-the-fly)
- $368,460
- Comps found
- 12
Show comp detail 12 sales within ~0.75 mi
| Address | Dist | Beds/Ba | Sqft | Sold | Price | $/sf | Match |
|---|---|---|---|---|---|---|---|
| 1505 Cordova Ave | 0.22mi | 3/1.5 | 1,628 (+2%) | 0mo | $220,000 | $135 | 85 |
| 1486 Woodward Ave | 0.07mi | 3/2.5 | 1,504 (-6%) | 1mo | $451,500 | $300 | 80 |
| 1358 Summit Ave | 0.37mi | 3/1.5 | 1,592 (-1%) | 0mo | $567,500 | $356 | 80 |
| 1547 Orchard Grove Ave | 0.13mi | 4/3.0 (+1) | 1,626 (+2%) | 1mo | $335,000 | $206 | 78 |
| 1615 Wagar Ave | 0.19mi | 3/1.5 | 1,385 (-14%) | 1mo | $280,000 | $202 | 66 |
| 1196 Cranford Ave | 0.62mi | 3/1.5 | 1,660 (+4%) | 1mo | $317,500 | $191 | 62 |
| 17712 Riverway Dr | 0.62mi | 4/2.0 (+1) | 1,638 (+2%) | 2mo | $376,000 | $230 | 57 |
| 1302 Bonnieview Ave | 0.49mi | 4/3.0 (+1) | 1,678 (+5%) | 1mo | $480,000 | $286 | 55 |
| 1215 Ethel Ave | 0.59mi | 4/1.5 (+1) | 1,764 (+10%) | 1mo | $413,500 | $234 | 48 |
| 2152 Glenbury Ave | 0.64mi | 3/1.5 | 1,796 (+12%) | 1mo | $399,000 | $222 | 47 |
| 2212 Olive Ave | 0.67mi | 3/1.0 | 1,371 (-14%) | 1mo | $220,000 | $160 | 44 |
| 1228 Andrews Ave | 0.71mi | 4/2.0 (+1) | 1,778 (+11%) | 1mo | $455,000 | $256 | 39 |
Match score weights: distance 35% · size 25% · config 20% · recency 20%. Top-matched comps best support the ARV.
Projected returns pro-forma
-3.0% appreciation · 5.39% rent growth · sell at horizon
- IRR
- -16.1%
- Equity multiple
- 0.41×
- Total profit
- $-32,829
- Equity at exit
- $29,806
- IRR
- -3.6%
- Equity multiple
- 0.73×
- Total profit
- $-14,974
- Equity at exit
- $17,284
Cash invested: $55,972 (down + closing). Projections, not guarantees.
Landlord ↔ Tenant lean methodology
- Overall (STATE)
- 73 Landlord-Friendly
- State Ohio
- 73 Landlord-Friendly · R+6
- County
- — inherits STATE
- City
- — inherits STATE
ZIP-level market 44107
- Rents YoY
- 5.4%
- Active inventory
- 201
- Price-to-rent
- 9.0×
Monthly cashflow live
- Estimated rent
- $1,857 high interval (Pro) →
- Mortgage (P&I)
- −$1,048
- Tax from tax record
- −$416 /mo · $4,992/yr
- Insurance
- −$83
- HOA
- −$0
- Vacancy / Maint / Mgmt
- −$390
- Net cashflow
- $-81
Break-even live
UW: 25.0% down · 7.5% · 30yr · 1.5% tax · 5.0% vac · 8.0% maint · 8.0% mgmt
Financing live
Cash to close
- Down payment
- $49,975
- Closing costs
- $5,997
- Reserves months
- —
- Total cash needed
- —
Loan-product check · same deal, 3 products live
Conventional
25% down · 7.5% · 30yr
- Down + closing
- —
- Monthly P&I
- —
- Monthly cashflow
- —
- DSCR
- —
- Eligible?
- —
Personal DTI + credit; lowest rate.
DSCR
20% down · 8.5% · 30yr
- Down + closing
- —
- Monthly P&I
- —
- Monthly cashflow
- —
- DSCR
- —
- Eligible?
- —
No personal income docs; deal must DSCR.
Hard money
10% down · 12.0% · 12mo
- Down + closing
- —
- Monthly P&I
- —
- Monthly cashflow
- —
- DSCR
- —
- Eligible?
- —
Short-term bridge; refi at stabilization.
Rent comps 28 comps
| Address | Beds | Baths | Sqft | Rent | $/sqft | DOM | Units | Dist |
|---|---|---|---|---|---|---|---|---|
| 1482 Rosewood Ave Fl 2 Bedroom Lakewood, OH | 2.0 | 1.0 | 1200 | $1,500 | $1.25 | 44d | 1 | 0.15mi |
| 16000 Detroit Ave Lakewood, OH | 1.0–2.0 | 1.0–2.0 | 851 | $2,720 | $3.20 | 2d | 27 | 0.26mi |
| 1657 Wagar Ave Unit 2 Lakewood, OH | 4.0 | 2.0 | 1992 | $2,280 | $1.14 | 21d | 1 | 0.28mi |
| 1533 Mars Ave Unit 1533 Lakewood, OH | 3.0 | 1.0 | 1500 | $1,725 | $1.15 | 44d | 1 | 0.40mi |
| 17316 Madison Ave Unit 1 Lakewood, OH | 2.0 | 1.0 | 2184 | $1,625 | $0.74 | 10d | 1 | 0.44mi |
| 1303 Lakeland Ave Lakewood, OH | 3.0 | 1.5 | 2000 | $1,750 | $0.88 | 44d | 1 | 0.49mi |
| 1252 Summit Ave Lakewood, OH | 3.0 | 1.5 | 1632 | $2,650 | $1.62 | 44d | 1 | 0.54mi |
| 1644 Warren Rd Unit 2 Lakewood, OH | 2.0 | 1.0 | 1200 | $1,295 | $1.08 | 12d | 1 | 0.60mi |
| 2171 Olive Ave Unit 2 Lakewood, OH | 2.0 | 1.0 | 1500 | $1,150 | $0.77 | 44d | 1 | 0.60mi |
| 17844 Cannon Ave Lakewood, OH | 4.0 | 2.5 | 1700 | $2,800 | $1.65 | 44d | 1 | 0.67mi |
| 2125 Mars Ave Lakewood, OH | 4.0 | 2.0 | 1650 | $2,000 | $1.21 | 24d | 1 | 0.70mi |
| 1143 Cranford Ave Lakewood, OH | 2.0 | 1.0 | 1078 | $1,500 | $1.39 | 44d | 1 | 0.72mi |
| 1618 Olivewood Ave Lakewood, OH | 2.0 | 1.0 | 1150 | $2,000 | $1.74 | 20d | 1 | 0.91mi |
| 1265 Marlowe Ave Lakewood, OH | 4.0 | 1.0 | 1690 | $1,750 | $1.04 | 15d | 1 | 0.95mi |
| 1265 Marlowe Ave Lakewood, OH | 3.0 | 1.0 | 1110 | $1,600 | $1.44 | 44d | 1 | 0.95mi |
| 16806 Pilgrim Ave Unit 1496036P Cleveland, OH | 4.0 | 2.5 | 1937 | $6,179 | $3.19 | 2d | 1 | 1.04mi |
| 3175 Rocky River Dr Unit 1496078P Cleveland, OH | 2.0 | 1.0 | 2131 | $3,747 | $1.76 | 2d | 1 | 1.07mi |
| 3175 Rocky River Dr Unit 1496035P Cleveland, OH | 2.0 | 1.5 | 1937 | $3,383 | $1.75 | 44d | 1 | 1.07mi |
| 1653 Bunts Rd Unit 2 Lakewood, OH | 2.0 | 1.0 | 1800 | $1,500 | $0.83 | 44d | 1 | 1.15mi |
| 2058 Wascana Ave Lakewood, OH | 2.0 | 1.0 | 1064 | $1,500 | $1.41 | 44d | 1 | 1.24mi |
| 2041 Elbur Ave Lakewood, OH | 2.0 | 1.0 | 1050 | $1,350 | $1.29 | 44d | 1 | 1.36mi |
| 2041 Elbur Ave Lakewood, OH | 2.0 | 1.0 | 1050 | $1,250 | $1.19 | 15d | 1 | 1.36mi |
| 2082 Lewis Dr Unit 2082 Lakewood, OH | 3.0 | 1.0 | 1600 | $1,750 | $1.09 | 44d | 1 | 1.40mi |
| 2010 Chesterland Ave Unit 1496099P Lakewood, OH | 4.0 | 2.5 | 1463 | $7,556 | $5.16 | 12d | 1 | 1.42mi |
| 2180 Elbur Ave Lakewood, OH | 3.0 | 1.0 | 1226 | $2,200 | $1.79 | 16d | 1 | 1.44mi |
| 1646 Waterbury Rd Lakewood, OH | 2.0 | 1.0 | 1068 | $1,600 | $1.50 | 16d | 1 | 1.47mi |
| 1648 Waterbury Rd Lakewood, OH | 2.0 | 1.0 | 1056 | $1,600 | $1.52 | 44d | 1 | 1.47mi |
| 1298 Nicholson Ave Lakewood, OH | 2.0 | 1.0 | 1221 | $1,650 | $1.35 | 4d | 1 | 1.50mi |
Listing history 3 events
-
2026-06-13statusdays on market $199,900 Pending 2 DOM
-
2026-06-13remarks 693-char remark
-
2026-06-13$199,900 Active 1 DOM
ⓘ Source: listings_history table (triggers on properties + properties_extension) + one-shot
backfill from property_details.listing_events for pre-trigger history.
Tax reassessment forecast OH · Partial reset (capped growth)
- Current annual tax
- $4,992 · $416/mo
- Projected year-2 tax
- $4,992 · $416/mo
- Expected delta
- $0/yr ($0/mo · 0.0%)
ⓘ Screening estimate from a state-policy table — verify with the county assessor before closing.
Climate risk First Street
- Flood 1/10 Low FEMA zone X (unshaded) · 0% chance over 30 yrs
- Wildfire 1/10 Low
- Heat 3/10 Moderate 7 d/yr ≥95°F today · 18 d/yr by 30 yrs out
- Wind 1/10 Low
- Air quality 3/10 Moderate 4 unhealthy d/yr today · 4 by 30 yrs out
Nearby sold comps map
Loading sold comps map…
Walkable amenities ~0.75 mi
Loading nearby amenities…
Taxation est. · year 1
- Rental income
- $22,282
- − Mortgage interest
- −$11,198
- − Property taxes
- −$4,992
- − Insurance
- −$1,000
- − Repairs & maintenance
- −$1,783
- − Management
- −$1,783
- − Depreciation
- −$5,815
- Taxable loss
- −$4,287
- Est. tax savings @ 24.0%
- +$1,029
- After-tax cash flow
- $61/yr
For passive investors: Depreciation is non-cash, so a rental often shows a tax loss while cash-flowing — sheltering income. Rental losses are passive: they offset passive income freely, and up to $25,000/yr can offset ordinary (W-2) income if you actively participate and your MAGI is under $100k (phasing out to $0 by $150k); unused losses carry forward. On sale, claimed depreciation is recaptured at up to 25%, and gains may owe capital-gains tax (a 1031 exchange can defer both). Figures are a year-1 estimate at your 24.0% rate — not tax advice; consult a CPA.
Schools (NCES district)
- District
- Lakewood City
- NCES district ID
- 3904419
- Math proficiency
- 60% ▼ -11.00%
- Reading proficiency
- 71% ▼ -3.00%
- Median HH income
- $45,181
- Composite
- 55.13/100
- National rank
- #1282
- State rank
- #213 of 656 in OH
Livability — Lakewood
- Score
- 88/100
- State rank
- #29
- US rank
- #249
Category grades
Schools grade is shown separately in the Schools card above.
Census & demographics
- Census place
- Lakewood, OH
- County
- Cuyahoga County · 1,090,369 people
- City population
- 50,018
- Metro
- Cleveland-Elyria, OH
- Population (ZIP)
- 50,018
- Household income
- $68,970
- Rent vs Own
- Severe rent burden
- 2271.0
Population outlook (Cuyahoga County) Hauer SSP2
- Today (2025)
- 1,244,621 people
- By 2030
- 1,230,093 · -1.2%
- By 2040
- 1,189,108 · -4.5%
- By 2050
- 1,145,706 · -7.9%
- By 2075
- 1,076,557 · -13.5%
- By 2100
- 978,987 · -21.3%
Race, ethnicity, and origin ACS 2023
- Neighborhood character
- Predominantly White (83%)
- Race & ethnicity
- White 83% Black 6% Two or more races 5% Hispanic / Latino 4% Asian 2%
- Common ancestry
- Romanian 8% Lithuanian 2% Slovak 2%
- Foreign-born
- 8% · Canada, China
- Languages at home
- 90% English-only · Arabic 3% Other Indo-European 2% Spanish 2%
Political lean MEDSL · Cuyahoga
- 2024 margin
- Solid D (+31.5) · D 65.4% · R 33.9%
- 2008→2024 swing
- -7.4pp toward R · 2008: 38.9pp · 2024: 31.5pp
- All cycles
- 2024: D+31.5 2020: D+34.1 2016: D+35.0 2012: D+38.7 2008: D+38.9
Not yet ingested
- Civics
- —
Market trends
- HPI YoY
- ▼ -347.35%
- Current HPI
- 266.5337
- Rent YoY
- ▲ 5.39%
- Metro
- Cleveland-Elyria, OH
- State GDP YoY
- ▲ 1.98%
- F500 in state
- 48
Industry mix (Fortune 500 HQ in OH)
| Industry | F500 HQs | Revenue |
|---|---|---|
| Insurance | 3 | $145B |
|
||
| Industrial Machinery | 3 | $49B |
|
||
| Financial Services | 3 | $24B |
|
||
| Consumer Goods | 2 | $93B |
|
||
| Aerospace / Defense | 2 | $47B |
|
||
| Utilities | 2 | $33B |
|
||
Price history
+447.7% since first listed4 events — show timeline
- 2026-06-11 Listed $199,900 MLSNOW
- 1978-11-03 Sold (Public Records) $43,000 Public Records
- 1978-02-01 Sold (Public Records) $47,500 Public Records
- 1977-01-01 Sold (Public Records) $36,500 Public Records
Property tax history
+2.0%/yrLatest (2025): $4,992 · -0.2% YoY. Source: county tax records.
Cash-flow waterfall
monthlySold comps — $/sqft
last 12 mo · ≤1 miLoading sold comps…