1504 E Ursuline St · Lubbock, TX
Flood risk 1/10 · Minimal
- FEMA flood zone
- X (unshaded)
- Chance of flooding over 30 yrs
- 0.0%
- Est. flood insurance / yr
- $507 – $1,088
Fire risk 5/10 · Moderate
- Est. fire insurance / yr
- $1,222 – $2,270
Heat risk 5/10 · Moderate
- Hot days now (above 100°F)
- 6 days/yr
- Hot days in 30 yrs
- 18 days/yr
Wind risk 2/10 · Minimal
- Chance of severe wind over 30 yrs
- 1.0%
Air-quality risk 2/10 · Minimal
- Unhealthy air days now
- 1 days/yr
- Unhealthy air days in 30 yrs
- 1 days/yr
Risk factors via First Street. Map © Google.
Why this score? — see what drove the B+ grade
The composite is a weighted blend of 9 inputs, each scored 0–100. Each bar is that input's sub-score; the figure is the points it added to the 100-point composite (weight × sub-score).
- Cash flow +30.0/30.0
- ARV discount +15.0/15.0
- 1% rule +10.0/10.0
- DSCR +10.0/10.0
- Livability +4.0/5.0
- Schools +3.1/10.0
- Rent growth +2.9/5.0
- Condition / age +2.5/5.0
- Appreciation +0.0/10.0
$59,900
🖨 Deal sheet 📄 Offer letter ✓ Due diligence
Listing remarks
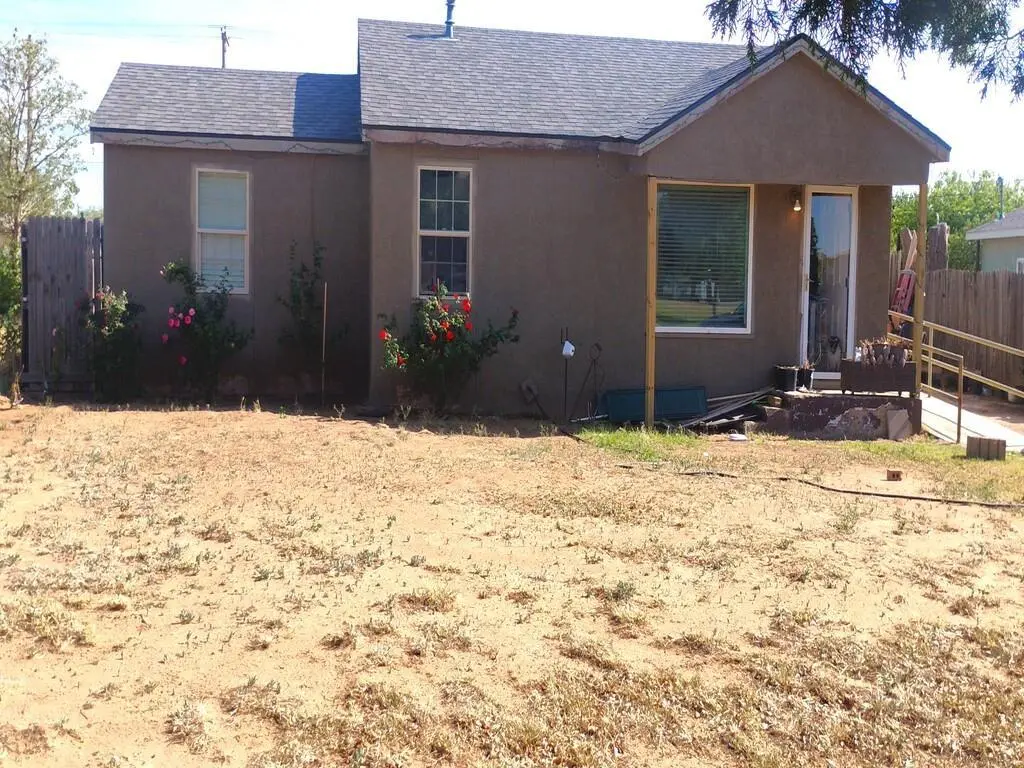
Great Value Opportunity – Perfect for Homeowners or Investors! Great opportunity for homeowners looking to build equity with a little work or investors seeking their next project. This property offers solid potential with a functional layout and plenty of opportunity to update and customize to your liking. Ideal for a starter home, rental property, or fix-and-flip investment. Conveniently located in Lubbock near schools, shopping, dining, and major roadways. Property being sold as-is. Buyer to independently verify all information, measurements, schools, and utilities.
Key facts
- Near schools
- Near dining
- Near shopping
Tags
Property features AI
Finance
- Other: Parcel ID R105632; Subdivision: Clayton Carter; Directions: From NE Loop 289, turn left onto N Martin L King Blvd, then left onto E Ursuline St; destination will be on the left; County: Lubbock, United States
- Financial info: Listing accepts cash and conventional financing
- HOA & community: No homeowners association
Exterior
- Parking: Driveway; 1-car garage
- Utilities: Electricity available; Not in a municipal utility district
- Home design: Single family residence; Residential property; One story; Not attached
- Construction: Built in 1955; Composition roof; Slab foundation
- Exterior features: Wood fencing; Lot less than 0.5 acre
Interior
- Kitchen: Gas range
- Bedrooms: Primary bedroom on main level; Second bedroom on main level; Two bedrooms total
- Bathrooms: One full bathroom
- Heating & cooling: Central heating (electric); Central air conditioning (electric)
- Interior features: One-level layout; One living area and one dining area; Other interior features
Neighborhood map
What this means for you Summary
Snapshot
- This is a 3-bed/1.0-bath single-family listed at $60k.
Deal economics
- At list price, monthly cash flow is $396 ($5k/yr) — positive.
- The deal already cash-flows at list — no discount required.
- Meets the 1% rule at list price ($1k rent vs $60k).
- Recommended offer: $58k (3.0% below list) — sets the bar for market timing.
Location & tenants
- Location reads 80/100 on livability (#37 in TX, #1,749 nationally) — a professional / high-income tenant draw. Strengths: commute A+, cost of living A+, housing A+; Watch: employment C-, crime F.
- Lubbock ISD (urban): math 36% / reading 39% proficiency, ranked #481 of 826 in TX (top 58%) — families likely to look elsewhere, expect single-tenant / working-renter base with shorter leases; 60% free/reduced lunch — lower-income household profile, screen leases tightly.
- Zoned schools: Williams El (math 32% / reading 37%, grade F, #1,995 of 4,322 statewide, top 50%, 307 students, 76% FRL) — zoned schools average 76% FRL vs 60% district-wide (15 pts higher); higher-poverty schools than district average — tighter screening recommended.
- Market conditions: Rents rising (+1.5%/yr); 165 active listings in the ZIP; 10 comparable units currently listed for rent nearby; rentals lingering (median 44d on market — plan ~5-8 weeks vacancy on turnover, expect pricing pressure); 50% of comp listings sitting > 30 days — soft ceiling on asking rent; 2,219 units permitted in Lubbock County in 2024 (252 in 5+ unit buildings).
Forward outlook
- Local home prices are declining (-3.0%/yr); year-one equity from $414 of loan paydown is wiped out by about $2k of value loss. Plan a longer hold.
- Lubbock County population projected at +39% by 2050 — long-run rental-demand tailwind backs the buy-and-hold thesis.
- At projected returns (-3.0% appreciation + 1.5% rent growth), your $17k cash investment doubles in ~5 years — after that, you're playing with house money.
Negotiation context
- It's been on market 35 days — a 3% lower offer ($58k) is reasonable based on typical stale-listing flexibility.
Risks & watch-outs
- Watch-outs: built in 1955 — expect roof / HVAC / electrical / plumbing capex.
- Climate carrying-cost: moderate wildfire risk; extreme-heat days projected 6→18/yr by 2055 (HVAC capex compounding) — expect insurance premiums to compound above CPI over the hold.
Questions for the listing agent
- It's been on market 35 days. Have you received any prior offers? Is the seller open to a 3% concession, seller financing, or rate buy-down credit?
- Built in 1955 — when were the roof, HVAC, electrical panel, plumbing, and water heater last replaced?
- Is there a deadline driving the sale (1031 exchange, divorce, estate, relocation)? That informs how much negotiation room exists.
- Schools are D-rated, which usually means shorter tenancies and higher turnover. Who's the typical renter profile here, and what's been the actual vacancy rate?
- Crime grade is F in this area — have there been break-ins, vandalism, or insurance claims at this property in the last 3 years? What carrier currently insures it and at what premium?
- What's the average days-on-market for RENTAL listings here right now (not sales)? A rising rental-DOM trend means longer vacancies and softer asking-rent achievability than the comps imply.
- What's the recent tenant-quality profile in this submarket — average credit score on applications, eviction rate, late-payment / NSF rate, and stable-employment percentage? A property-management company in the area should have these aggregated.
- How much new for-sale + rental construction is in the pipeline within 1–3 miles? Heavy new supply typically softens prices + rents 12–24 months out; constrained supply supports both.
Investment metrics
- 1% rule
- 1.74% ✓
- Cap rate
- 14.22%
- Cash-on-cash
- 28.31%
- DSCR
- 2.26
- GRM
- 4.8
CMA / ARV
- ARV (median comp)
- $82,500
- List price
- $59,900
- Delta
- -27.39%
- Verdict
- UNDERPRICED
- Comps
- 1 within 2.0 mi
Projected returns pro-forma
-3.0% appreciation · 1.52% rent growth · sell at horizon
- IRR
- 20.8%
- Equity multiple
- 1.83×
- Total profit
- $13,989
- Equity at exit
- $8,931
- IRR
- 28.0%
- Equity multiple
- 3.30×
- Total profit
- $38,642
- Equity at exit
- $5,179
Cash invested: $16,772 (down + closing). Projections, not guarantees.
Landlord ↔ Tenant lean methodology
- Overall (STATE)
- 87 Strongly Landlord-Friendly
- State Texas
- 87 Strongly Landlord-Friendly · R+5
- County
- — inherits STATE
- City
- — inherits STATE
ZIP-level market 79403
- Home prices YoY
- -9.0%
- Rents YoY
- 1.5%
- Active inventory
- 165
- Price-to-rent
- 4.8×
Monthly cashflow live
- Estimated rent
- $1,041 high interval (Pro) →
- Mortgage (P&I)
- −$314
- Tax from tax record
- −$87 /mo · $1,048/yr
- Insurance
- −$25
- HOA
- −$0
- Vacancy / Maint / Mgmt
- −$219
- Net cashflow
- $396
Break-even live
UW: 25.0% down · 7.5% · 30yr · 1.5% tax · 5.0% vac · 8.0% maint · 8.0% mgmt
Financing live
Cash to close
- Down payment
- $14,975
- Closing costs
- $1,797
- Reserves months
- —
- Total cash needed
- —
Loan-product check · same deal, 3 products live
Conventional
25% down · 7.5% · 30yr
- Down + closing
- —
- Monthly P&I
- —
- Monthly cashflow
- —
- DSCR
- —
- Eligible?
- —
Personal DTI + credit; lowest rate.
DSCR
20% down · 8.5% · 30yr
- Down + closing
- —
- Monthly P&I
- —
- Monthly cashflow
- —
- DSCR
- —
- Eligible?
- —
No personal income docs; deal must DSCR.
Hard money
10% down · 12.0% · 12mo
- Down + closing
- —
- Monthly P&I
- —
- Monthly cashflow
- —
- DSCR
- —
- Eligible?
- —
Short-term bridge; refi at stabilization.
Rent comps 10 comps
| Address | Beds | Baths | Sqft | Rent | $/sqft | DOM | Units | Dist |
|---|---|---|---|---|---|---|---|---|
| 515 E Stanford St Lubbock, TX | 3.0 | 1.0 | 910 | $595 | $0.65 | 21d | 1 | 0.57mi |
| 509 E Queens St Lubbock, TX | 3.0 | 2.0 | 1090 | $1,050 | $0.96 | 43d | 1 | 0.64mi |
| 503 E Rice St Lubbock, TX | 3.0 | 2.0 | 1103 | $1,150 | $1.04 | 21d | 1 | 0.65mi |
| 924 E Emory St Lubbock, TX | 1.0–2.0 | 1.0–2.0 | 865 | $1,008 | $1.17 | 13d | 8 | 1.06mi |
| 506 E Municipal Dr Lubbock, TX | 3.0 | 1.0 | 1065 | $900 | $0.85 | 43d | 1 | 1.09mi |
| 1726 E Dartmouth St Unit B Lubbock, TX | 3.0 | 1.0 | 1100 | $1,000 | $0.91 | 43d | 1 | 1.28mi |
| 1726 E Dartmouth St Unit A Lubbock, TX | 3.0 | 1.0 | 1100 | $1,000 | $0.91 | 21d | 1 | 1.28mi |
| 1730 E Dartmouth St Unit A Lubbock, TX | 3.0 | 1.0 | 1015 | $695 | $0.68 | 43d | 1 | 1.28mi |
| 1918 E Cornell St Lubbock, TX | 3.0 | 2.0 | 1028 | $1,080 | $1.05 | 21d | 1 | 1.33mi |
| 2608 E Colgate St Lubbock, TX | 3.0 | 1.0 | 990 | $900 | $0.91 | 43d | 1 | 1.45mi |
Listing history 21 events
-
2026-06-18days on market $59,900 Active 35 DOM
-
2026-06-17days on market $59,900 Active 34 DOM
-
2026-06-16days on market $59,900 Active 33 DOM
-
2026-06-15days on market $59,900 Active 32 DOM
-
2026-06-14days on market $59,900 Active 30 DOM
-
2026-06-13pricedays on market $59,900 Active 29 DOM
-
2026-06-10days on market $69,000 Active 27 DOM
-
2026-06-09days on market $69,000 Active 26 DOM
-
2026-06-08days on market $69,000 Active 25 DOM
-
2026-06-07days on market $69,000 Active 24 DOM
-
2026-06-05days on market $69,000 Active 21 DOM
-
2026-06-03days on market $69,000 Active 20 DOM
-
2026-06-02days on market $69,000 Active 19 DOM
-
2026-06-01days on market $69,000 Active 18 DOM
-
2026-05-31days on market $69,000 Active 17 DOM
-
2026-05-30days on market $69,000 Active 16 DOM
-
2026-05-14$79,999 Active 585-char remark
-
2026-04-08soldstatus
-
2025-02-03soldstatus
-
1994-01-01soldstatus
-
1988-09-01soldstatus
ⓘ Source: listings_history table (triggers on properties + properties_extension) + one-shot
backfill from property_details.listing_events for pre-trigger history.
Tax reassessment forecast TX · Resets to sale price
- Current annual tax
- $1,048 · $87/mo
- Projected year-2 tax
- $1,096 · $91/mo
- Expected delta
- +$48/yr (+$4/mo · 4.6%)
ⓘ Screening estimate from a state-policy table — verify with the county assessor before closing.
Climate risk First Street
- Flood 1/10 Low FEMA zone X (unshaded) · 0% chance over 30 yrs
- Wildfire 5/10 Major
- Heat 5/10 Major 6 d/yr ≥100°F today · 18 d/yr by 30 yrs out
- Wind 2/10 Low 100% chance of damaging wind over 30 yrs
- Air quality 2/10 Low 1 unhealthy d/yr today · 1 by 30 yrs out
Nearby sold comps map
Loading sold comps map…
Walkable amenities ~0.75 mi
Loading nearby amenities…
Taxation est. · year 1
- Rental income
- $12,487
- − Mortgage interest
- −$3,355
- − Property taxes
- −$1,048
- − Insurance
- −$300
- − Repairs & maintenance
- −$999
- − Management
- −$999
- − Depreciation
- −$1,743
- Taxable income
- $4,044
- Est. tax owed @ 24.0%
- −$971
- After-tax cash flow
- $3,777/yr
For passive investors: Depreciation is non-cash, so a rental often shows a tax loss while cash-flowing — sheltering income. Rental losses are passive: they offset passive income freely, and up to $25,000/yr can offset ordinary (W-2) income if you actively participate and your MAGI is under $100k (phasing out to $0 by $150k); unused losses carry forward. On sale, claimed depreciation is recaptured at up to 25%, and gains may owe capital-gains tax (a 1031 exchange can defer both). Figures are a year-1 estimate at your 24.0% rate — not tax advice; consult a CPA.
Schools (NCES district)
- District
- Lubbock ISD
- NCES district ID
- 4828500
- Math proficiency
- 36% ▼ -8.00%
- Reading proficiency
- 39% ▼ -1.00%
- Median HH income
- $39,820
- Composite
- 31.44/100
- National rank
- #5984
- State rank
- #481 of 826 in TX
Livability — Lubbock
- Score
- 80/100
- State rank
- #37
- US rank
- #1749
Category grades
Schools grade is shown separately in the Schools card above.
Census & demographics
- Census place
- Lubbock, TX
- County
- Lubbock County · 293,542 people
- City population
- 283,030
- Metro
- Lubbock, TX
- Population (ZIP)
- 16,089
- Household income
- $47,907
- Rent vs Own
- Severe rent burden
- 612.0
Population outlook (Lubbock County) Hauer SSP2
- Today (2025)
- 345,960 people
- By 2030
- 371,449 · +7.4%
- By 2040
- 424,539 · +22.7%
- By 2050
- 481,150 · +39.1%
- By 2075
- 633,467 · +83.1%
- By 2100
- 746,853 · +115.9%
Race, ethnicity, and origin ACS 2023
- Neighborhood character
- Diverse neighborhood (Simpson 0.64)
- Race & ethnicity
- Hispanic / Latino 49% White 26% Black 23% Two or more races 16% Native American 1%
- Hispanic origin (detail)
- Mexican 35%
- Common ancestry
- Slovak 1%
- Foreign-born
- 3% · Canada
- Languages at home
- 74% English-only · Spanish 25%
Political lean MEDSL · Lubbock
- 2024 margin
- Solid R (+39.5) · D 29.7% · R 69.2% · Other 1.0%
- 2008→2024 swing
- -2.8pp toward R · 2008: -36.7pp · 2024: -39.5pp
- All cycles
- 2024: R+39.5 2020: R+32.2 2016: R+38.4 2012: R+40.9 2008: R+36.7
Not yet ingested
- Civics
- —
Market trends
- HPI YoY
- ▼ -17.69%
- Current HPI
- 178.9297
- Rent YoY
- ▲ 1.52%
- Metro
- Lubbock, TX
- State GDP YoY
- ▲ 3.95%
- F500 in state
- 110
Industry mix (Fortune 500 HQ in TX)
| Industry | F500 HQs | Revenue |
|---|---|---|
| Energy | 16 | $1,198B |
|
||
| Technology | 5 | $198B |
|
||
| Engineering / Construction | 4 | $72B |
|
||
| Energy Services | 3 | $60B |
|
||
| Utilities | 3 | $41B |
|
||
| Healthcare | 2 | $330B |
|
||
Price history
-25.1% since first listed7 events — show timeline
- 2026-06-13 Price Changed $59,900 NTREIS
- 2026-05-21 Price Changed $69,000 NTREIS
- 2026-05-14 Listed $79,999 NTREIS
- 2026-04-08 Sold (Public Records) — Public Records
- 2025-02-03 Sold (Public Records) — Public Records
- 1994-01-01 Sold (Public Records) — Public Records
- 1988-09-01 Sold (Public Records) — Public Records
Property tax history
+3.2%/yrLatest (2025): $1,048 · +7.2% YoY. Source: county tax records.
Cash-flow waterfall
monthlySold comps — $/sqft
last 12 mo · ≤1 miLoading sold comps…