 🌊 Lakefront
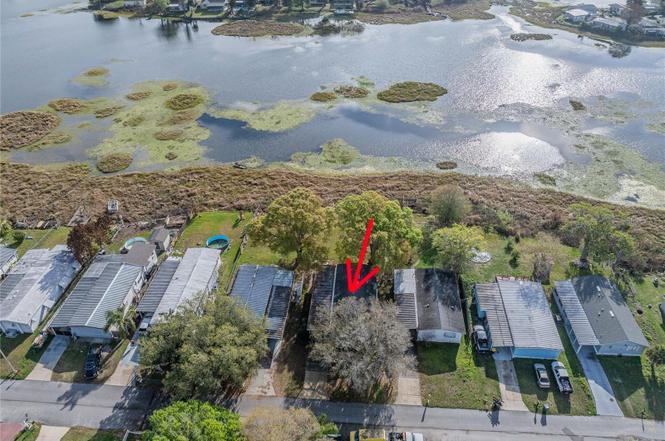
1154 Country Club Ln · Crystal Lake, FL
Flood risk 1/10 · Minimal
- FEMA flood zone
- X (unshaded)
- Chance of flooding over 30 yrs
- 0.0%
- Est. flood insurance / yr
- $507 – $1,088
Fire risk 3/10 · Minor
- Est. fire insurance / yr
- $947 – $1,759
Heat risk 8/10 · Major
- Hot days now (above 108°F)
- 7 days/yr
- Hot days in 30 yrs
- 23 days/yr
Wind risk 9/10 · Severe
- Chance of severe wind over 30 yrs
- 99.0%
Air-quality risk 2/10 · Minimal
- Unhealthy air days now
- 1 days/yr
- Unhealthy air days in 30 yrs
- 2 days/yr
Risk factors via First Street. Map © Google.
Why this score? — see what drove the C grade
The composite is a weighted blend of 9 inputs, each scored 0–100. Each bar is that input's sub-score; the figure is the points it added to the 100-point composite (weight × sub-score).
- Cash flow +23.3/30.0
- DSCR +7.5/10.0
- ARV discount +7.5/15.0
- 1% rule +6.2/10.0
- Schools +3.5/10.0
- Livability +3.3/5.0
- Rent growth +2.8/5.0
- Condition / age +2.5/5.0
- Appreciation +0.0/10.0
$130,000
🖨 Deal sheet (PDF) 📄 Offer letter ✓ Due diligence
Listing remarks MLS
A never ending day at the lake. .. This home has been beautifully kept.
Key facts
- Dining and shopping
- Country club ln
- Peaceful lake
Tags
Property features AI
Finance
- Other: Located in a PUD zoning; Lot dimensions approximately 50 x 216 feet (about 0.25 acre)
- HOA & community: No HOA/association indicated
Exterior
- Parking: Has a 1-space carport
- Utilities: Public water; Public sewer; Electricity available
- Home design: Manufactured double-wide home (residential); Single-story; Faces east; Entry on one level
- Construction: Vinyl siding; Shingle roof; Crawlspace foundation
- Exterior features: Lakefront property on Skyview Lake with lake access and lake views; Other exterior features
Interior
- Kitchen: Refrigerator
- Bedrooms: 2 bedrooms
- Flooring: Linoleum
- Bathrooms: 2 full bathrooms
- Heating & cooling: No central heating listed; Mini-split cooling unit(s)
- Interior features: Ceiling fans
- Laundry & utility: No laundry hook-ups listed
Neighborhood map
What this means for you Summary
Snapshot
- This is a 2-bed/2.0-bath manufactured listed at $130k.
Deal economics
- At list price, monthly cash flow is $237 ($3k/yr) — positive.
- The deal already cash-flows at list — no discount required.
- Meets the 1% rule at list price ($1k rent vs $130k).
- Recommended offer: $118k (9.0% below list) — sets the bar for market timing.
Location & tenants
- Location reads 66/100 on livability (#620 in FL) — a middle-class / working-renter tenant base. Strengths: cost of living A+, housing A+, health & safety A; Watch: amenities F, commute F, employment F.
- Polk (suburban): math 39% / reading 43% proficiency, ranked #62 of 73 in FL (top 85%) — families likely to look elsewhere, expect single-tenant / working-renter base with shorter leases.
- Zoned schools: Clarence Boswell Elementary School (math 45% / reading 35%, grade F, #1,491 of 2,144 statewide, top 70%, 636 students, 62% FRL); Crystal Lake Middle School (math 27% / reading 27%, grade F, #497 of 571 statewide, top 88%, 949 students, 71% FRL); Tenoroc High School (math 12% / reading 25%, grade F, #568 of 667 statewide, top 85%, 1,127 students, 63% FRL).
- Zoned-school proficiency averages 28% at this address vs 41% district-wide (-12 pts) — the specific schools serving this property underperform the Polk average; the district grade overstates school quality for this exact location.
- Market conditions: Rents rising (+1.1%/yr); 256 active listings in the ZIP; 21 comparable units currently listed for rent nearby; rentals at typical pace (median 16d on market — plan ~3-4 weeks tenant-placement turnaround); 10,384 units permitted in Polk County in 2024 (1,716 in 5+ unit buildings).
- This rent runs 33% of the median local income ($53k/yr) — at the standard rent-burdened threshold; future hikes will face affordability resistance.
Forward outlook
- Local home prices are declining (-3.0%/yr); year-one equity from $899 of loan paydown is wiped out by about $4k of value loss. Plan a longer hold.
- Polk County population projected at +33% by 2050 — long-run rental-demand tailwind backs the buy-and-hold thesis.
Negotiation context
- It's been on market 102 days — a 9% lower offer ($118k) is reasonable based on typical stale-listing flexibility.
- 2 sale attempts since 22y ago with the ask held roughly flat each time — persistent listings suggest the price (not the market) is what's stuck; bring a comps-based counter.
- Current owner paid $55k; list at $130k implies a 136% gain — meaningful room to come down on a strong offer.
Risks & watch-outs
- Climate carrying-cost: severe wind risk, 99% chance of damaging wind over 30y; extreme-heat days projected 7→23/yr by 2055 (HVAC capex compounding) — expect insurance premiums to compound above CPI over the hold.
Questions for the listing agent
- It's been on market 102 days. Have you received any prior offers? Is the seller open to a 9% concession, seller financing, or rate buy-down credit?
- Built in 1977 — when were the roof, HVAC, electrical panel, plumbing, and water heater last replaced?
- Why hasn't it sold? Are there any deal-killer items the seller is aware of (foundation, flood, title, zoning, code violations)?
- Is there a deadline driving the sale (1031 exchange, divorce, estate, relocation)? That informs how much negotiation room exists.
- This sits on a lake — are riparian / water-frontage rights deeded with the parcel? Any dock permits, shoreline easements, or HOA water-use restrictions?
- What's the documented flood / surge / shoreline-erosion history here (FEMA AND non-FEMA — e.g., storm surge, creek backup, septic-field saturation)?
- Any water-quality or seasonal algae-bloom issues that affect tenant satisfaction or short-term-rental demand?
- What's the average days-on-market for RENTAL listings here right now (not sales)? A rising rental-DOM trend means longer vacancies and softer asking-rent achievability than the comps imply.
- What's the recent tenant-quality profile in this submarket — average credit score on applications, eviction rate, late-payment / NSF rate, and stable-employment percentage? A property-management company in the area should have these aggregated.
- How much new for-sale + rental construction is in the pipeline within 1–3 miles? Heavy new supply typically softens prices + rents 12–24 months out; constrained supply supports both.
Investment metrics
- 1% rule
- 1.12% ✓
- Cap rate
- 8.48%
- Cash-on-cash
- 7.83%
- DSCR
- 1.35
- GRM
- 7.4
CMA / ARV
No comps found within radius.
Projected returns pro-forma
-3.0% appreciation · 1.05% rent growth · sell at horizon
- IRR
- -6.6%
- Equity multiple
- 0.76×
- Total profit
- $-8,724
- Equity at exit
- $19,383
- IRR
- 0.4%
- Equity multiple
- 1.03×
- Total profit
- $916
- Equity at exit
- $11,240
Cash invested: $36,400 (down + closing). Projections, not guarantees.
Landlord ↔ Tenant lean methodology
- Overall (STATE)
- 87 Strongly Landlord-Friendly
- State Florida
- 87 Strongly Landlord-Friendly · R+3
- County
- — inherits STATE
- City
- — inherits STATE
ZIP-level market 33801
- Home prices YoY
- -15.9%
- Rents YoY
- 1.1%
- Active inventory
- 256
- Price-to-rent
- 7.4×
Monthly cashflow live
- Estimated rent
- $1,460 high interval (Pro) →
- Mortgage (P&I)
- −$682
- Tax from tax record
- −$180 /mo · $2,165/yr
- Insurance
- −$54
- HOA
- −$0
- Vacancy / Maint / Mgmt
- −$307
- Net cashflow
- $237
Break-even live
Sensitivity live
| Price | -10% $311 | -5% $274 | +0% $237 | +5% $201 | +10% $164 |
|---|---|---|---|---|---|
| Rent | -10% $122 | -5% $180 | +0% $237 | +5% $295 | +10% $353 |
| Rate | -1.0pp $303 | -0.5pp $270 | base $237 | +0.5pp $204 | +1.0pp $169 |
UW: 25.0% down · 7.5% · 30yr · 1.5% tax · 5.0% vac · 8.0% maint · 8.0% mgmt
Financing live
Cash to close
- Down payment
- $32,500
- Closing costs
- $3,900
- Reserves months
- —
- Total cash needed
- —
Loan-product check · same deal, 3 products live
Conventional
25% down · 7.5% · 30yr
- Down + closing
- —
- Monthly P&I
- —
- Monthly cashflow
- —
- DSCR
- —
- Eligible?
- —
Personal DTI + credit; lowest rate.
DSCR
20% down · 8.5% · 30yr
- Down + closing
- —
- Monthly P&I
- —
- Monthly cashflow
- —
- DSCR
- —
- Eligible?
- —
No personal income docs; deal must DSCR.
Hard money
10% down · 12.0% · 12mo
- Down + closing
- —
- Monthly P&I
- —
- Monthly cashflow
- —
- DSCR
- —
- Eligible?
- —
Short-term bridge; refi at stabilization.
Rent comps 21 comps
| Address | Beds | Baths | Sqft | Rent | $/sqft | DOM | Units | Dist |
|---|---|---|---|---|---|---|---|---|
| 2929 Nine Iron Dr Lakeland, FL | 2.0 | 1.0 | 850 | $875 | $1.03 | 4d | 1 | 0.23mi |
| 1505 Goodyear Ave Unit 17 Lakeland, FL | 2.0 | 1.0 | 792 | $950 | $1.20 | 25d | 1 | 0.33mi |
| 2839 8 Iron Dr Unit 2841 Lakeland, FL | 2.0 | 1.5 | 900 | $1,397 | $1.55 | 25d | 1 | 0.34mi |
| 2830 Skyview Dr Lakeland, FL | 2.0 | 1.0 | 850 | $1,175 | $1.38 | 25d | 1 | 0.35mi |
| 1323 Tom Watson Rd Lakeland, FL | 2.0 | 1.0 | 800 | $1,350 | $1.69 | 25d | 1 | 0.42mi |
| 1803 Venus St Lakeland, FL | 3.0 | 2.0 | 1259 | $1,645 | $1.31 | 4d | 1 | 0.62mi |
| 521 Skyline Dr E Lakeland, FL | 3.0 | 2.0 | 1260 | $2,300 | $1.83 | 4d | 1 | 0.76mi |
| 2524 Kiwanis Ave Lakeland, FL | 3.0 | 1.5 | 1468 | $1,670 | $1.14 | 13d | 1 | 0.84mi |
| 3306 Peachtree Hill Rd Lakeland, FL | 2.0 | 1.0 | 742 | $1,195 | $1.61 | 16d | 1 | 0.92mi |
| 3061 Crystal Hills Dr Lakeland, FL | 2.0 | 2.0 | 720 | $1,400 | $1.94 | 25d | 1 | 0.93mi |
| 2402 Kiwanis Ave Unit 1258725P Lakeland, FL | 3.0 | 1.0 | 1194 | $3,262 | $2.73 | 16d | 1 | 0.94mi |
| 3321 Peachtree Hill Rd Lakeland, FL | 3.0 | 2.0 | 960 | $1,475 | $1.54 | 16d | 1 | 0.95mi |
| 3245 E Main St Unit 2 Lakeland, FL | 2.0 | 2.0 | 700 | $1,250 | $1.79 | 16d | 1 | 0.96mi |
| 3245 E Main St Lakeland, FL | 2.0 | 1.0 | 750 | $1,100 | $1.47 | 25d | 1 | 0.96mi |
| 1922 Crystal Grove Dr #1922 Lakeland, FL | 2.0 | 2.0 | 1014 | $1,547 | $1.53 | 25d | 1 | 1.16mi |
| 1969 Crystal Grove Dr Lakeland, FL | 2.0 | 1.0–2.0 | 576 | $1,415 | $2.46 | 4d | 8 | 1.20mi |
| 2184 Colonial Ave Lakeland, FL | 3.0 | 2.0 | 1123 | $1,645 | $1.46 | 25d | 1 | 1.24mi |
| 2919 Maine Ave Lakeland, FL | 3.0 | 1.0 | 1134 | $1,275 | $1.12 | 15d | 1 | 1.30mi |
| 2023 Tennyson St Unit 2025 Lakeland, FL | 2.0 | 1.0 | 884 | $1,095 | $1.24 | 25d | 1 | 1.40mi |
| 1233 Honeytree Ln E Lakeland, FL | 3.0 | 2.0 | 1355 | $2,250 | $1.66 | 4d | 1 | 1.41mi |
| 510 Longfellow Blvd Lakeland, FL | 3.0 | 2.0 | 1315 | $1,825 | $1.39 | 4d | 1 | 1.41mi |
Listing history 24 events
-
2026-06-22days on market $130,000 Active 102 DOM
-
2026-06-18days on market $130,000 Active 99 DOM
-
2026-06-17days on market $130,000 Active 98 DOM
-
2026-06-16days on market $130,000 Active 97 DOM
-
2026-06-15days on market $130,000 Active 96 DOM
-
2026-06-13days on market $130,000 Active 94 DOM
-
2026-06-10days on market $130,000 Active 91 DOM
-
2026-06-09days on market $130,000 Active 90 DOM
-
2026-06-08days on market $130,000 Active 89 DOM
-
2026-06-07days on market $130,000 Active 88 DOM
-
2026-06-05days on market $130,000 Active 85 DOM
-
2026-06-03days on market $130,000 Active 84 DOM
-
2026-06-03days on market $130,000 Active 83 DOM
-
2026-06-01days on market $130,000 Active 82 DOM
-
2026-05-31days on market $130,000 Active 81 DOM
-
2026-03-11$130,000 Active
-
2026-03-09soldstatus $55,000
-
2005-12-08soldstatus $68,000
-
2004-09-22soldstatus $58,000
-
2004-09-16soldstatus $58,000 71-char remark
Show marketing remark (71 chars)
A never ending day at the lake. .. This home has been beautifully kept.
-
2004-08-14historical 71-char remark
Show marketing remark (71 chars)
A never ending day at the lake. .. This home has been beautifully kept.
-
2004-07-09$59,500 71-char remark
Show marketing remark (71 chars)
A never ending day at the lake. .. This home has been beautifully kept.
-
2000-10-19soldstatus $45,000
-
1999-07-13soldstatus $45,500
ⓘ Source: listings_history table (triggers on properties + properties_extension) + one-shot
backfill from property_details.listing_events for pre-trigger history.
Tax reassessment forecast FL · Resets to sale price
- Current annual tax
- $2,165 · $180/mo
- Projected year-2 tax
- $2,165 · $180/mo
- Expected delta
- $0/yr ($0/mo · 0.0%)
ⓘ Screening estimate from a state-policy table — verify with the county assessor before closing.
Climate risk First Street
- Flood 1/10 Low FEMA zone X (unshaded) · 0% chance over 30 yrs
- Wildfire 3/10 Moderate
- Heat 8/10 Severe 7 d/yr ≥108°F today · 23 d/yr by 30 yrs out
- Wind 9/10 Extreme 99% chance of damaging wind over 30 yrs
- Air quality 2/10 Low 1 unhealthy d/yr today · 2 by 30 yrs out
Nearby sold comps map
Loading sold comps map…
Walkable amenities ~0.75 mi
Loading nearby amenities…
Taxation est. · year 1
- Rental income
- $17,524
- − Mortgage interest
- −$7,282
- − Property taxes
- −$2,165
- − Insurance
- −$650
- − Repairs & maintenance
- −$1,402
- − Management
- −$1,402
- − Depreciation
- −$3,782
- Taxable income
- $842
- Est. tax owed @ 24.0%
- −$202
- After-tax cash flow
- $2,647/yr
For passive investors: Depreciation is non-cash, so a rental often shows a tax loss while cash-flowing — sheltering income. Rental losses are passive: they offset passive income freely, and up to $25,000/yr can offset ordinary (W-2) income if you actively participate and your MAGI is under $100k (phasing out to $0 by $150k); unused losses carry forward. On sale, claimed depreciation is recaptured at up to 25%, and gains may owe capital-gains tax (a 1031 exchange can defer both). Figures are a year-1 estimate at your 24.0% rate — not tax advice; consult a CPA.
Schools (NCES district)
- District
- Polk
- NCES district ID
- 1201590
- Math proficiency
- 39% ▼ -11.00%
- Reading proficiency
- 43% ▼ -4.00%
- Median HH income
- $43,979
- Composite
- 34.74/100
- National rank
- #5132
- State rank
- #62 of 73 in FL
Livability — Crystal Lake
- Score
- 66/100
- State rank
- #620
- US rank
- #12023
Category grades
Schools grade is shown separately in the Schools card above.
Census & demographics
- Census place
- Crystal Lake, FL
- County
- Polk County · 740,051 people
- City population
- 33,460
- Metro
- Lakeland-Winter Haven, FL
- Population (ZIP)
- 35,394
- Household income
- $53,061
- Rent vs Own
- Severe rent burden
- 1291.0
Population outlook (Polk County) Hauer SSP2
- Today (2025)
- 752,975 people
- By 2030
- 804,621 · +6.9%
- By 2040
- 906,117 · +20.3%
- By 2050
- 1,000,476 · +32.9%
- By 2075
- 1,197,520 · +59.0%
- By 2100
- 1,271,518 · +68.9%
Race, ethnicity, and origin ACS 2023
- Neighborhood character
- Diverse neighborhood (Simpson 0.58)
- Race & ethnicity
- White 60% Hispanic / Latino 19% Black 16% Two or more races 8% Asian 1%
- Hispanic origin (detail)
- Mexican 5% Puerto Rican 8% Cuban 3%
- Common ancestry
- Romanian 2% Slovak 2% Lithuanian 1%
- Foreign-born
- 8% · Canada
- Languages at home
- 83% English-only · Spanish 14% French/Haitian/Cajun 1%
Political lean MEDSL · Polk
- 2024 margin
- Strong R (+20.7) · D 39.2% · R 59.9%
- 2008→2024 swing
- -14.6pp toward R · 2008: -6.1pp · 2024: -20.7pp
- All cycles
- 2024: R+20.7 2020: R+14.4 2016: R+14.1 2012: R+6.8 2008: R+6.1
Not yet ingested
- Civics
- —
Market trends
- HPI YoY
- ▼ -70.91%
- Current HPI
- 373.7159
- Rent YoY
- ▲ 1.05%
- Metro
- Lakeland-Winter Haven, FL
- State GDP YoY
- ▲ 3.28%
- F500 in state
- 36
Industry mix (Fortune 500 HQ in FL)
| Industry | F500 HQs | Revenue |
|---|---|---|
| Industrial Technology | 2 | $29B |
|
||
| Insurance | 2 | $17B |
|
||
| Retail | 1 | $60B |
|
||
| Technology Distribution | 1 | $58B |
|
||
| Homebuilding | 1 | $35B |
|
||
| Technology Manufacturing | 1 | $35B |
|
||
Price history
+185.7% since first listed9 events — show timeline
- 2026-03-11 Listed $130,000 Stellar MLS as Distributed by MLS Grid
- 2026-03-09 Sold (Public Records) $55,000 Public Records
- 2005-12-08 Sold (Public Records) $68,000 Public Records
- 2004-09-22 Sold (Public Records) $58,000 Public Records
- 2004-09-16 Sold (MLS) $58,000 Stellar MLS as Distributed by MLS Grid
- 2004-08-14 Listing Removed — Stellar MLS as Distributed by MLS Grid
- 2004-07-09 Listed $59,500 Stellar MLS as Distributed by MLS Grid
- 2000-10-19 Sold (Public Records) $45,000 Public Records
- 1999-07-13 Sold (Public Records) $45,500 Public Records
Property tax history
+32.0%/yrLatest (2025): $2,165 · +7.1% YoY. Source: county tax records.
Cash-flow waterfall
monthlySold comps — $/sqft
last 12 mo · ≤1 miLoading sold comps…