5018 Point Lavista · Caney City, TX
Flood risk No data
- FEMA flood zone
- —
- Chance of flooding over 30 yrs
- —
- Est. flood insurance / yr
- —
Fire risk No data
- Est. fire insurance / yr
- —
Heat risk No data
- Hot days now (above threshold)
- —
- Hot days in 30 yrs
- —
Wind risk No data
- Chance of severe wind over 30 yrs
- —
Air-quality risk No data
- Unhealthy air days now
- —
- Unhealthy air days in 30 yrs
- —
Risk factors via First Street. Map © Google.
Why this score? — see what drove the D- grade
The composite is a weighted blend of 9 inputs, each scored 0–100. Each bar is that input's sub-score; the figure is the points it added to the 100-point composite (weight × sub-score).
- Cash flow +12.9/30.0
- ARV discount +5.4/15.0
- Schools +4.3/10.0
- DSCR +3.9/10.0
- 1% rule +3.7/10.0
- Rent growth +2.5/5.0
- Condition / age +2.5/5.0
- Livability +2.2/5.0
- Appreciation +0.0/10.0
$274,999
🖨 Deal sheet (PDF) 📄 Offer letter ✓ Due diligence
Listing remarks
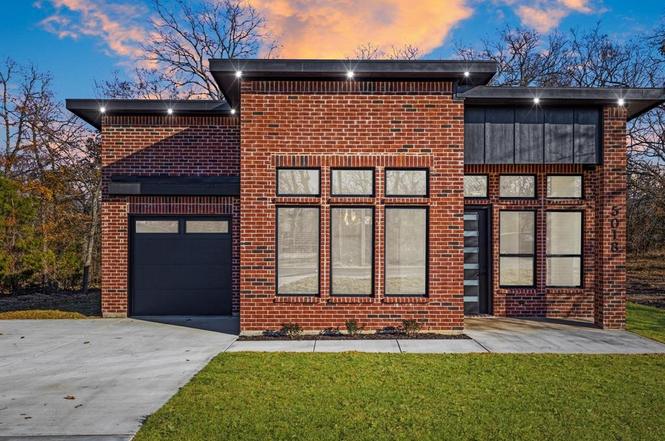
Nestled in the beautiful Point La Vista community of Malakoff, this gorgeous red brick home offers the perfect blend of comfort, style, and peaceful lake living. Enjoy the quiet charm of a lakeside lifestyle with convenient access to a community boat ramp—ideal for weekends on the water and unforgettable family retreats. Inside, you’ll find a modern, open-concept floor plan designed for both everyday living and entertaining, with plenty of room to roam and gather. The neighborhood enhances the experience with resort-style amenities, including a community pool, making this home a true getaway without ever leaving home.
Key facts
- Lakeside lifestyle
- Community boat ramp
- Community pool
Tags
Property features AI
Finance
- Other: Municipal Utility District present
- Financial info: Listing terms include Cash, Conventional, FHA, USDA, VA, and 1031 Exchange
- HOA & community: Mandatory association (Point La Vista POA); Annual HOA fee; HOA covers full use of facilities and grounds maintenance
Exterior
- Parking: Covered parking (1 space); Garage (attached) with epoxy flooring and concrete surface; 2-car single door configuration; Boat parking available
- Utilities: MUD water; MUD sewer
- Home design: Single family residence; One story; Property is attached
- Construction: Built in 2025
- Exterior features: Lot less than 0.5 acre (approximately 0.15 acre); Subdivision: Point La Vista Sub Sec I; Please see GPS for driving directions
Interior
- Kitchen: Dishwasher; Electric range; Kitchen island; Eat-in kitchen; Pantry
- Bedrooms: 3 bedrooms (all on the main level); Primary bedroom with garden tub, separate shower, and walk-in closet; Two additional bedrooms with walk-in closets
- Bathrooms: 2 full bathrooms; Double vanity in at least one bath
- Heating & cooling: Central heating (electric); Central air (electric); Ceiling fans
- Interior features: Central vacuum; Chandelier; Decorative lighting; Double vanity; Eat-in kitchen; Kitchen island; Open floorplan; Pantry; Walk-in closets; One living area; One dining area; Room count of 5
- Laundry & utility: Electric water heater
Neighborhood map
What this means for you Summary
Snapshot
- This is a 3-bed/2.0-bath single-family listed at $275k.
Deal economics
- At list price, monthly cash flow is $-19 ($-233/yr) — negative.
- To cash-flow at today's rent, offer at most $272k (1.0% below list).
- To meet the 1% rule (rent ≥ 1% of price), the offer needs to be $240k (12.7% below list).
- Recommended offer: $240k (12.7% below list) — sets the bar for 1% rule.
- Cap rate 6.2% vs local median 0.6% in Caney City — top-decile yield for the area; either an underpriced asset or a hidden risk that comps aren't pricing in. Stress-test before assuming the spread holds.
Location & tenants
- Location reads 45/100 on livability (#1,562 in TX) — a working-class tenant base; expect higher turnover. Strengths: cost of living A+, crime A; Watch: amenities F, commute F, employment F.
- Malakoff ISD (town): math 48% / reading 54% proficiency, ranked #187 of 826 in TX (top 23%) — acceptable for families but not a draw, mixed tenant base, ~2y average lease; 61% free/reduced lunch — lower-income household profile, screen leases tightly.
- Zoned schools: Malakoff El (math 58% / reading 54%, grade C+, #574 of 4,322 statewide, top 14%, 457 students, 75% FRL); Malakoff Middle (math 48% / reading 54%, grade C, #326 of 1,662 statewide, top 20%, 323 students, 72% FRL); Malakoff H S (math 42% / reading 52%, grade D-, #591 of 1,632 statewide, top 38%, 378 students, 62% FRL).
- Market conditions: 227 active listings in the ZIP; 1 comparable units currently listed for rent nearby; 263 units permitted in Henderson County in 2024 (0 in 5+ unit buildings).
Forward outlook
- Local home prices are declining (-3.0%/yr); year-one equity from $2k of loan paydown is wiped out by about $8k of value loss. Plan a longer hold.
Negotiation context
- It's been on market 59 days — a 3% lower offer ($267k) is reasonable based on typical stale-listing flexibility.
- 3 sale attempts; this cycle's ask has dropped $24k (8%) from the opening price — seller is motivated, your offer sets the floor, not the list.
Questions for the listing agent
- What do current leases actually rent for vs. the listed asking? Can we see a recent rent roll and the last 12 months of T-12 income?
- It's been on market 59 days. Have you received any prior offers? Is the seller open to a 13% concession, seller financing, or rate buy-down credit?
- What does the HOA fee cover, when was the last increase, and are there any pending special assessments or reserve-fund shortfalls?
- Is there a deadline driving the sale (1031 exchange, divorce, estate, relocation)? That informs how much negotiation room exists.
- Schools are F-rated, which usually means shorter tenancies and higher turnover. Who's the typical renter profile here, and what's been the actual vacancy rate?
- The area grade is low — what's the realistic commute time and amenity access for the typical tenant pool here? Any planned neighborhood developments (good or bad) we should know about?
- What's the average days-on-market for RENTAL listings here right now (not sales)? A rising rental-DOM trend means longer vacancies and softer asking-rent achievability than the comps imply.
- What's the recent tenant-quality profile in this submarket — average credit score on applications, eviction rate, late-payment / NSF rate, and stable-employment percentage? A property-management company in the area should have these aggregated.
- How much new for-sale + rental construction is in the pipeline within 1–3 miles? Heavy new supply typically softens prices + rents 12–24 months out; constrained supply supports both.
Investment metrics
- 1% rule
- 0.87% ✗
- Cap rate
- 6.21%
- Cash-on-cash
- -0.30%
- DSCR
- 0.99
- GRM
- 9.5
CMA / ARV
- ARV (on-the-fly)
- $262,500
- Comps found
- 12
Show comp detail 12 sales within ~0.75 mi
| Address | Dist | Beds/Ba | Sqft | Sold | Price | $/sf | Match |
|---|---|---|---|---|---|---|---|
| 5018 Point Lavista | 0.00mi | 3/2.0 | 1,500 (0%) | 1mo | $274,999 | $183 | 100 |
| 4898 Point La Vista Rd | 0.16mi | 3/2.0 | 1,520 (+1%) | 1mo | $279,000 | $184 | 90 |
| 221 Harris Blvd | 0.15mi | 3/2.0 | 1,361 (-9%) | 6mo | $235,000 | $173 | 72 |
| 219 Harris Blvd | 0.15mi | 3/2.0 | 1,361 (-9%) | 8mo | $240,000 | $176 | 71 |
| 4780 La Prada | 0.11mi | 3/2.0 | 1,280 (-15%) | 1mo | $215,000 | $168 | 69 |
| 187 Harris | 0.28mi | 3/2.0 | 1,300 (-13%) | 1mo | $210,000 | $162 | 64 |
| 14815 Goliad Dr | 0.63mi | 3/2.0 | 1,500 (0%) | 10mo | $249,900 | $167 | 62 |
| 286 Harris Blvd | 0.25mi | 3/2.0 | 1,350 (-10%) | 19mo | $233,000 | $173 | 56 |
| 303 Harris Blvd | 0.34mi | 3/2.0 | 1,317 (-12%) | 17mo | $229,990 | $175 | 50 |
| 107 Nob Hill Cir | 0.55mi | 3/2.0 | 1,672 (+12%) | 11mo | $549,000 | $328 | 46 |
| 103 Bayside Cir | 0.69mi | 3/2.0 | 1,280 (-15%) | 0mo | $199,900 | $156 | 43 |
| 5220 Point Lavista | 0.48mi | 2/3.0 (-1) | 1,648 (+10%) | 16mo | $347,500 | $211 | 39 |
Match score weights: distance 35% · size 25% · config 20% · recency 20%. Top-matched comps best support the ARV.
Projected returns pro-forma
-3.0% appreciation · 3.0% rent growth · sell at horizon
- IRR
- -16.8%
- Equity multiple
- 0.41×
- Total profit
- $-45,755
- Equity at exit
- $41,003
- IRR
- -8.6%
- Equity multiple
- 0.46×
- Total profit
- $-41,254
- Equity at exit
- $23,777
Cash invested: $77,000 (down + closing). Projections, not guarantees.
Landlord ↔ Tenant lean methodology
- Overall (STATE)
- 87 Strongly Landlord-Friendly
- State Texas
- 87 Strongly Landlord-Friendly · R+5
- County
- — inherits STATE
- City
- — inherits STATE
ZIP-level market 75148
- Home prices YoY
- -27.6%
- Active inventory
- 227
- Price-to-rent
- 9.5×
Monthly cashflow live
- Estimated rent
- $2,400 medium interval (Pro) →
- Mortgage (P&I)
- −$1,442
- Tax est. 1.5%
- −$344 /mo · $4,125/yr
- Insurance
- −$115
- HOA
- −$15
- Vacancy / Maint / Mgmt
- −$504
- Net cashflow
- $-19
Break-even live
Sensitivity live
| Price | -10% $171 | -5% $76 | +0% $-19 | +5% $-114 | +10% $-210 |
|---|---|---|---|---|---|
| Rent | -10% $-209 | -5% $-114 | +0% $-19 | +5% $75 | +10% $170 |
| Rate | -1.0pp $119 | -0.5pp $50 | base $-19 | +0.5pp $-91 | +1.0pp $-163 |
UW: 25.0% down · 7.5% · 30yr · 1.5% tax · 5.0% vac · 8.0% maint · 8.0% mgmt
Financing live
Cash to close
- Down payment
- $68,750
- Closing costs
- $8,250
- Reserves months
- —
- Total cash needed
- —
Loan-product check · same deal, 3 products live
Conventional
25% down · 7.5% · 30yr
- Down + closing
- —
- Monthly P&I
- —
- Monthly cashflow
- —
- DSCR
- —
- Eligible?
- —
Personal DTI + credit; lowest rate.
DSCR
20% down · 8.5% · 30yr
- Down + closing
- —
- Monthly P&I
- —
- Monthly cashflow
- —
- DSCR
- —
- Eligible?
- —
No personal income docs; deal must DSCR.
Hard money
10% down · 12.0% · 12mo
- Down + closing
- —
- Monthly P&I
- —
- Monthly cashflow
- —
- DSCR
- —
- Eligible?
- —
Short-term bridge; refi at stabilization.
Rent comps 1 comps
| Address | Beds | Baths | Sqft | Rent | $/sqft | DOM | Units | Dist |
|---|---|---|---|---|---|---|---|---|
| 5320 Loma Vis Malakoff, TX | 2.0 | 2.0 | 1324 | $2,400 | $1.81 | 45d | 1 | 0.55mi |
HOA detail
- Monthly dues
- $15 · $180/yr
- Likely covers
- waterpool
Listing history 11 events
-
2026-05-18historical Active Option Contract
-
2026-05-18status Active
-
2026-04-16status Pending
-
2026-04-08historical Active Option Contract
-
2026-04-02price $274,999
-
2026-03-20price $279,999
-
2026-03-02price $284,999
-
2026-02-24$299,000 Active
-
2026-02-12historical
-
2026-01-15price $299,000
-
2025-12-27$315,000 Active
ⓘ Source: listings_history table (triggers on properties + properties_extension) + one-shot
backfill from property_details.listing_events for pre-trigger history.
Nearby sold comps map
Loading sold comps map…
Walkable amenities ~0.75 mi
Loading nearby amenities…
Taxation est. · year 1
- Rental income
- $28,800
- − Mortgage interest
- −$15,404
- − Property taxes
- −$4,125
- − Insurance
- −$1,375
- − Repairs & maintenance
- −$2,304
- − Management
- −$2,304
- − HOA
- −$180
- − Depreciation
- −$8,000
- Taxable loss
- −$4,892
- Est. tax savings @ 24.0%
- +$1,174
- After-tax cash flow
- $941/yr
For passive investors: Depreciation is non-cash, so a rental often shows a tax loss while cash-flowing — sheltering income. Rental losses are passive: they offset passive income freely, and up to $25,000/yr can offset ordinary (W-2) income if you actively participate and your MAGI is under $100k (phasing out to $0 by $150k); unused losses carry forward. On sale, claimed depreciation is recaptured at up to 25%, and gains may owe capital-gains tax (a 1031 exchange can defer both). Figures are a year-1 estimate at your 24.0% rate — not tax advice; consult a CPA.
Schools (NCES district)
- District
- Malakoff ISD
- NCES district ID
- 4828780
- Math proficiency
- 48% ▼ -14.00%
- Reading proficiency
- 54% ▼ -5.00%
- Median HH income
- $38,970
- Composite
- 42.54/100
- National rank
- #3200
- State rank
- #187 of 826 in TX
Livability — Caney City
- Score
- 45/100
- State rank
- #1562
- US rank
- #26636
Category grades
Schools grade is shown separately in the Schools card above.
Census & demographics
- Population (ZIP)
- 5,944
Population outlook (Henderson County) Hauer SSP2
- Today (2025)
- 80,471 people
- By 2030
- 80,608 · +0.2%
- By 2040
- 80,087 · -0.5%
- By 2050
- 78,208 · -2.8%
- By 2075
- 72,423 · -10.0%
- By 2100
- 61,012 · -24.2%
Race, ethnicity, and origin ACS 2023
- Neighborhood character
- Predominantly White (71%)
- Race & ethnicity
- White 71% Two or more races 11% Hispanic / Latino 11% Black 11%
- Hispanic origin (detail)
- Mexican 10%
- Common ancestry
- Russian 2% Slovak 2% Italian 1%
- Foreign-born
- 5% · Canada
- Languages at home
- 92% English-only · Spanish 8%
Political lean MEDSL · Henderson
- 2024 margin
- Solid R (+63.5) · D 18.0% · R 81.4%
- 2008→2024 swing
- -18.8pp toward R · 2008: -44.6pp · 2024: -63.5pp
- All cycles
- 2024: R+63.5 2020: R+60.2 2016: R+60.0 2012: R+54.8 2008: R+44.6
Not yet ingested
- Civics
- —
Market trends
- HPI YoY
- ▼ -82.76%
- Current HPI
- 217.1629
- Rent YoY
- —
- Metro
- —
- State GDP YoY
- ▲ 3.95%
- F500 in state
- 110
Industry mix (Fortune 500 HQ in TX)
| Industry | F500 HQs | Revenue |
|---|---|---|
| Energy | 16 | $1,198B |
|
||
| Technology | 5 | $198B |
|
||
| Engineering / Construction | 4 | $72B |
|
||
| Energy Services | 3 | $60B |
|
||
| Utilities | 3 | $41B |
|
||
| Healthcare | 2 | $330B |
|
||
Price history
-12.7% since first listed11 events — show timeline
- 2026-05-18 Contingent — NTREIS
- 2026-05-18 Relisted — NTREIS
- 2026-04-16 Pending — NTREIS
- 2026-04-08 Contingent — NTREIS
- 2026-04-02 Price Changed $274,999 NTREIS
- 2026-03-20 Price Changed $279,999 NTREIS
- 2026-03-02 Price Changed $284,999 NTREIS
- 2026-02-24 Listed $299,000 NTREIS
- 2026-02-12 Listing Removed — NTREIS
- 2026-01-15 Price Changed $299,000 NTREIS
- 2025-12-27 Listed $315,000 NTREIS
Cash-flow waterfall
monthlySold comps — $/sqft
last 12 mo · ≤1 miLoading sold comps…