 5-Plex
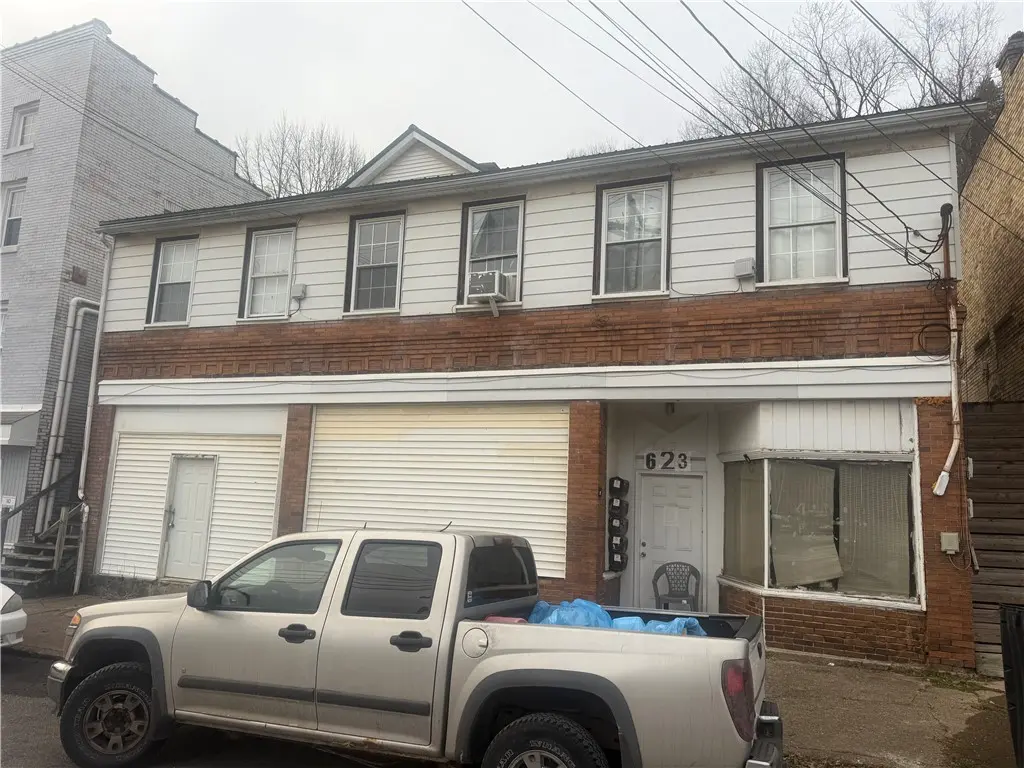
623 Bessemer Ave · Butler, PA
Flood risk 1/10 · Minimal
- FEMA flood zone
- X (unshaded)
- Chance of flooding over 30 yrs
- 0.0%
- Est. flood insurance / yr
- $507 – $1,088
Fire risk 1/10 · Minimal
- Est. fire insurance / yr
- $511 – $949
Heat risk 3/10 · Minor
- Hot days now (above 94°F)
- 7 days/yr
- Hot days in 30 yrs
- 18 days/yr
Wind risk 1/10 · Minimal
- Chance of severe wind over 30 yrs
- 0.0%
Air-quality risk 3/10 · Minor
- Unhealthy air days now
- 3 days/yr
- Unhealthy air days in 30 yrs
- 5 days/yr
Risk factors via First Street. Map © Google.
Why this score? — see what drove the B+ grade
The composite is a weighted blend of 9 inputs, each scored 0–100. Each bar is that input's sub-score; the figure is the points it added to the 100-point composite (weight × sub-score).
- Cash flow +30.0/30.0
- 1% rule +10.0/10.0
- DSCR +10.0/10.0
- ARV discount +7.5/15.0
- Appreciation +6.1/10.0
- Schools +4.3/10.0
- Livability +3.6/5.0
- Rent growth +2.5/5.0
- Condition / age +2.5/5.0
$270,000
🖨 Deal sheet 📄 Offer letter ✓ Due diligence
Multi-family units
County records classify this as Multi-Family (5+ Unit). Listing-text estimate: 5 units. confirmed
5+ unit building — per-unit beds/baths from public records are typically unavailable; the breakdown below (if shown) is an estimate from the listing text.
Listing remarks MLS
623 Bessemer Ave. is a fully occupied 5-Unit Property located in Lyndora. The property is 100% occupied and consistently leased, generating $8790.00 in quarterly rental income, or $35,160.00 annually. With a strong and reliable income stream, the 5-unit produces an approximate Net Operating Income (NOI) of $31,615.24 per year. Its central location and stable tenancy make this a solid investment opportunity with dependable cash flow.
Key facts
- 5,662 sq ft lot
- Built 1900
- Listed 171 days
Neighborhood map
What this means for you Summary
Snapshot
- This is a 5 × 2-bed/1-bath units multifamily listed at $270k.
Deal economics
- At list price, monthly cash flow is $2k ($21k/yr) — positive. Per door: $358/mo.
- The deal already cash-flows at list — no discount required.
- Meets the 1% rule at list price ($4k rent vs $270k).
- Recommended offer: $238k (12.0% below list) — sets the bar for market timing.
- Cap rate 14.3% vs local median 3.8% in Butler — top-decile yield for the area; either an underpriced asset or a hidden risk that comps aren't pricing in. Stress-test before assuming the spread holds.
Location & tenants
- Location reads 71/100 on livability (#705 in PA) — a middle-class / working-renter tenant base. Strengths: cost of living A+, health & safety A+, schools A-; Watch: crime D-, amenities F, commute F.
- Butler Area SD (town): math 41% / reading 59% proficiency, ranked #181 of 539 in PA (top 34%) — acceptable for families but not a draw, mixed tenant base, ~2y average lease.
- Market conditions: 11 active listings in the ZIP; 2 comparable units currently listed for rent nearby; 987 units permitted in Butler County in 2024 (0 in 5+ unit buildings).
Forward outlook
- In year one you build about $8k of equity ($2k loan paydown + $6k appreciation (2.1% local appreciation)).
- Butler County population projected to shrink 5% by 2050 — rents likely to lag national; underwrite the cash flow, not the appreciation.
- At projected returns (2.1% appreciation + 3.0% rent growth), your $76k cash investment doubles in ~3 years — after that, you're playing with house money.
- By year 5, paydown + projected appreciation supports a ~$33k cash-out refi (75% LTV) — recoverable capital for the next deal without selling this one.
Negotiation context
- It's been on market 171 days — a 12% lower offer ($238k) is reasonable based on typical stale-listing flexibility.
Risks & watch-outs
- Watch-outs: built in 1900 — expect roof / HVAC / electrical / plumbing capex.
Questions for the listing agent
- It's been on market 171 days. Have you received any prior offers? Is the seller open to a 12% concession, seller financing, or rate buy-down credit?
- Can we see the unit-by-unit rent roll, current vacancy, and any below-market leases? What's the average tenancy length?
- What capital expenditures (roof, boiler, parking lot, exteriors) have been made in the last 5 years, and what's planned in the next 2?
- Built in 1900 — when were the roof, HVAC, electrical panel, plumbing, and water heater last replaced?
- Why hasn't it sold? Are there any deal-killer items the seller is aware of (foundation, flood, title, zoning, code violations)?
- Is there a deadline driving the sale (1031 exchange, divorce, estate, relocation)? That informs how much negotiation room exists.
- Schools are A-rated — typically a magnet for longer-tenancy family renters. What's the average tenant stay here, and is there a school-zone premium baked into asking?
- Crime grade is D in this area — have there been break-ins, vandalism, or insurance claims at this property in the last 3 years? What carrier currently insures it and at what premium?
- What's the average days-on-market for RENTAL listings here right now (not sales)? A rising rental-DOM trend means longer vacancies and softer asking-rent achievability than the comps imply.
- What's the recent tenant-quality profile in this submarket — average credit score on applications, eviction rate, late-payment / NSF rate, and stable-employment percentage? A property-management company in the area should have these aggregated.
- How much new apartment / multifamily construction is in the pipeline within 1–3 miles? Heavy new supply (>2% of stock underway) typically softens rents 12–24 months out; light construction supports rent growth.
Investment metrics
- 1% rule
- 1.62% ✓
- Cap rate
- 14.25%
- Cash-on-cash
- 28.43%
- DSCR
- 2.26
- GRM
- 5.1
CMA / ARV
- ARV (median comp)
- $155,844
- List price
- $270,000
- Delta
- 73.25%
- Verdict
- OVERPRICED
- Comps
- 1 within 2.0 mi
Projected returns pro-forma
2.12% appreciation · 3.0% rent growth · sell at horizon
- IRR
- 32.8%
- Equity multiple
- 2.78×
- Total profit
- $134,244
- Equity at exit
- $108,325
- IRR
- 33.9%
- Equity multiple
- 5.42×
- Total profit
- $333,843
- Equity at exit
- $157,408
Cash invested: $75,600 (down + closing). Projections, not guarantees.
Landlord ↔ Tenant lean methodology
- Overall (STATE)
- 62 Landlord-Friendly
- State Pennsylvania
- 62 Landlord-Friendly · EVEN
- County
- — inherits STATE
- City
- — inherits STATE
ZIP-level market 16045
- Home prices YoY
- 2.0%
- Active inventory
- 11
- Price-to-rent
- 25.7×
Monthly cashflow live
- Estimated rent
- $4,369 medium interval (Pro) →
- Mortgage (P&I)
- −$1,416
- Tax from tax record
- −$132 /mo · $1,585/yr
- Insurance
- −$112
- HOA
- −$0
- Vacancy / Maint / Mgmt
- −$917
- Net cashflow
- $1,791
Break-even live
5-unit breakdown (identical units grouped — click to expand)
| Units | Beds | Baths | Est. rent |
|---|---|---|---|
| 5× units | 2 | 1 | $4,370 |
| #1 | 2 | 1 | $874 |
| #2 | 2 | 1 | $874 |
| #3 | 2 | 1 | $874 |
| #4 | 2 | 1 | $874 |
| #5 | 2 | 1 | $874 |
| Total (5 units) | $4,369 | ||
UW: 25.0% down · 7.5% · 30yr · 1.5% tax · 5.0% vac · 8.0% maint · 8.0% mgmt
Financing live
Cash to close
- Down payment
- $67,500
- Closing costs
- $8,100
- Reserves months
- —
- Total cash needed
- —
Loan-product check · same deal, 3 products live
Conventional
25% down · 7.5% · 30yr
- Down + closing
- —
- Monthly P&I
- —
- Monthly cashflow
- —
- DSCR
- —
- Eligible?
- —
Personal DTI + credit; lowest rate.
DSCR
20% down · 8.5% · 30yr
- Down + closing
- —
- Monthly P&I
- —
- Monthly cashflow
- —
- DSCR
- —
- Eligible?
- —
No personal income docs; deal must DSCR.
Hard money
10% down · 12.0% · 12mo
- Down + closing
- —
- Monthly P&I
- —
- Monthly cashflow
- —
- DSCR
- —
- Eligible?
- —
Short-term bridge; refi at stabilization.
Rent comps 2 comps
| Address | Beds | Baths | Sqft | Rent | $/sqft | DOM | Units | Dist |
|---|---|---|---|---|---|---|---|---|
| 340 Virginia Ave Unit 3 Butler, PA | 3.0 | 1.0 | 3792 | $899 | $0.24 | 10d | 1 | 1.28mi |
| 414 S Washington St Butler, PA | 3.0 | 1.0 | 3000 | $1,672 | $0.56 | 12d | 1 | 1.43mi |
Listing history 15 events
-
2026-06-18days on market $270,000 Active 171 DOM
-
2026-06-17days on market $270,000 Active 170 DOM
-
2026-06-16days on market $270,000 Active 169 DOM
-
2026-06-15days on market $270,000 Active 168 DOM
-
2026-06-13days on market $270,000 Active 166 DOM
-
2026-06-13days on market $270,000 Active 165 DOM
-
2026-06-09days on market $270,000 Active 162 DOM
-
2026-06-08days on market $270,000 Active 161 DOM
-
2026-06-07days on market $270,000 Active 160 DOM
-
2026-06-03days on market $270,000 Active 156 DOM
-
2026-06-02days on market $270,000 Active 155 DOM
-
2026-06-01days on market $270,000 Active 154 DOM
-
2026-05-31days on market $270,000 Active 153 DOM
-
2026-03-18price $270,000 436-char remark
Show marketing remark (436 chars)
623 Bessemer Ave. is a fully occupied 5-Unit Property located in Lyndora. The property is 100% occupied and consistently leased, generating $8790.00 in quarterly rental income, or $35,160.00 annually. With a strong and reliable income stream, the 5-unit produces an approximate Net Operating Income (NOI) of $31,615.24 per year. Its central location and stable tenancy make this a solid investment opportunity with dependable cash flow.
-
2025-12-28$300,000 Active 436-char remark
Show marketing remark (436 chars)
623 Bessemer Ave. is a fully occupied 5-Unit Property located in Lyndora. The property is 100% occupied and consistently leased, generating $8790.00 in quarterly rental income, or $35,160.00 annually. With a strong and reliable income stream, the 5-unit produces an approximate Net Operating Income (NOI) of $31,615.24 per year. Its central location and stable tenancy make this a solid investment opportunity with dependable cash flow.
ⓘ Source: listings_history table (triggers on properties + properties_extension) + one-shot
backfill from property_details.listing_events for pre-trigger history.
Tax reassessment forecast PA · Partial reset (capped growth)
- Current annual tax
- $1,585 · $132/mo
- Projected year-2 tax
- $2,925 · $244/mo
- Expected delta
- +$1,341/yr (+$112/mo · 84.6%)
ⓘ Screening estimate from a state-policy table — verify with the county assessor before closing.
Climate risk First Street
- Flood 1/10 Low FEMA zone X (unshaded) · 0% chance over 30 yrs
- Wildfire 1/10 Low
- Heat 3/10 Moderate 7 d/yr ≥94°F today · 18 d/yr by 30 yrs out
- Wind 1/10 Low 0% chance of damaging wind over 30 yrs
- Air quality 3/10 Moderate 3 unhealthy d/yr today · 5 by 30 yrs out
Nearby sold comps map
Loading sold comps map…
Walkable amenities ~0.75 mi
Loading nearby amenities…
Taxation est. · year 1
- Rental income
- $52,428
- − Mortgage interest
- −$15,124
- − Property taxes
- −$1,585
- − Insurance
- −$1,350
- − Repairs & maintenance
- −$4,194
- − Management
- −$4,194
- − Depreciation
- −$7,855
- Taxable income
- $18,126
- Est. tax owed @ 24.0%
- −$4,350
- After-tax cash flow
- $17,142/yr
For passive investors: Depreciation is non-cash, so a rental often shows a tax loss while cash-flowing — sheltering income. Rental losses are passive: they offset passive income freely, and up to $25,000/yr can offset ordinary (W-2) income if you actively participate and your MAGI is under $100k (phasing out to $0 by $150k); unused losses carry forward. On sale, claimed depreciation is recaptured at up to 25%, and gains may owe capital-gains tax (a 1031 exchange can defer both). Figures are a year-1 estimate at your 24.0% rate — not tax advice; consult a CPA.
Schools (NCES district)
- District
- Butler Area SD
- NCES district ID
- 4204590
- Math proficiency
- 41% ▼ -11.00%
- Reading proficiency
- 59% ▼ -10.00%
- Median HH income
- $49,348
- Composite
- 42.65/100
- National rank
- #3180
- State rank
- #181 of 539 in PA
Livability — Butler
- Score
- 71/100
- State rank
- #705
- US rank
- #6951
Category grades
Schools grade is shown separately in the Schools card above.
Census & demographics
- Census place
- Homeacre-Lyndora, PA
- City population
- 39,234
- Population (ZIP)
- 1,109
Population outlook (Butler County) Hauer SSP2
- Today (2025)
- 190,777 people
- By 2030
- 191,476 · +0.4%
- By 2040
- 189,474 · -0.7%
- By 2050
- 182,050 · -4.6%
- By 2075
- 159,526 · -16.4%
- By 2100
- 129,028 · -32.4%
Race, ethnicity, and origin ACS 2023
- Neighborhood character
- Predominantly White (95%)
- Race & ethnicity
- White 95% Black 4% Two or more races 1%
- Common ancestry
- Romanian 25% Lithuanian 10% Italian 4%
Political lean MEDSL · Butler
- 2024 margin
- Solid R (+32.2) · D 33.5% · R 65.7%
- 2008→2024 swing
- -4.8pp toward R · 2008: -27.4pp · 2024: -32.2pp
- All cycles
- 2024: R+32.2 2020: R+32.5 2016: R+37.5 2012: R+34.9 2008: R+27.4
Not yet ingested
- Civics
- —
Market trends
- HPI YoY
- ▲ 2.12%
- Current HPI
- 108.3087
- Rent YoY
- —
- Metro
- —
- State GDP YoY
- ▲ 1.68%
- F500 in state
- 34
Industry mix (Fortune 500 HQ in PA)
| Industry | F500 HQs | Revenue |
|---|---|---|
| Healthcare | 2 | $309B |
|
||
| Insurance | 2 | $27B |
|
||
| Telecommunications / Media | 1 | $124B |
|
||
| Industrial Distribution | 1 | $22B |
|
||
| Financial Services | 1 | $20B |
|
||
| Chemicals / Materials | 1 | $18B |
|
||
Price history
-10.0% since first listed2 events — show timeline
- 2026-03-18 Price Changed $270,000 West Penn MLS
- 2025-12-28 Listed $300,000 West Penn MLS
Property tax history
+1.3%/yrLatest (2026): $1,585 · +0.0% YoY. Source: county tax records.
Cash-flow waterfall
monthlySold comps — $/sqft
last 12 mo · ≤1 miLoading sold comps…