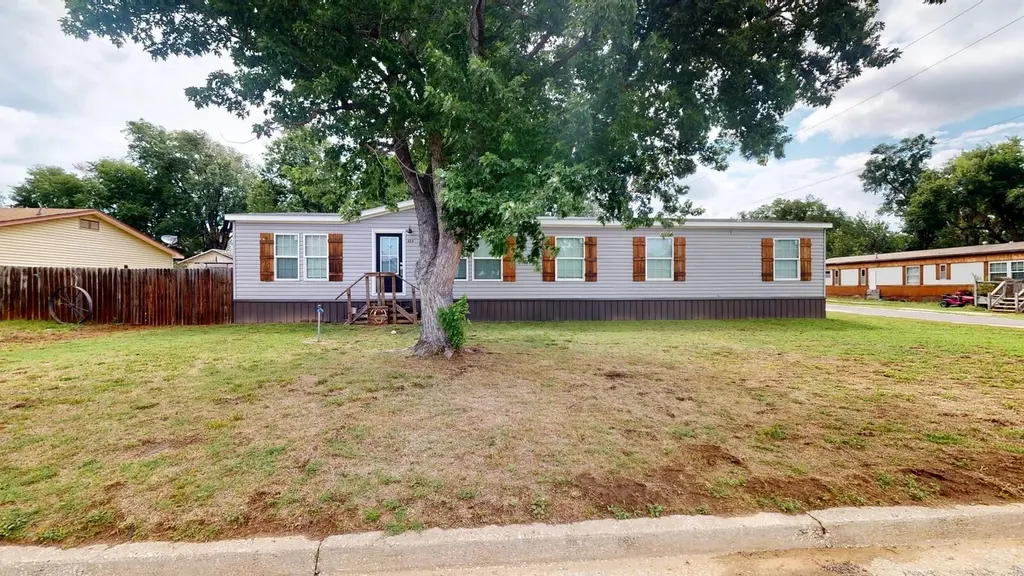
424 S Hill St · Mooreland, OK
Flood risk 8/10 · Major
- FEMA flood zone
- A
- Chance of flooding over 30 yrs
- 0.99%
- Est. flood insurance / yr
- $864 – $2,020
Fire risk 3/10 · Minor
- Est. fire insurance / yr
- $2,463 – $4,575
Heat risk 5/10 · Moderate
- Hot days now (above threshold)
- 7 days/yr
- Hot days in 30 yrs
- 18 days/yr
Wind risk No data
- Chance of severe wind over 30 yrs
- —
Air-quality risk No data
- Unhealthy air days now
- —
- Unhealthy air days in 30 yrs
- —
Risk factors via First Street. Map © Google.
Why this score? — see what drove the C- grade
The composite is a weighted blend of 9 inputs, each scored 0–100. Each bar is that input's sub-score; the figure is the points it added to the 100-point composite (weight × sub-score).
- Cash flow +19.1/30.0
- ARV discount +7.5/15.0
- Appreciation +6.9/10.0
- DSCR +6.0/10.0
- 1% rule +4.6/10.0
- Livability +3.4/5.0
- Rent growth +2.5/5.0
- Condition / age +2.5/5.0
- Schools +2.2/10.0
$140,000
🖨 Deal sheet 📄 Offer letter ✓ Due diligence
Listing remarks MLS
(1TM) Fire destroyed the garage and much of the East side of house. Smoke damage throughout dwelling. 1 time list & Sell. FOR STATISTICAL PURPOSES ONLY.
Key facts
- Large corner lot
- Large backyard
- Privacy fence
Tags
Property features AI
Finance
- Other: Located in the Collier's Add subdivision
Exterior
- Utilities: Public water; Public sewer
- Home design: Residential mobile home; Single-story; Mobile home on real property
- Construction: Wood siding construction
- Exterior features: Composition roof; Corner lot
Interior
- Bedrooms: Single-story home
- Bathrooms: 2 full bathrooms
- Heating & cooling: Central air; Electric central heat
- Interior features: Central air conditioning; Electric central heating
Neighborhood map
What this means for you Summary
Snapshot
- This is a 3-bed/2.0-bath manufactured listed at $140k.
Deal economics
- At list price, monthly cash flow is $29 ($345/yr) — positive.
- The deal already cash-flows at list — no discount required.
- To meet the 1% rule (rent ≥ 1% of price), the offer needs to be $134k (4.5% below list).
- Recommended offer: $134k (4.5% below list) — sets the bar for 1% rule.
Location & tenants
- Location reads 67/100 on livability (#85 in OK) — a middle-class / working-renter tenant base. Strengths: crime A+, cost of living A+, housing A+; Watch: health & safety C-, employment D+, schools F.
- Mooreland (rural): math 20% / reading 29% proficiency, ranked #103 of 270 in OK (top 38%) — low school quality limits family demand, transient renter base, plan for 1-2y turnover.
- Market conditions: 8 active listings in the ZIP; 2 units permitted in Woodward County in 2024 (0 in 5+ unit buildings).
Forward outlook
- In year one you build about $6k of equity ($968 loan paydown + $5k appreciation (3.8% local appreciation)).
- Woodward County population projected at +39% by 2050 — long-run rental-demand tailwind backs the buy-and-hold thesis.
- At projected returns (3.8% appreciation + 3.0% rent growth), your $39k cash investment doubles in ~6 years — after that, you're playing with house money.
- By year 6, paydown + projected appreciation supports a ~$33k cash-out refi (75% LTV) — recoverable capital for the next deal without selling this one.
Negotiation context
- Only 13 days on market — expect competitive offers; lowballing is unlikely to land.
- 5 sale attempts since 13y ago with the ask held roughly flat each time — persistent listings suggest the price (not the market) is what's stuck; bring a comps-based counter.
- Current owner paid $5k; list at $140k implies a 2700% gain — meaningful room to come down on a strong offer.
Risks & watch-outs
- Watch-outs: flood insurance adds $120/mo.
- Climate carrying-cost: in FEMA flood zone A (mandatory federal flood insurance); extreme-heat days projected 7→18/yr by 2055 (HVAC capex compounding) — expect insurance premiums to compound above CPI over the hold.
Questions for the listing agent
- What's the actual annual flood-insurance premium (NFIP or private), and is the property in a SFHA with mandatory coverage?
- Is there a deadline driving the sale (1031 exchange, divorce, estate, relocation)? That informs how much negotiation room exists.
- Schools are F-rated, which usually means shorter tenancies and higher turnover. Who's the typical renter profile here, and what's been the actual vacancy rate?
- What's the average days-on-market for RENTAL listings here right now (not sales)? A rising rental-DOM trend means longer vacancies and softer asking-rent achievability than the comps imply.
- What's the recent tenant-quality profile in this submarket — average credit score on applications, eviction rate, late-payment / NSF rate, and stable-employment percentage? A property-management company in the area should have these aggregated.
- How much new for-sale + rental construction is in the pipeline within 1–3 miles? Heavy new supply typically softens prices + rents 12–24 months out; constrained supply supports both.
Investment metrics
- 1% rule
- 0.96% ✗
- Cap rate
- 7.57%
- Cash-on-cash
- 4.56%
- DSCR
- 1.20
- GRM
- 8.7
CMA / ARV
No comps found within radius.
Projected returns pro-forma
3.77% appreciation · 3.0% rent growth · sell at horizon
- IRR
- 10.5%
- Equity multiple
- 1.63×
- Total profit
- $24,578
- Equity at exit
- $69,148
- IRR
- 12.4%
- Equity multiple
- 2.99×
- Total profit
- $78,057
- Equity at exit
- $111,657
Cash invested: $39,200 (down + closing). Projections, not guarantees.
Landlord ↔ Tenant lean methodology
- Overall (STATE)
- 83 Strongly Landlord-Friendly
- State Oklahoma
- 83 Strongly Landlord-Friendly · R+20
- County
- — inherits STATE
- City
- — inherits STATE
ZIP-level market 73852
- Home prices YoY
- 1.7%
- Active inventory
- 8
- Price-to-rent
- 8.7×
Monthly cashflow live
- Estimated rent
- $1,337 medium interval (Pro) →
- Mortgage (P&I)
- −$734
- Tax from tax record
- −$115 /mo · $1,382/yr
- Insurance
- −$58
- Flood insurance flood zone
- −$120 /mo · $1,442/yr
- HOA
- −$0
- Vacancy / Maint / Mgmt
- −$281
- Net cashflow
- $29
Break-even live
UW: 25.0% down · 7.5% · 30yr · 1.5% tax · 5.0% vac · 8.0% maint · 8.0% mgmt
Financing live
Cash to close
- Down payment
- $35,000
- Closing costs
- $4,200
- Reserves months
- —
- Total cash needed
- —
Loan-product check · same deal, 3 products live
Conventional
25% down · 7.5% · 30yr
- Down + closing
- —
- Monthly P&I
- —
- Monthly cashflow
- —
- DSCR
- —
- Eligible?
- —
Personal DTI + credit; lowest rate.
DSCR
20% down · 8.5% · 30yr
- Down + closing
- —
- Monthly P&I
- —
- Monthly cashflow
- —
- DSCR
- —
- Eligible?
- —
No personal income docs; deal must DSCR.
Hard money
10% down · 12.0% · 12mo
- Down + closing
- —
- Monthly P&I
- —
- Monthly cashflow
- —
- DSCR
- —
- Eligible?
- —
Short-term bridge; refi at stabilization.
Listing history 10 events
-
2026-06-18days on market $140,000 Active 13 DOM
-
2026-06-17days on market $140,000 Active 12 DOM
-
2026-06-16days on market $140,000 Active 11 DOM
-
2026-06-15days on market $140,000 Active 10 DOM
-
2026-06-13days on market $140,000 Active 8 DOM
-
2026-06-12days on market $140,000 Active 7 DOM
-
2026-06-09days on market $140,000 Active 4 DOM
-
2026-06-08days on market $140,000 Active 3 DOM
-
2026-06-08remarks 455-char remark
-
2026-06-08$140,000 Active 2 DOM
ⓘ Source: listings_history table (triggers on properties + properties_extension) + one-shot
backfill from property_details.listing_events for pre-trigger history.
Tax reassessment forecast OK · Resets to sale price
- Current annual tax
- $1,382 · $115/mo
- Projected year-2 tax
- $1,382 · $115/mo
- Expected delta
- $0/yr ($0/mo · 0.0%)
ⓘ Screening estimate from a state-policy table — verify with the county assessor before closing.
Climate risk First Street
- Flood 8/10 Severe FEMA zone A · 99% chance over 30 yrs
- Wildfire 3/10 Moderate
- Heat 5/10 Major
Nearby sold comps map
Loading sold comps map…
Walkable amenities ~0.75 mi
Loading nearby amenities…
Taxation est. · year 1
- Rental income
- $16,049
- − Mortgage interest
- −$7,842
- − Property taxes
- −$1,382
- − Insurance
- −$2,142
- − Repairs & maintenance
- −$1,284
- − Management
- −$1,284
- − Depreciation
- −$4,073
- Taxable loss
- −$1,958
- Est. tax savings @ 24.0%
- +$470
- After-tax cash flow
- $815/yr
For passive investors: Depreciation is non-cash, so a rental often shows a tax loss while cash-flowing — sheltering income. Rental losses are passive: they offset passive income freely, and up to $25,000/yr can offset ordinary (W-2) income if you actively participate and your MAGI is under $100k (phasing out to $0 by $150k); unused losses carry forward. On sale, claimed depreciation is recaptured at up to 25%, and gains may owe capital-gains tax (a 1031 exchange can defer both). Figures are a year-1 estimate at your 24.0% rate — not tax advice; consult a CPA.
Schools (NCES district)
- District
- Mooreland
- NCES district ID
- 4020280
- Math proficiency
- 20% ▼ -11.00%
- Reading proficiency
- 29% ▼ -5.00%
- Median HH income
- $51,605
- Composite
- 21.77/100
- National rank
- #8254
- State rank
- #103 of 270 in OK
Livability — Mooreland
- Score
- 67/100
- State rank
- #85
- US rank
- #10554
Category grades
Schools grade is shown separately in the Schools card above.
Census & demographics
- Census place
- Mooreland, OK
- Population (ZIP)
- 2,509
Population outlook (Woodward County) Hauer SSP2
- Today (2025)
- 24,787 people
- By 2030
- 26,517 · +7.0%
- By 2040
- 30,299 · +22.2%
- By 2050
- 34,449 · +39.0%
- By 2075
- 46,083 · +85.9%
- By 2100
- 54,639 · +120.4%
Race, ethnicity, and origin ACS 2023
- Neighborhood character
- Predominantly White (86%)
- Race & ethnicity
- White 86% Hispanic / Latino 11% Two or more races 5%
- Hispanic origin (detail)
- Mexican 9%
- Common ancestry
- Lithuanian 2% Portuguese 1% Serbian 1%
- Foreign-born
- 3% · Canada
- Languages at home
- 91% English-only · Spanish 7% German/W. Germanic 1% Other Indo-European 1%
Political lean MEDSL · Woodward
- 2024 margin
- Solid R (+72.0) · D 13.2% · R 85.2% · Other 1.6%
- 2008→2024 swing
- -6.8pp toward R · 2008: -65.2pp · 2024: -72.0pp
- All cycles
- 2024: R+72.0 2020: R+72.0 2016: R+72.1 2012: R+68.0 2008: R+65.2
Not yet ingested
- Civics
- —
Market trends
- HPI YoY
- ▲ 3.77%
- Current HPI
- 220.5065
- Rent YoY
- —
- Metro
- —
- State GDP YoY
- ▲ 1.55%
- F500 in state
- 6
Industry mix (Fortune 500 HQ in OK)
| Industry | F500 HQs | Revenue |
|---|---|---|
| Energy | 3 | $48B |
|
||
Price history
+64.7% since first listed12 events — show timeline
- 2026-06-05 Listed $140,000 NWOAR
- 2020-10-01 Sold (MLS) $5,000 NWOAR
- 2020-08-21 Listed $5,000 NWOAR
- 2018-09-30 Sold (MLS) $88,000 NWOAR
- 2018-09-28 Sold (Public Records) $88,000 Public Records
- 2018-07-31 Listed $95,000 NWOAR
- 2014-08-25 Sold (Public Records) $85,000 Public Records
- 2014-08-22 Sold (MLS) $85,000 NWOAR
- 2014-06-22 Listed $89,000 NWOAR
- 2013-05-03 Sold (Public Records) $77,500 Public Records
- 2013-05-02 Sold (MLS) $77,500 NWOAR
- 2013-03-21 Listed $85,000 NWOAR
Property tax history
+7.5%/yrLatest (2025): $1,382 · +2.2% YoY. Source: county tax records.
Cash-flow waterfall
monthlySold comps — $/sqft
last 12 mo · ≤1 miLoading sold comps…