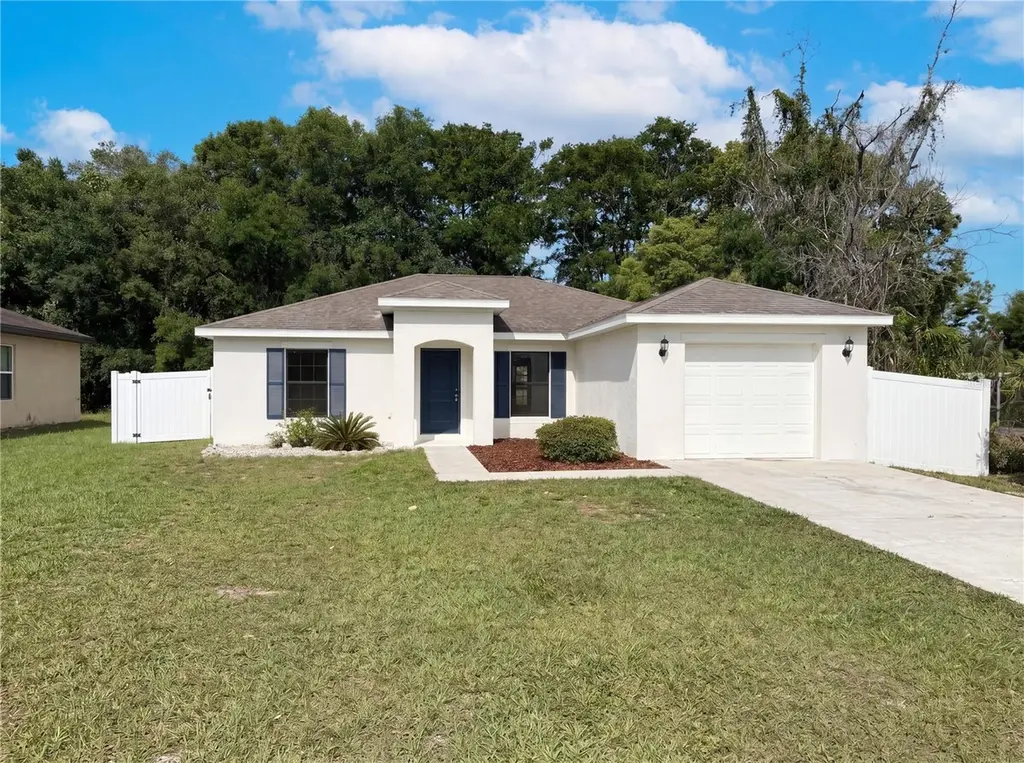
6399 Raley Rd · Hill 'n Dale, FL
Flood risk 1/10 · Minimal
- FEMA flood zone
- X (unshaded)
- Chance of flooding over 30 yrs
- 0.0%
- Est. flood insurance / yr
- $507 – $1,088
Fire risk 6/10 · Moderate
- Est. fire insurance / yr
- $947 – $1,759
Heat risk 9/10 · Severe
- Hot days now (above 108°F)
- 7 days/yr
- Hot days in 30 yrs
- 25 days/yr
Wind risk 9/10 · Severe
- Chance of severe wind over 30 yrs
- 99.0%
Air-quality risk 1/10 · Minimal
- Unhealthy air days now
- 0 days/yr
- Unhealthy air days in 30 yrs
- 0 days/yr
Risk factors via First Street. Map © Google.
Why this score? — see what drove the D- grade
The composite is a weighted blend of 9 inputs, each scored 0–100. Each bar is that input's sub-score; the figure is the points it added to the 100-point composite (weight × sub-score).
- Cash flow +14.0/30.0
- DSCR +4.3/10.0
- Schools +4.2/10.0
- 1% rule +4.0/10.0
- ARV discount +3.4/15.0
- Rent growth +2.5/5.0
- Livability +2.5/5.0
- Condition / age +2.5/5.0
- Appreciation +0.0/10.0
$242,000
🖨 Deal sheet (PDF) 📄 Offer letter ✓ Due diligence
Listing remarks MLS
The stunning Palm by LGI Homes is located within the family-friendly community of Hill ‘N Dale. This new, one-story home features an open floor plan, 3 bedrooms and 2 full baths complete with over $10,000 in upgrades including energy-efficient appliances, spacious kitchen countertops, beautiful wood cabinets, brushed nickel hardware and an attached garage. The Palm consists of a master suite complete with a spacious walk-in closet, as well as a utility room and front yard landscaping. In addition, Hill ‘N Dale offers residents numerous amenities including a playground, a basketball court, a multipurpose sports field, a gazebo and a covered picnic area.
Key facts
- Bright open layout
- Spacious pantry
- Bar-top seating
Tags
Neighborhood map
What this means for you Summary
Snapshot
- This is a 3-bed/2.0-bath single-family listed at $242k.
Deal economics
- At list price, monthly cash flow is $32 ($387/yr) — positive.
- The deal already cash-flows at list — no discount required.
- To meet the 1% rule (rent ≥ 1% of price), the offer needs to be $218k (9.8% below list).
- Recommended offer: $218k (9.8% below list) — sets the bar for 1% rule.
- Cap rate 6.5% vs local median 5.3% in Hill 'n Dale — meaningfully above typical; check what's discounted (condition, days-on-market, listing class) to confirm the premium yield is real.
Location & tenants
- Location reads: area grade D — affects rentability + tenant quality, not the cash-flow math above.
- Hernando (suburban): math 50% / reading 50% proficiency, ranked #38 of 73 in FL (top 52%) — acceptable for families but not a draw, mixed tenant base, ~2y average lease.
- Zoned schools: Eastside Elementary School (math 37% / reading 32%, grade F, #1,709 of 2,144 statewide, top 81%, 737 students, 73% FRL); D. S. Parrott Middle School (math 40% / reading 40%, grade F, #368 of 571 statewide, top 65%, 835 students, 67% FRL); Hernando High School (math 42% / reading 42%, grade F, #275 of 667 statewide, top 42%, 1,299 students, 58% FRL).
- Market conditions: 187 active listings in the ZIP; 4 comparable units currently listed for rent nearby; rentals at typical pace (median 26d on market — plan ~3-4 weeks tenant-placement turnaround); 2,505 units permitted in Hernando County in 2024 (318 in 5+ unit buildings).
Forward outlook
- Local home prices are declining (-3.0%/yr); year-one equity from $2k of loan paydown is wiped out by about $7k of value loss. Plan a longer hold.
- Hernando County population projected at +11% by 2050 — modest demand growth; plan on rents tracking national, not racing it.
Negotiation context
- Only 9 days on market — expect competitive offers; lowballing is unlikely to land.
- 3 sale attempts since 16y ago with the ask held roughly flat each time — persistent listings suggest the price (not the market) is what's stuck; bring a comps-based counter.
Risks & watch-outs
- Climate carrying-cost: severe wind risk, 99% chance of damaging wind over 30y; major wildfire risk; extreme-heat days projected 7→25/yr by 2055 (HVAC capex compounding) — expect insurance premiums to compound above CPI over the hold.
Questions for the listing agent
- Is there a deadline driving the sale (1031 exchange, divorce, estate, relocation)? That informs how much negotiation room exists.
- The area grade is low — what's the realistic commute time and amenity access for the typical tenant pool here? Any planned neighborhood developments (good or bad) we should know about?
- What's the average days-on-market for RENTAL listings here right now (not sales)? A rising rental-DOM trend means longer vacancies and softer asking-rent achievability than the comps imply.
- What's the recent tenant-quality profile in this submarket — average credit score on applications, eviction rate, late-payment / NSF rate, and stable-employment percentage? A property-management company in the area should have these aggregated.
- How much new for-sale + rental construction is in the pipeline within 1–3 miles? Heavy new supply typically softens prices + rents 12–24 months out; constrained supply supports both.
Investment metrics
- 1% rule
- 0.90% ✗
- Cap rate
- 6.45%
- Cash-on-cash
- 0.57%
- DSCR
- 1.03
- GRM
- 9.2
CMA / ARV
- ARV (on-the-fly)
- $221,879
- Comps found
- 12
Show comp detail 12 sales within ~0.75 mi
| Address | Dist | Beds/Ba | Sqft | Sold | Price | $/sf | Match |
|---|---|---|---|---|---|---|---|
| 6399 Raley Rd | 0.00mi | 3/2.0 | 1,091 (-0%) | 1mo | $237,000 | $217 | 99 |
| 26412 MC Allister St | 0.06mi | 3/2.0 | 1,093 (0%) | 3mo | $250,000 | $229 | 94 |
| 27009 Anthony Ave | 0.12mi | 3/2.0 | 1,093 (0%) | 4mo | $239,999 | $220 | 91 |
| 26359 Eahnestock St | 0.34mi | 3/2.0 | 1,091 (-0%) | 0mo | $210,000 | $192 | 84 |
| 26411 Bertram Rd | 0.05mi | 2/2.0 (-1) | 1,000 (-8%) | 8mo | $155,000 | $155 | 72 |
| 27119 Simona Ave | 0.36mi | 3/1.0 | 1,107 (+1%) | 9mo | $225,000 | $203 | 70 |
| 27083 Roper Rd | 0.29mi | 3/1.5 | 1,000 (-8%) | 4mo | $190,000 | $190 | 67 |
| 27176 Wakefield Dr | 0.49mi | 3/1.0 | 1,141 (+4%) | 2mo | $208,000 | $182 | 64 |
| 27168 Fernery Ave | 0.47mi | 3/2.0 | 1,000 (-8%) | 1mo | $190,000 | $190 | 63 |
| 27200 Fernery Ave | 0.53mi | 3/1.5 | 1,000 (-8%) | 3mo | $212,000 | $212 | 56 |
| 26369 Eahnestock St | 0.33mi | 3/2.0 | 1,236 (+13%) | 8mo | $252,500 | $204 | 56 |
| 6155 Sumter Dr | 0.58mi | 2/1.0 (-1) | 1,042 (-5%) | 1mo | $127,000 | $122 | 55 |
Match score weights: distance 35% · size 25% · config 20% · recency 20%. Top-matched comps best support the ARV.
Projected returns pro-forma
-3.0% appreciation · 3.0% rent growth · sell at horizon
- IRR
- -15.4%
- Equity multiple
- 0.45×
- Total profit
- $-37,115
- Equity at exit
- $36,083
- IRR
- -6.8%
- Equity multiple
- 0.56×
- Total profit
- $-29,491
- Equity at exit
- $20,924
Cash invested: $67,760 (down + closing). Projections, not guarantees.
Landlord ↔ Tenant lean methodology
- Overall (STATE)
- 87 Strongly Landlord-Friendly
- State Florida
- 87 Strongly Landlord-Friendly · R+3
- County
- — inherits STATE
- City
- — inherits STATE
ZIP-level market 34602
- Home prices YoY
- -21.1%
- Active inventory
- 187
- Price-to-rent
- 9.2×
Monthly cashflow live
- Estimated rent
- $2,183 medium interval (Pro) →
- Mortgage (P&I)
- −$1,269
- Tax from tax record
- −$323 /mo · $3,870/yr
- Insurance
- −$101
- HOA
- −$0
- Vacancy / Maint / Mgmt
- −$458
- Net cashflow
- $32
Break-even live
Sensitivity live
| Price | -10% $169 | -5% $101 | +0% $32 | +5% $-36 | +10% $-105 |
|---|---|---|---|---|---|
| Rent | -10% $-140 | -5% $-54 | +0% $32 | +5% $118 | +10% $205 |
| Rate | -1.0pp $154 | -0.5pp $94 | base $32 | +0.5pp $-30 | +1.0pp $-94 |
UW: 25.0% down · 7.5% · 30yr · 1.5% tax · 5.0% vac · 8.0% maint · 8.0% mgmt
Financing live
Cash to close
- Down payment
- $60,500
- Closing costs
- $7,260
- Reserves months
- —
- Total cash needed
- —
Loan-product check · same deal, 3 products live
Conventional
25% down · 7.5% · 30yr
- Down + closing
- —
- Monthly P&I
- —
- Monthly cashflow
- —
- DSCR
- —
- Eligible?
- —
Personal DTI + credit; lowest rate.
DSCR
20% down · 8.5% · 30yr
- Down + closing
- —
- Monthly P&I
- —
- Monthly cashflow
- —
- DSCR
- —
- Eligible?
- —
No personal income docs; deal must DSCR.
Hard money
10% down · 12.0% · 12mo
- Down + closing
- —
- Monthly P&I
- —
- Monthly cashflow
- —
- DSCR
- —
- Eligible?
- —
Short-term bridge; refi at stabilization.
Rent comps 4 comps
| Address | Beds | Baths | Sqft | Rent | $/sqft | DOM | Units | Dist |
|---|---|---|---|---|---|---|---|---|
| 27008 Anthony Ave Brooksville, FL | 3.0 | 2.0 | 1043 | $1,795 | $1.72 | 26d | 1 | 0.14mi |
| 6367 Enterprise Dr Unit 1234457P Brooksville, FL | 3.0 | 2.0 | 1119 | $3,367 | $3.01 | 1d | 1 | 0.22mi |
| 27108 Simona Ave Brooksville, FL | 3.0 | 1.0 | 1092 | $1,700 | $1.56 | 26d | 1 | 0.35mi |
| 27103 Frampton Ave Brooksville, FL | 2.0 | 2.0 | 1176 | $1,700 | $1.45 | 26d | 1 | 0.37mi |
Listing history 14 events
-
2026-04-24status Pending
-
2026-04-15$242,000 Active
-
2026-04-06soldstatus $222,571
-
2019-02-08soldstatus $165,900 672-char remark
Show marketing remark (672 chars)
The stunning Palm by LGI Homes is located within the family-friendly community of Hill ‘N Dale. This new, one-story home features an open floor plan, 3 bedrooms and 2 full baths complete with over $10,000 in upgrades including energy-efficient appliances, spacious kitchen countertops, beautiful wood cabinets, brushed nickel hardware and an attached garage. The Palm consists of a master suite complete with a spacious walk-in closet, as well as a utility room and front yard landscaping. In addition, Hill ‘N Dale offers residents numerous amenities including a playground, a basketball court, a multipurpose sports field, a gazebo and a covered picnic area.
-
2018-11-09$166,900 672-char remark
Show marketing remark (672 chars)
The stunning Palm by LGI Homes is located within the family-friendly community of Hill ‘N Dale. This new, one-story home features an open floor plan, 3 bedrooms and 2 full baths complete with over $10,000 in upgrades including energy-efficient appliances, spacious kitchen countertops, beautiful wood cabinets, brushed nickel hardware and an attached garage. The Palm consists of a master suite complete with a spacious walk-in closet, as well as a utility room and front yard landscaping. In addition, Hill ‘N Dale offers residents numerous amenities including a playground, a basketball court, a multipurpose sports field, a gazebo and a covered picnic area.
-
2017-11-03soldstatus $309,000
-
2017-09-28soldstatus $21,300
-
2017-02-17soldstatus $12,500
-
2010-11-16soldstatus $4,500
-
2010-10-07historical
-
2010-04-09$5,000
-
2005-12-29soldstatus $106,700
-
2000-08-24soldstatus $374,000
-
1996-07-15soldstatus $438,200
ⓘ Source: listings_history table (triggers on properties + properties_extension) + one-shot
backfill from property_details.listing_events for pre-trigger history.
Tax reassessment forecast FL · Resets to sale price
- Current annual tax
- $3,870 · $323/mo
- Projected year-2 tax
- $3,870 · $323/mo
- Expected delta
- $0/yr ($0/mo · -0.0%)
ⓘ Screening estimate from a state-policy table — verify with the county assessor before closing.
Climate risk First Street
- Flood 1/10 Low FEMA zone X (unshaded) · 0% chance over 30 yrs
- Wildfire 6/10 Major
- Heat 9/10 Extreme 7 d/yr ≥108°F today · 25 d/yr by 30 yrs out
- Wind 9/10 Extreme 99% chance of damaging wind over 30 yrs
- Air quality 1/10 Low 0 unhealthy d/yr today · 0 by 30 yrs out
Nearby sold comps map
Loading sold comps map…
Walkable amenities ~0.75 mi
Loading nearby amenities…
Taxation est. · year 1
- Rental income
- $26,198
- − Mortgage interest
- −$13,556
- − Property taxes
- −$3,870
- − Insurance
- −$1,210
- − Repairs & maintenance
- −$2,096
- − Management
- −$2,096
- − Depreciation
- −$7,040
- Taxable loss
- −$3,670
- Est. tax savings @ 24.0%
- +$881
- After-tax cash flow
- $1,268/yr
For passive investors: Depreciation is non-cash, so a rental often shows a tax loss while cash-flowing — sheltering income. Rental losses are passive: they offset passive income freely, and up to $25,000/yr can offset ordinary (W-2) income if you actively participate and your MAGI is under $100k (phasing out to $0 by $150k); unused losses carry forward. On sale, claimed depreciation is recaptured at up to 25%, and gains may owe capital-gains tax (a 1031 exchange can defer both). Figures are a year-1 estimate at your 24.0% rate — not tax advice; consult a CPA.
Schools (NCES district)
- District
- Hernando
- NCES district ID
- 1200810
- Math proficiency
- 50% ▼ -8.00%
- Reading proficiency
- 50% ▼ -4.00%
- Median HH income
- $41,985
- Composite
- 42.03/100
- National rank
- #3329
- State rank
- #38 of 73 in FL
Livability — Hill 'n Dale
No livability data for this city. (Only ~50 U.S. cities are tracked.)
Census & demographics
- Census place
- Hill 'n Dale, FL
- Population (ZIP)
- 10,391
Population outlook (Hernando County) Hauer SSP2
- Today (2025)
- 189,218 people
- By 2030
- 194,367 · +2.7%
- By 2040
- 203,398 · +7.5%
- By 2050
- 209,589 · +10.8%
- By 2075
- 218,452 · +15.4%
- By 2100
- 205,923 · +8.8%
Race, ethnicity, and origin ACS 2023
- Neighborhood character
- Predominantly White (71%)
- Race & ethnicity
- White 71% Hispanic / Latino 14% Black 11% Two or more races 7%
- Hispanic origin (detail)
- Mexican 5% Puerto Rican 4% Cuban 2%
- Common ancestry
- Romanian 3% Lithuanian 2% Slovak 1%
- Foreign-born
- 5% · Canada, Dominican Republic, China
- Languages at home
- 90% English-only · Spanish 8%
Political lean MEDSL · Hernando
- 2024 margin
- Solid R (+37.0) · D 31.1% · R 68.2%
- 2008→2024 swing
- -33.5pp toward R · 2008: -3.6pp · 2024: -37.0pp
- All cycles
- 2024: R+37.0 2020: R+30.2 2016: R+29.0 2012: R+8.5 2008: R+3.6
Not yet ingested
- Civics
- —
Market trends
- HPI YoY
- ▼ -75.28%
- Current HPI
- 282.3728
- Rent YoY
- —
- Metro
- —
- State GDP YoY
- ▲ 3.28%
- F500 in state
- 36
Industry mix (Fortune 500 HQ in FL)
| Industry | F500 HQs | Revenue |
|---|---|---|
| Industrial Technology | 2 | $29B |
|
||
| Insurance | 2 | $17B |
|
||
| Retail | 1 | $60B |
|
||
| Technology Distribution | 1 | $58B |
|
||
| Homebuilding | 1 | $35B |
|
||
| Technology Manufacturing | 1 | $35B |
|
||
Price history
-44.8% since first listed14 events — show timeline
- 2026-04-24 Pending — Stellar MLS as Distributed by MLS Grid
- 2026-04-15 Listed $242,000 Stellar MLS as Distributed by MLS Grid
- 2026-04-06 Sold (Public Records) $222,571 Public Records
- 2019-02-08 Sold (MLS) $165,900 Stellar MLS as Distributed by MLS Grid
- 2018-11-09 Listed $166,900 Stellar MLS as Distributed by MLS Grid
- 2017-11-03 Sold (Public Records) $309,000 Public Records
- 2017-09-28 Sold (Public Records) $21,300 Public Records
- 2017-02-17 Sold (Public Records) $12,500 Public Records
- 2010-11-16 Sold (Public Records) $4,500 Public Records
- 2010-10-07 Listing Removed — HCAR
- 2010-04-09 Listed $5,000 HCAR
- 2005-12-29 Sold (Public Records) $106,700 Public Records
- 2000-08-24 Sold (Public Records) $374,000 Public Records
- 1996-07-15 Sold (Public Records) $438,200 Public Records
Property tax history
+33.5%/yrLatest (2025): $3,870 · +5.4% YoY. Source: county tax records.
Cash-flow waterfall
monthlySold comps — $/sqft
last 12 mo · ≤1 miLoading sold comps…