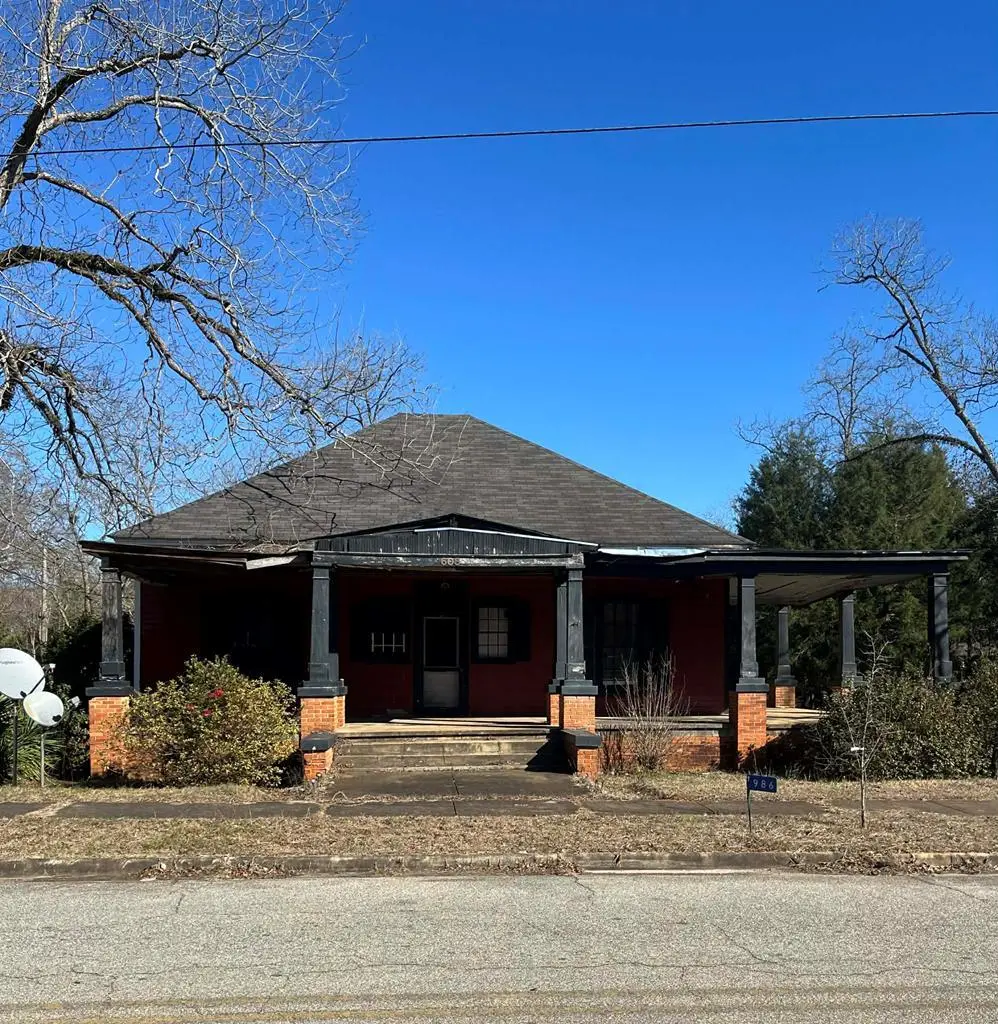
986 Alston St · Richland, GA
Flood risk 1/10 · Minimal
- FEMA flood zone
- X (unshaded)
- Chance of flooding over 30 yrs
- 0.0%
- Est. flood insurance / yr
- $507 – $1,088
Fire risk 5/10 · Moderate
- Est. fire insurance / yr
- $963 – $1,789
Heat risk 7/10 · Major
- Hot days now (above 107°F)
- 7 days/yr
- Hot days in 30 yrs
- 18 days/yr
Wind risk 8/10 · Major
- Chance of severe wind over 30 yrs
- 80.0%
Air-quality risk 2/10 · Minimal
- Unhealthy air days now
- 2 days/yr
- Unhealthy air days in 30 yrs
- 2 days/yr
Risk factors via First Street. Map © Google.
Why this score? — see what drove the C+ grade
The composite is a weighted blend of 9 inputs, each scored 0–100. Each bar is that input's sub-score; the figure is the points it added to the 100-point composite (weight × sub-score).
- Cash flow +28.8/30.0
- DSCR +10.0/10.0
- 1% rule +6.8/10.0
- Appreciation +5.0/10.0
- Livability +3.0/5.0
- Schools +2.7/10.0
- Rent growth +2.5/5.0
- Condition / age +2.5/5.0
- ARV discount +0.0/15.0
$119,900
🖨 Deal sheet (PDF) 📄 Offer letter ✓ Due diligence
Listing remarks MLS
Built in 1920, this charming corner lot bungalow boasts three spacious bedrooms, two full bathrooms, a bonus room, and a formal dining room. Nestled in the heart of Downtown Richland, just thirty minutes from Fort Benning, this historic home presents a rare chance for investors to transform a piece of the past into thriving present! Whether you envision a cozy retreat or a profitable resale, this property offers a unique blend of character and potential! Don't miss out, schedule a private showing with your Realtor today!
Key facts
- 0.48 acre lot
- Listed 130 days
Neighborhood map
What this means for you Summary
Snapshot
- This is a 3-bed/2.0-bath single-family listed at $120k.
Deal economics
- At list price, monthly cash flow is $402 ($5k/yr) — positive.
- The deal already cash-flows at list — no discount required.
- Meets the 1% rule at list price ($1k rent vs $120k).
- Recommended offer: $106k (12.0% below list) — sets the bar for market timing.
Location & tenants
- Location reads 59/100 on livability (#410 in GA) — a working-class tenant base; expect higher turnover. Strengths: cost of living A+, housing A+, crime A; Watch: schools F, amenities F, commute F.
- Stewart County (rural): math 35% / reading 26% proficiency, ranked #141 of 187 in GA (top 75%) — families likely to look elsewhere, expect single-tenant / working-renter base with shorter leases; 87% free/reduced lunch — lower-income household profile, screen leases tightly.
- Market conditions: 12 active listings in the ZIP; 2 units permitted in Stewart County in 2024 (0 in 5+ unit buildings).
Forward outlook
- In year one you build about $4k of equity ($829 loan paydown + $4k appreciation (3.0% local appreciation)).
- Stewart County population projected at +10% by 2050 — modest demand growth; plan on rents tracking national, not racing it.
- At projected returns (3.0% appreciation + 3.0% rent growth), your $34k cash investment doubles in ~4 years — after that, you're playing with house money.
- By year 8, paydown + projected appreciation supports a ~$33k cash-out refi (75% LTV) — recoverable capital for the next deal without selling this one.
Negotiation context
- It's been on market 130 days — a 12% lower offer ($106k) is reasonable based on typical stale-listing flexibility.
- 2 sale attempts since 14y ago with the ask held roughly flat each time — persistent listings suggest the price (not the market) is what's stuck; bring a comps-based counter.
- Current owner paid $16k; list at $120k implies a 642% gain — meaningful room to come down on a strong offer.
Risks & watch-outs
- Watch-outs: built in 1920 — expect roof / HVAC / electrical / plumbing capex.
- Climate carrying-cost: severe wind risk, 80% chance of damaging wind over 30y; moderate wildfire risk; extreme-heat days projected 7→18/yr by 2055 (HVAC capex compounding) — expect insurance premiums to compound above CPI over the hold.
Questions for the listing agent
- It's been on market 130 days. Have you received any prior offers? Is the seller open to a 12% concession, seller financing, or rate buy-down credit?
- Built in 1920 — when were the roof, HVAC, electrical panel, plumbing, and water heater last replaced?
- Why hasn't it sold? Are there any deal-killer items the seller is aware of (foundation, flood, title, zoning, code violations)?
- Is there a deadline driving the sale (1031 exchange, divorce, estate, relocation)? That informs how much negotiation room exists.
- Schools are F-rated, which usually means shorter tenancies and higher turnover. Who's the typical renter profile here, and what's been the actual vacancy rate?
- What's the average days-on-market for RENTAL listings here right now (not sales)? A rising rental-DOM trend means longer vacancies and softer asking-rent achievability than the comps imply.
- What's the recent tenant-quality profile in this submarket — average credit score on applications, eviction rate, late-payment / NSF rate, and stable-employment percentage? A property-management company in the area should have these aggregated.
- How much new for-sale + rental construction is in the pipeline within 1–3 miles? Heavy new supply typically softens prices + rents 12–24 months out; constrained supply supports both.
Investment metrics
- 1% rule
- 1.18% ✓
- Cap rate
- 10.31%
- Cash-on-cash
- 14.36%
- DSCR
- 1.64
- GRM
- 7.0
CMA / ARV
- ARV (median comp)
- $91,419
- List price
- $119,900
- Delta
- 31.15%
- Verdict
- OVERPRICED
- Comps
- 10 within 1.0 mi
Show comp detail 1 sale within ~0.75 mi
| Address | Dist | Beds/Ba | Sqft | Sold | Price | $/sf | Match |
|---|---|---|---|---|---|---|---|
| 309 Clements St | 0.37mi | 3/2.0 | 1,626 (-12%) | 20mo | $106,500 | $65 | 46 |
Match score weights: distance 35% · size 25% · config 20% · recency 20%. Top-matched comps best support the ARV.
Projected returns pro-forma
3.0% appreciation · 3.0% rent growth · sell at horizon
- IRR
- 21.0%
- Equity multiple
- 2.19×
- Total profit
- $39,993
- Equity at exit
- $53,912
- IRR
- 22.0%
- Equity multiple
- 4.17×
- Total profit
- $106,458
- Equity at exit
- $83,085
Cash invested: $33,572 (down + closing). Projections, not guarantees.
Landlord ↔ Tenant lean methodology
- Overall (STATE)
- 90 Strongly Landlord-Friendly
- State Georgia
- 90 Strongly Landlord-Friendly · R+3
- County
- — inherits STATE
- City
- — inherits STATE
ZIP-level market 31825
- Active inventory
- 12
- Price-to-rent
- 7.0×
Monthly cashflow live
- Estimated rent
- $1,421 medium interval (Pro) →
- Mortgage (P&I)
- −$629
- Tax from tax record
- −$42 /mo · $500/yr
- Insurance
- −$50
- HOA
- −$0
- Vacancy / Maint / Mgmt
- −$298
- Net cashflow
- $402
Break-even live
Sensitivity live
| Price | -10% $470 | -5% $436 | +0% $402 | +5% $368 | +10% $334 |
|---|---|---|---|---|---|
| Rent | -10% $290 | -5% $346 | +0% $402 | +5% $458 | +10% $514 |
| Rate | -1.0pp $462 | -0.5pp $432 | base $402 | +0.5pp $371 | +1.0pp $339 |
UW: 25.0% down · 7.5% · 30yr · 1.5% tax · 5.0% vac · 8.0% maint · 8.0% mgmt
Financing live
Cash to close
- Down payment
- $29,975
- Closing costs
- $3,597
- Reserves months
- —
- Total cash needed
- —
Loan-product check · same deal, 3 products live
Conventional
25% down · 7.5% · 30yr
- Down + closing
- —
- Monthly P&I
- —
- Monthly cashflow
- —
- DSCR
- —
- Eligible?
- —
Personal DTI + credit; lowest rate.
DSCR
20% down · 8.5% · 30yr
- Down + closing
- —
- Monthly P&I
- —
- Monthly cashflow
- —
- DSCR
- —
- Eligible?
- —
No personal income docs; deal must DSCR.
Hard money
10% down · 12.0% · 12mo
- Down + closing
- —
- Monthly P&I
- —
- Monthly cashflow
- —
- DSCR
- —
- Eligible?
- —
Short-term bridge; refi at stabilization.
Listing history 19 events
-
2026-06-18days on market $119,900 Active 130 DOM
-
2026-06-17days on market $119,900 Active 129 DOM
-
2026-06-16days on market $119,900 Active 128 DOM
-
2026-06-15days on market $119,900 Active 127 DOM
-
2026-06-14days on market $119,900 Active 125 DOM
-
2026-06-13days on market $119,900 Active 124 DOM
-
2026-06-10days on market $119,900 Active 122 DOM
-
2026-06-09days on market $119,900 Active 121 DOM
-
2026-06-08days on market $119,900 Active 120 DOM
-
2026-06-07days on market $119,900 Active 119 DOM
-
2026-06-02days on market $119,900 Active 114 DOM
-
2026-06-01days on market $119,900 Active 113 DOM
-
2026-05-31days on market $119,900 Active 112 DOM
-
2026-05-30days on market $119,900 Active 111 DOM
-
2026-02-08$119,900 Active 527-char remark
Show marketing remark (527 chars)
Built in 1920, this charming corner lot bungalow boasts three spacious bedrooms, two full bathrooms, a bonus room, and a formal dining room. Nestled in the heart of Downtown Richland, just thirty minutes from Fort Benning, this historic home presents a rare chance for investors to transform a piece of the past into thriving present! Whether you envision a cozy retreat or a profitable resale, this property offers a unique blend of character and potential! Don't miss out, schedule a private showing with your Realtor today!
-
2012-10-10soldstatus $16,168 144-char remark
Show marketing remark (144 chars)
BEAUTIFUL, HISTORIC 1920'S HOME OFFERS MANICURED LOT, CARPORT, WRAP AROUND PORCH, ORIGINAL HARDWOOD FLOORS. ACCESS TO FORT BENNING AND COLUMBUS!
-
2012-07-16$15,600 144-char remark
Show marketing remark (144 chars)
BEAUTIFUL, HISTORIC 1920'S HOME OFFERS MANICURED LOT, CARPORT, WRAP AROUND PORCH, ORIGINAL HARDWOOD FLOORS. ACCESS TO FORT BENNING AND COLUMBUS!
-
2006-05-01soldstatus $54,400
-
2003-11-06soldstatus $53,000
ⓘ Source: listings_history table (triggers on properties + properties_extension) + one-shot
backfill from property_details.listing_events for pre-trigger history.
Tax reassessment forecast GA · Resets to sale price
- Current annual tax
- $500 · $42/mo
- Projected year-2 tax
- $1,103 · $92/mo
- Expected delta
- +$603/yr (+$50/mo · 120.7%)
ⓘ Screening estimate from a state-policy table — verify with the county assessor before closing.
Climate risk First Street
- Flood 1/10 Low FEMA zone X (unshaded) · 0% chance over 30 yrs
- Wildfire 5/10 Major
- Heat 7/10 Severe 7 d/yr ≥107°F today · 18 d/yr by 30 yrs out
- Wind 8/10 Severe 80% chance of damaging wind over 30 yrs
- Air quality 2/10 Low 2 unhealthy d/yr today · 2 by 30 yrs out
Nearby sold comps map
Loading sold comps map…
Walkable amenities ~0.75 mi
Loading nearby amenities…
Taxation est. · year 1
- Rental income
- $17,046
- − Mortgage interest
- −$6,716
- − Property taxes
- −$500
- − Insurance
- −$600
- − Repairs & maintenance
- −$1,364
- − Management
- −$1,364
- − Depreciation
- −$3,488
- Taxable income
- $3,015
- Est. tax owed @ 24.0%
- −$724
- After-tax cash flow
- $4,098/yr
For passive investors: Depreciation is non-cash, so a rental often shows a tax loss while cash-flowing — sheltering income. Rental losses are passive: they offset passive income freely, and up to $25,000/yr can offset ordinary (W-2) income if you actively participate and your MAGI is under $100k (phasing out to $0 by $150k); unused losses carry forward. On sale, claimed depreciation is recaptured at up to 25%, and gains may owe capital-gains tax (a 1031 exchange can defer both). Figures are a year-1 estimate at your 24.0% rate — not tax advice; consult a CPA.
Schools (NCES district)
- District
- Stewart County
- NCES district ID
- 1304590
- Math proficiency
- 35% ▲ 9.00%
- Reading proficiency
- 26% ▲ 8.00%
- Median HH income
- $26,971
- Composite
- 27.25/100
- National rank
- #12434
- State rank
- #141 of 187 in GA
Livability — Richland
- Score
- 59/100
- State rank
- #410
- US rank
- #20252
Category grades
Schools grade is shown separately in the Schools card above.
Census & demographics
- Census place
- Richland, GA
- Population (ZIP)
- 2,733
Population outlook (Stewart County) Hauer SSP2
- Today (2025)
- 5,873 people
- By 2030
- 6,241 · +6.3%
- By 2040
- 6,569 · +11.9%
- By 2050
- 6,461 · +10.0%
- By 2075
- 5,819 · -0.9%
- By 2100
- 5,086 · -13.4%
Race, ethnicity, and origin ACS 2023
- Neighborhood character
- Diverse neighborhood (Simpson 0.56)
- Race & ethnicity
- Black 58% White 32% Two or more races 6% Hispanic / Latino 5%
- Hispanic origin (detail)
- Mexican 3% Cuban 2%
- Common ancestry
- Slovak 2% Italian 1%
- Foreign-born
- 3% · Canada
- Languages at home
- 94% English-only · Spanish 5% French/Haitian/Cajun 1%
Political lean MEDSL · Stewart
- 2024 margin
- D (+16.3) · D 58.0% · R 41.8%
- 2008→2024 swing
- -8.5pp toward R · 2008: 24.8pp · 2024: 16.3pp
- All cycles
- 2024: D+16.3 2020: D+19.1 2016: D+20.2 2012: D+27.6 2008: D+24.8
Not yet ingested
- Civics
- —
Market trends
- HPI YoY
- —
- Current HPI
- —
- Rent YoY
- —
- Metro
- —
- State GDP YoY
- ▲ 2.66%
- F500 in state
- 28
Industry mix (Fortune 500 HQ in GA)
| Industry | F500 HQs | Revenue |
|---|---|---|
| Paper / Packaging | 2 | $29B |
|
||
| Retail | 1 | $160B |
|
||
| Transportation / Logistics | 1 | $91B |
|
||
| Airlines | 1 | $62B |
|
||
| Consumer Goods | 1 | $47B |
|
||
| Utilities | 1 | $25B |
|
||
Price history
+126.2% since first listed5 events — show timeline
- 2026-02-08 Listed $119,900 CBOR
- 2012-10-10 Sold (MLS) $16,168 GAMLS
- 2012-07-16 Listed $15,600 GAMLS
- 2006-05-01 Sold (Public Records) $54,400 Public Records
- 2003-11-06 Sold (Public Records) $53,000 Public Records
Property tax history
+4.0%/yrLatest (2025): $500 · +3.9% YoY. Source: county tax records.
Cash-flow waterfall
monthlySold comps — $/sqft
last 12 mo · ≤1 miLoading sold comps…