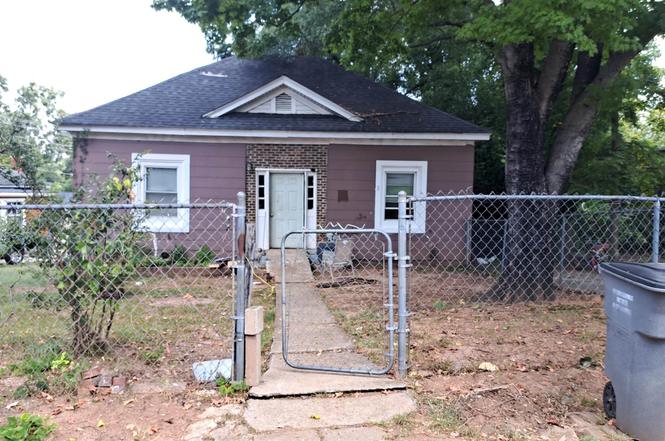
2 C St · Judson, SC
Flood risk 1/10 · Minimal
- FEMA flood zone
- X (unshaded)
- Chance of flooding over 30 yrs
- 0.0%
- Est. flood insurance / yr
- $507 – $1,088
Fire risk 1/10 · Minimal
- Est. fire insurance / yr
- $783 – $1,453
Heat risk 5/10 · Moderate
- Hot days now (above 102°F)
- 7 days/yr
- Hot days in 30 yrs
- 16 days/yr
Wind risk 2/10 · Minimal
- Chance of severe wind over 30 yrs
- 1.0%
Air-quality risk 4/10 · Minor
- Unhealthy air days now
- 4 days/yr
- Unhealthy air days in 30 yrs
- 4 days/yr
Risk factors via First Street. Map © Google.
Why this score? — see what drove the C grade
The composite is a weighted blend of 9 inputs, each scored 0–100. Each bar is that input's sub-score; the figure is the points it added to the 100-point composite (weight × sub-score).
- Cash flow +25.1/30.0
- DSCR +8.2/10.0
- ARV discount +5.9/15.0
- 1% rule +5.7/10.0
- Schools +4.2/10.0
- Livability +4.0/5.0
- Rent growth +2.9/5.0
- Condition / age +2.5/5.0
- Appreciation +0.0/10.0
$165,000
🖨 Deal sheet (PDF) 📄 Offer letter ✓ Due diligence
Listing remarks
Existing rental in Judson Mills with large yard and huge potential. House has 10+ foot ceilings throughout and extended foyer with oversized doorways. Home could easily be reframed to create a 3rd bedroom or flex-room by just adding a doorway. The yard
Key facts
- Large yard
- Oversized doorways
- 10 foot ceilings
Tags
Property features AI
Finance
- Other: Lead-based paint and residential property disclosures required
- HOA & community: No HOA fees; some sidewalks in the community
Exterior
- Parking: Driveway parking with paved asphalt
- Utilities: Public water; Electric water heater; Public sewer; Public garbage pickup
- Home design: Single-story residence; Approximately 50+ years old; Crawl space foundation
- Construction: Asbestos shingle exterior finish; Composition shingle roof
- Exterior features: Front porch; Corner lot with fenced yard and sidewalks
Interior
- Kitchen: Kitchen approximately 10 x 14; Electric stand-alone range
- Bedrooms: Two main-level bedrooms; primary bedroom listed as 'Other/See Remarks'; Secondary bedrooms about 11 x 11
- Flooring: Vinyl flooring
- Bathrooms: One full bathroom (on main level)
- Heating & cooling: Electric forced-air heating; Central forced cooling
- Interior features: 9-foot (or higher) ceilings; Wood-burning fireplace; No specialty rooms listed
- Laundry & utility: Laundry area in the kitchen
Neighborhood map
What this means for you Summary
Snapshot
- This is a 2-bed/1.0-bath single-family listed at $165k.
Deal economics
- At list price, monthly cash flow is $365 ($4k/yr) — positive.
- The deal already cash-flows at list — no discount required.
- Meets the 1% rule at list price ($2k rent vs $165k).
- Recommended offer: $145k (12.0% below list) — sets the bar for market timing.
Location & tenants
- Location reads 80/100 on livability (#10 in SC, #1,636 nationally) — a professional / high-income tenant draw. Strengths: commute A+, cost of living A+, housing A+; Watch: employment F.
- Greenville 01 (suburban): math 44% / reading 54% proficiency, ranked #10 of 80 in SC (top 12%) — families likely to look elsewhere, expect single-tenant / working-renter base with shorter leases.
- Zoned schools: Hollis Academy (math 28% / reading 21%, grade F, #452 of 597 statewide, top 78%, 608 students, 100% FRL) — zoned schools average 100% FRL vs 42% district-wide (58 pts higher); higher-poverty schools than district average — tighter screening recommended.
- Zoned-school proficiency averages 24% at this address vs 49% district-wide (-24 pts) — the specific schools serving this property underperform the Greenville 01 average; the district grade overstates school quality for this exact location.
- Market conditions: Rents rising (+1.7%/yr); 278 active listings in the ZIP; 29 comparable units currently listed for rent nearby; rentals at typical pace (median 16d on market — plan ~3-4 weeks tenant-placement turnaround); 5,595 units permitted in Greenville County in 2024 (566 in 5+ unit buildings).
- This rent runs 41% of the median local income ($52k/yr) — at the standard rent-burdened threshold; future hikes will face affordability resistance.
Forward outlook
- Local home prices are declining (-3.0%/yr); year-one equity from $1k of loan paydown is wiped out by about $5k of value loss. Plan a longer hold.
- Greenville County population projected at +34% by 2050 — long-run rental-demand tailwind backs the buy-and-hold thesis.
Negotiation context
- It's been on market 231 days — a 12% lower offer ($145k) is reasonable based on typical stale-listing flexibility.
- 2 sale attempts; this cycle's ask has dropped $40k (20%) from the opening price — seller is motivated, your offer sets the floor, not the list.
- Current owner paid $5k; list at $165k implies a 3200% gain — meaningful room to come down on a strong offer.
Risks & watch-outs
- Watch-outs: built in 1940 — expect roof / HVAC / electrical / plumbing capex.
- Climate carrying-cost: extreme-heat days projected 7→16/yr by 2055 (HVAC capex compounding) — expect insurance premiums to compound above CPI over the hold.
Questions for the listing agent
- It's been on market 231 days. Have you received any prior offers? Is the seller open to a 12% concession, seller financing, or rate buy-down credit?
- Built in 1940 — when were the roof, HVAC, electrical panel, plumbing, and water heater last replaced?
- Why hasn't it sold? Are there any deal-killer items the seller is aware of (foundation, flood, title, zoning, code violations)?
- Is there a deadline driving the sale (1031 exchange, divorce, estate, relocation)? That informs how much negotiation room exists.
- Schools are F-rated, which usually means shorter tenancies and higher turnover. Who's the typical renter profile here, and what's been the actual vacancy rate?
- What's the average days-on-market for RENTAL listings here right now (not sales)? A rising rental-DOM trend means longer vacancies and softer asking-rent achievability than the comps imply.
- What's the recent tenant-quality profile in this submarket — average credit score on applications, eviction rate, late-payment / NSF rate, and stable-employment percentage? A property-management company in the area should have these aggregated.
- How much new for-sale + rental construction is in the pipeline within 1–3 miles? Heavy new supply typically softens prices + rents 12–24 months out; constrained supply supports both.
Investment metrics
- 1% rule
- 1.07% ✓
- Cap rate
- 8.95%
- Cash-on-cash
- 9.47%
- DSCR
- 1.42
- GRM
- 7.8
CMA / ARV
- ARV (on-the-fly)
- $159,216
- Comps found
- 7
Show comp detail 7 sales within ~0.75 mi
| Address | Dist | Beds/Ba | Sqft | Sold | Price | $/sf | Match |
|---|---|---|---|---|---|---|---|
| 101 Mason St | 0.43mi | 2/1.0 | 945 (+10%) | 1mo | $197,500 | $209 | 62 |
| 9 Barnwell St | 0.41mi | 2/2.0 | 900 (+5%) | 16mo | $155,000 | $172 | 55 |
| 26 Baldwin St | 0.52mi | 2/1.0 | 952 (+11%) | 7mo | $182,500 | $192 | 51 |
| 8 Baldwin St | 0.63mi | 2/1.0 | 900 (+5%) | 14mo | $151,500 | $168 | 51 |
| 13 Calvert St | 0.37mi | 2/1.0 | 970 (+13%) | 14mo | $180,000 | $186 | 49 |
| 219 Heatherly Dr | 0.62mi | 2/1.0 | 950 (+11%) | 13mo | $151,050 | $159 | 42 |
| 3 Cardwell St | 0.71mi | 2/1.0 | 938 (+10%) | 14mo | $207,500 | $221 | 39 |
Match score weights: distance 35% · size 25% · config 20% · recency 20%. Top-matched comps best support the ARV.
Projected returns pro-forma
-3.0% appreciation · 1.72% rent growth · sell at horizon
- IRR
- -3.4%
- Equity multiple
- 0.87×
- Total profit
- $-5,789
- Equity at exit
- $24,602
- IRR
- 4.9%
- Equity multiple
- 1.34×
- Total profit
- $15,739
- Equity at exit
- $14,266
Cash invested: $46,200 (down + closing). Projections, not guarantees.
Landlord ↔ Tenant lean methodology
- Overall (STATE)
- 90 Strongly Landlord-Friendly
- State South Carolina
- 90 Strongly Landlord-Friendly · R+6
- County
- — inherits STATE
- City
- — inherits STATE
ZIP-level market 29611
- Home prices YoY
- -34.6%
- Rents YoY
- 1.7%
- Active inventory
- 278
- Price-to-rent
- 7.8×
Monthly cashflow live
- Estimated rent
- $1,761 high interval (Pro) →
- Mortgage (P&I)
- −$865
- Tax from tax record
- −$93 /mo · $1,112/yr
- Insurance
- −$69
- HOA
- −$0
- Vacancy / Maint / Mgmt
- −$370
- Net cashflow
- $365
Break-even live
Sensitivity live
| Price | -10% $458 | -5% $411 | +0% $365 | +5% $318 | +10% $271 |
|---|---|---|---|---|---|
| Rent | -10% $226 | -5% $295 | +0% $365 | +5% $434 | +10% $504 |
| Rate | -1.0pp $448 | -0.5pp $407 | base $365 | +0.5pp $322 | +1.0pp $278 |
UW: 25.0% down · 7.5% · 30yr · 1.5% tax · 5.0% vac · 8.0% maint · 8.0% mgmt
Financing live
Cash to close
- Down payment
- $41,250
- Closing costs
- $4,950
- Reserves months
- —
- Total cash needed
- —
Loan-product check · same deal, 3 products live
Conventional
25% down · 7.5% · 30yr
- Down + closing
- —
- Monthly P&I
- —
- Monthly cashflow
- —
- DSCR
- —
- Eligible?
- —
Personal DTI + credit; lowest rate.
DSCR
20% down · 8.5% · 30yr
- Down + closing
- —
- Monthly P&I
- —
- Monthly cashflow
- —
- DSCR
- —
- Eligible?
- —
No personal income docs; deal must DSCR.
Hard money
10% down · 12.0% · 12mo
- Down + closing
- —
- Monthly P&I
- —
- Monthly cashflow
- —
- DSCR
- —
- Eligible?
- —
Short-term bridge; refi at stabilization.
Rent comps 29 comps
| Address | Beds | Baths | Sqft | Rent | $/sqft | DOM | Units | Dist |
|---|---|---|---|---|---|---|---|---|
| 29 4th St Greenville, SC | 3.0 | 2.0 | 1120 | $1,695 | $1.51 | 4d | 1 | 0.11mi |
| 4 Kilgore St Greenville, SC | 2.0 | 1.0 | 1050 | $1,500 | $1.43 | 25d | 1 | 0.15mi |
| 701 Easley Bridge Rd Greenville, SC | 3.0 | 1.0–2.5 | 1324 | $2,758 | $2.08 | 4d | 110 | 0.26mi |
| 19 Saco St Greenville, SC | 2.0 | 2.0 | 1050 | $2,400 | $2.29 | 25d | 1 | 0.47mi |
| 4 Averill St Greenville, SC | 2.0 | 1.0 | 728 | $1,400 | $1.92 | 25d | 1 | 0.62mi |
| 119 Heatherly Dr Greenville, SC | 2.0 | 1.0 | 896 | $950 | $1.06 | 25d | 1 | 0.64mi |
| 8 Judson Rd Greenville, SC | 2.0 | 1.0 | 944 | $1,200 | $1.27 | 25d | 1 | 0.74mi |
| 111 N Calhoun St Greenville, SC | 2.0 | 1.0 | 650 | $1,250 | $1.92 | 25d | 1 | 0.77mi |
| 317 Douthit St Greenville, SC | 2.0 | 1.0 | 825 | $1,095 | $1.33 | 4d | 1 | 0.81mi |
| 806 Green Ave Greenville, SC | 3.0 | 1.0–2.0 | 1053 | $2,033 | $1.93 | 25d | 1 | 0.82mi |
| 412 Green Ave Greenville, SC | 2.0 | 1.0 | 980 | $3,000 | $3.06 | 15d | 1 | 0.86mi |
| 298 Werts St Greenville, SC | 2.0 | 2.0 | 1110 | $2,000 | $1.80 | 25d | 1 | 0.92mi |
| 304 N Leach St Greenville, SC | 2.0 | 1.0 | 756 | $1,250 | $1.65 | 25d | 1 | 0.93mi |
| 1 Craven St Unit 8 Greenville, SC | 2.0 | 1.0 | 850 | $1,350 | $1.59 | 4d | 1 | 0.93mi |
| 1 E Main St Greenville, SC | 1.0–3.0 | 1.0–2.0 | 1241 | $2,098 | $1.69 | 4d | 28 | 0.94mi |
| 1108 S Main St Greenville, SC | 3.0 | 1.0–2.0 | 1060 | $2,883 | $2.72 | 4d | 25 | 0.98mi |
| 321 Wilkins St Unit D Greenville, SC | 1.0 | 1.0 | 650 | $1,495 | $2.30 | 25d | 1 | 0.98mi |
| 317 Wilkins St Unit D Greenville, SC | 1.0 | 1.0 | 650 | $1,495 | $2.30 | 25d | 1 | 0.99mi |
| 500 Birnie St Greenville, SC | 2.0 | 1.0 | 980 | $1,475 | $1.51 | 25d | 1 | 1.03mi |
| 366 Field St Greenville, SC | 2.0 | 1.0–2.0 | 926 | $4,698 | $5.07 | 4d | 9 | 1.12mi |
| 101 Wilkins St Greenville, SC | 1.0 | 1.0 | 600 | $1,850 | $3.08 | 4d | 1 | 1.14mi |
| 301 Augusta St Unit 202 Greenville, SC | 1.0 | 1.5 | 861 | $1,725 | $2.00 | 25d | 1 | 1.18mi |
| 104 Wardlaw St Greenville, SC | 3.0 | 1.0–2.0 | 1126 | $3,579 | $3.18 | 4d | 42 | 1.21mi |
| 400 Mills Ave Greenville, SC | 1.0 | 1.0 | 900 | $1,675 | $1.86 | 4d | 1 | 1.24mi |
| 39 E 7th St Greenville, SC | 3.0 | 2.0 | 1120 | $1,750 | $1.56 | 4d | 1 | 1.25mi |
| 33 9th St Greenville, SC | 2.0 | 1.0 | 886 | $1,000 | $1.13 | 25d | 1 | 1.32mi |
| 25 River St Greenville, SC | 2.0 | 1.0–2.0 | 842 | $3,066 | $3.64 | 4d | 10 | 1.34mi |
| 101 Reedy View Dr Greenville, SC | 2.0 | 1.0–2.0 | 862 | $3,577 | $4.15 | 4d | 31 | 1.38mi |
| 5001 Assembly View Cir Greenville, SC | 1.0–3.0 | 1.0–2.0 | 975 | $1,328 | $1.36 | 4d | 27 | 1.41mi |
Listing history 25 events
-
2026-06-18days on market $165,000 Active 231 DOM
-
2026-06-17days on market $165,000 Active 230 DOM
-
2026-06-16days on market $165,000 Active 229 DOM
-
2026-06-15days on market $165,000 Active 228 DOM
-
2026-06-13days on market $165,000 Active 226 DOM
-
2026-06-13days on market $165,000 Active 225 DOM
-
2026-06-10days on market $165,000 Active 223 DOM
-
2026-06-09days on market $165,000 Active 222 DOM
-
2026-06-08days on market $165,000 Active 221 DOM
-
2026-06-07days on market $165,000 Active 220 DOM
-
2026-06-03days on market $165,000 Active 216 DOM
-
2026-06-03days on market $165,000 Active 215 DOM
-
2026-06-01days on market $165,000 Active 214 DOM
-
2026-05-31days on market $165,000 Active 213 DOM
-
2026-05-17price $165,000
-
2026-05-07status Active
-
2026-05-01historical
-
2026-04-24price $185,000
-
2026-03-12price $195,000
-
2025-12-03price $199,000
-
2025-10-23$205,000 Active
-
2012-11-16soldstatus $5,000
-
2009-03-19soldstatus $29,680
-
1992-07-05soldstatus $18,000
-
1984-02-27soldstatus $13,025
ⓘ Source: listings_history table (triggers on properties + properties_extension) + one-shot
backfill from property_details.listing_events for pre-trigger history.
Tax reassessment forecast SC · Resets to sale price
- Current annual tax
- $1,112 · $93/mo
- Projected year-2 tax
- $1,112 · $93/mo
- Expected delta
- $0/yr ($0/mo · 0.0%)
ⓘ Screening estimate from a state-policy table — verify with the county assessor before closing.
Climate risk First Street
- Flood 1/10 Low FEMA zone X (unshaded) · 0% chance over 30 yrs
- Wildfire 1/10 Low
- Heat 5/10 Major 7 d/yr ≥102°F today · 16 d/yr by 30 yrs out
- Wind 2/10 Low 100% chance of damaging wind over 30 yrs
- Air quality 4/10 Moderate 4 unhealthy d/yr today · 4 by 30 yrs out
Nearby sold comps map
Loading sold comps map…
Walkable amenities ~0.75 mi
Loading nearby amenities…
Taxation est. · year 1
- Rental income
- $21,136
- − Mortgage interest
- −$9,243
- − Property taxes
- −$1,112
- − Insurance
- −$825
- − Repairs & maintenance
- −$1,691
- − Management
- −$1,691
- − Depreciation
- −$4,800
- Taxable income
- $1,775
- Est. tax owed @ 24.0%
- −$426
- After-tax cash flow
- $3,951/yr
For passive investors: Depreciation is non-cash, so a rental often shows a tax loss while cash-flowing — sheltering income. Rental losses are passive: they offset passive income freely, and up to $25,000/yr can offset ordinary (W-2) income if you actively participate and your MAGI is under $100k (phasing out to $0 by $150k); unused losses carry forward. On sale, claimed depreciation is recaptured at up to 25%, and gains may owe capital-gains tax (a 1031 exchange can defer both). Figures are a year-1 estimate at your 24.0% rate — not tax advice; consult a CPA.
Schools (NCES district)
- District
- Greenville 01
- NCES district ID
- 4502310
- Math proficiency
- 44% ▼ -10.00%
- Reading proficiency
- 54% ▼ -2.00%
- Median HH income
- $49,596
- Composite
- 41.88/100
- National rank
- #3370
- State rank
- #10 of 80 in SC
Livability — Judson
- Score
- 80/100
- State rank
- #10
- US rank
- #1636
Category grades
Schools grade is shown separately in the Schools card above.
Census & demographics
- Census place
- Judson, SC
- County
- Greenville County · 573,815 people
- Metro
- Greenville-Anderson, SC
- Population (ZIP)
- 32,365
- Household income
- $51,565
- Rent vs Own
- Severe rent burden
- 1754.0
Population outlook (Greenville County) Hauer SSP2
- Today (2025)
- 574,580 people
- By 2030
- 615,615 · +7.1%
- By 2040
- 695,373 · +21.0%
- By 2050
- 769,367 · +33.9%
- By 2075
- 933,296 · +62.4%
- By 2100
- 1,029,196 · +79.1%
Race, ethnicity, and origin ACS 2023
- Neighborhood character
- Highly diverse neighborhood (Simpson 0.70)
- Race & ethnicity
- White 41% Black 29% Hispanic / Latino 22% Two or more races 12%
- Hispanic origin (detail)
- Mexican 12% Puerto Rican 2%
- Common ancestry
- Slovak 1% Italian 1% Serbian 1%
- Foreign-born
- 12% · Canada, Jamaica, China
- Languages at home
- 79% English-only · Spanish 19% Russian/Polish/Slavic 1%
Political lean MEDSL · Greenville
- 2024 margin
- Strong R (+22.2) · D 38.0% · R 60.2% · Other 1.8%
- 2008→2024 swing
- +1.7pp toward D · 2008: -23.9pp · 2024: -22.2pp
- All cycles
- 2024: R+22.2 2020: R+18.2 2016: R+24.7 2012: R+27.8 2008: R+23.9
Not yet ingested
- Civics
- —
Market trends
- HPI YoY
- ▼ -139.58%
- Current HPI
- 264.2891
- Rent YoY
- ▲ 1.72%
- Metro
- Greenville-Anderson, SC
- State GDP YoY
- ▲ 4.51%
- F500 in state
- 2
Industry mix (Fortune 500 HQ in SC)
| Industry | F500 HQs | Revenue |
|---|---|---|
| Packaging | 1 | $7B |
|
||
Price history
+1166.8% since first listed11 events — show timeline
- 2026-05-17 Price Changed $165,000 Greater Greenville MLS
- 2026-05-07 Relisted — Greater Greenville MLS
- 2026-05-01 Listing Removed — Greater Greenville MLS
- 2026-04-24 Price Changed $185,000 Greater Greenville MLS
- 2026-03-12 Price Changed $195,000 Greater Greenville MLS
- 2025-12-03 Price Changed $199,000 Greater Greenville MLS
- 2025-10-23 Listed $205,000 Greater Greenville MLS
- 2012-11-16 Sold (Public Records) $5,000 Public Records
- 2009-03-19 Sold (Public Records) $29,680 Public Records
- 1992-07-05 Sold (Public Records) $18,000 Public Records
- 1984-02-27 Sold (Public Records) $13,025 Public Records
Property tax history
+2.6%/yrLatest (2025): $1,112 · +3.4% YoY. Source: county tax records.
Cash-flow waterfall
monthlySold comps — $/sqft
last 12 mo · ≤1 miLoading sold comps…