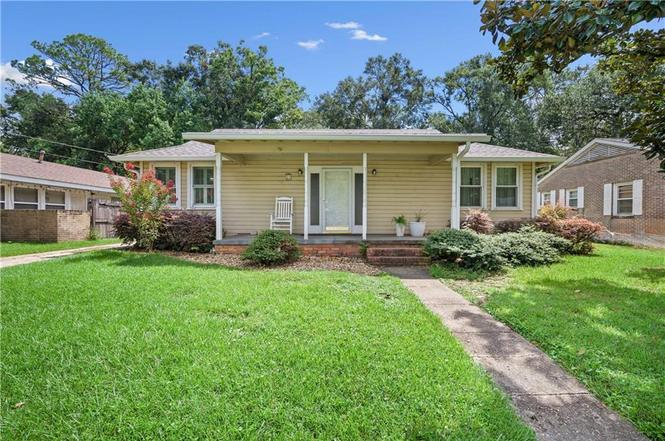
25 Chadwick Dr W · Mobile, AL
Flood risk 1/10 · Minimal
- FEMA flood zone
- X (unshaded)
- Chance of flooding over 30 yrs
- 0.0%
- Est. flood insurance / yr
- $507 – $1,088
Fire risk 1/10 · Minimal
- Est. fire insurance / yr
- $916 – $1,700
Heat risk 9/10 · Severe
- Hot days now (above 105°F)
- 7 days/yr
- Hot days in 30 yrs
- 21 days/yr
Wind risk 9/10 · Severe
- Chance of severe wind over 30 yrs
- 99.0%
Air-quality risk 2/10 · Minimal
- Unhealthy air days now
- 1 days/yr
- Unhealthy air days in 30 yrs
- 1 days/yr
Risk factors via First Street. Map © Google.
Why this score? — see what drove the B- grade
The composite is a weighted blend of 9 inputs, each scored 0–100. Each bar is that input's sub-score; the figure is the points it added to the 100-point composite (weight × sub-score).
- Cash flow +25.8/30.0
- ARV discount +15.0/15.0
- DSCR +8.6/10.0
- 1% rule +5.8/10.0
- Rent growth +3.8/5.0
- Livability +3.8/5.0
- Condition / age +2.5/5.0
- Schools +2.3/10.0
- Appreciation +0.0/10.0
$140,000
🖨 Deal sheet 📄 Offer letter ✓ Due diligence
Listing remarks
Cute Midtown cottage located in wonderful Cromwell Place is priced to sell!! While there are lots of upgrades, including a new fortified roof (great for those homeowner's insurance rates!!), new HVAC, new gutters, new double paned windows, new fence & a recently poured concrete patio - some TLC for the home is needed, as well. There's also new plumbing from the house to the street, giving much piece of mind! Besides the 3 bedrooms, this home also offers a bonus/flex room that could be used for whatever your heart desires. This conveniently located home is 5 minutes to the interstate, restaurants, shops & Mobile Infirmary and USA Women's & Children's Hospital. Travel time i
Key facts
- New hvac
- Fortified roof
- New gutters
Tags
Property features AI
Finance
- Other: Located in Cromwell Place subdivision
Exterior
- Parking: Driveway
- Utilities: Cable available; Electricity available (110V and 220V); Public sewer; Water available
- Home design: Single-family residential property
- Construction: Wood siding exterior; Pillar/post/pier foundation; Shingle roof
- Exterior features: Rain gutters; Outdoor storage; Back yard fencing; Property has a view
Interior
- Kitchen: Dishwasher
- Bedrooms: 3 bedrooms
- Flooring: Hardwood floors
- Bathrooms: 1 full bathroom
- Heating & cooling: Central heating; Central air; Ceiling fans
- Interior features: Built-in bookcases; Open floorplan
Neighborhood map
What this means for you Summary
Snapshot
- This is a 3-bed/1.0-bath single-family listed at $140k.
Deal economics
- At list price, monthly cash flow is $341 ($4k/yr) — positive.
- The deal already cash-flows at list — no discount required.
- Meets the 1% rule at list price ($2k rent vs $140k).
- Recommended offer: $136k (3.0% below list) — sets the bar for market timing.
- Cap rate 9.2% vs local median 4.9% in Mobile — top-decile yield for the area; either an underpriced asset or a hidden risk that comps aren't pricing in. Stress-test before assuming the spread holds.
Location & tenants
- Location reads 75/100 on livability (#20 in AL, #4,262 nationally) — a middle-class / working-renter tenant base. Strengths: commute A+, cost of living A+, housing A+; Watch: crime F, employment D-.
- Mobile County (urban): math 15% / reading 39% proficiency, ranked #81 of 129 in AL (top 63%) — low school quality limits family demand, transient renter base, plan for 1-2y turnover; 67% free/reduced lunch — lower-income household profile, screen leases tightly.
- Zoned schools: Murphy High School (math 10% / reading 19%, grade F, #220 of 305 statewide, top 77%, 1,254 students, 66% FRL) — zoned schools at 66% FRL track the district average.
- Zoned-school proficiency averages 14% at this address vs 27% district-wide (-12 pts) — the specific schools serving this property underperform the Mobile County average; the district grade overstates school quality for this exact location.
- Market conditions: Rents rising fast (+5.1%/yr); 174 active listings in the ZIP; 30 comparable units currently listed for rent nearby; rentals at typical pace (median 21d on market — plan ~3-4 weeks tenant-placement turnaround); 1,678 units permitted in Mobile County in 2024 (264 in 5+ unit buildings).
Forward outlook
- Local home prices are declining (-3.0%/yr); year-one equity from $968 of loan paydown is wiped out by about $4k of value loss. Plan a longer hold.
- Mobile County population projected to shrink 8% by 2050 — rents likely to lag national; underwrite the cash flow, not the appreciation.
- At projected returns (-3.0% appreciation + 5.1% rent growth), your $39k cash investment doubles in ~9 years — after that, you're playing with house money.
Negotiation context
- It's been on market 38 days — a 3% lower offer ($136k) is reasonable based on typical stale-listing flexibility.
- 5 sale attempts; this cycle's ask has dropped $20k (12%) from the opening price — seller is motivated, your offer sets the floor, not the list.
- Current owner paid $119k; 18% above their basis — modest negotiation headroom, anchor on the comps not their cost.
Risks & watch-outs
- Climate carrying-cost: severe wind risk, 99% chance of damaging wind over 30y; extreme-heat days projected 7→21/yr by 2055 (HVAC capex compounding) — expect insurance premiums to compound above CPI over the hold.
Questions for the listing agent
- It's been on market 38 days. Have you received any prior offers? Is the seller open to a 3% concession, seller financing, or rate buy-down credit?
- Is there a deadline driving the sale (1031 exchange, divorce, estate, relocation)? That informs how much negotiation room exists.
- Schools are D-rated, which usually means shorter tenancies and higher turnover. Who's the typical renter profile here, and what's been the actual vacancy rate?
- Crime grade is F in this area — have there been break-ins, vandalism, or insurance claims at this property in the last 3 years? What carrier currently insures it and at what premium?
- What's the average days-on-market for RENTAL listings here right now (not sales)? A rising rental-DOM trend means longer vacancies and softer asking-rent achievability than the comps imply.
- What's the recent tenant-quality profile in this submarket — average credit score on applications, eviction rate, late-payment / NSF rate, and stable-employment percentage? A property-management company in the area should have these aggregated.
- How much new for-sale + rental construction is in the pipeline within 1–3 miles? Heavy new supply typically softens prices + rents 12–24 months out; constrained supply supports both.
Investment metrics
- 1% rule
- 1.08% ✓
- Cap rate
- 9.22%
- Cash-on-cash
- 10.44%
- DSCR
- 1.46
- GRM
- 7.7
CMA / ARV
- ARV (on-the-fly)
- $212,544
- Comps found
- 12
Show comp detail 12 sales within ~0.75 mi
| Address | Dist | Beds/Ba | Sqft | Sold | Price | $/sf | Match |
|---|---|---|---|---|---|---|---|
| 25 Chadwick Dr W | 0.00mi | 3/1.0 | 1,476 (0%) | 1mo | $138,000 | $93 | 99 |
| 2806 Exter Dr | 0.08mi | 3/2.0 | 1,485 (+1%) | 1mo | $205,000 | $138 | 90 |
| 2757 S Sherwood Dr | 0.24mi | 3/1.5 | 1,510 (+2%) | 0mo | $218,000 | $144 | 82 |
| 2656 Foreman Cir | 0.39mi | 3/2.0 | 1,500 (+2%) | 2mo | $145,000 | $97 | 74 |
| 160 Emogene Pl | 0.47mi | 3/2.0 | 1,520 (+3%) | 2mo | $195,000 | $128 | 68 |
| 3051 Baronne St | 0.56mi | 3/2.0 | 1,451 (-2%) | 1mo | $190,000 | $131 | 66 |
| 2663 Foreman Cir | 0.41mi | 4/2.0 (+1) | 1,587 (+8%) | 1mo | $185,000 | $117 | 58 |
| 1841 Woodcock Pl | 0.46mi | 3/2.0 | 1,327 (-10%) | 0mo | $195,000 | $147 | 57 |
| 1833 Woodcock Pl | 0.46mi | 3/2.0 | 1,317 (-11%) | 1mo | $195,000 | $148 | 55 |
| 1813 Woodcock St | 0.46mi | 3/2.0 | 1,269 (-14%) | 1mo | $195,000 | $154 | 50 |
| 2756 Jennings Dr | 0.70mi | 3/2.0 | 1,300 (-12%) | 0mo | $215,000 | $165 | 43 |
| 134 Hyland Ave | 0.65mi | 2/2.0 (-1) | 1,272 (-14%) | 2mo | $227,500 | $179 | 36 |
Match score weights: distance 35% · size 25% · config 20% · recency 20%. Top-matched comps best support the ARV.
Projected returns pro-forma
-3.0% appreciation · 5.06% rent growth · sell at horizon
- IRR
- 1.4%
- Equity multiple
- 1.06×
- Total profit
- $2,192
- Equity at exit
- $20,874
- IRR
- 12.8%
- Equity multiple
- 2.11×
- Total profit
- $43,396
- Equity at exit
- $12,105
Cash invested: $39,200 (down + closing). Projections, not guarantees.
Landlord ↔ Tenant lean methodology
- Overall (STATE)
- 90 Strongly Landlord-Friendly
- State Alabama
- 90 Strongly Landlord-Friendly · R+15
- County
- — inherits STATE
- City
- — inherits STATE
ZIP-level market 36606
- Rents YoY
- 5.1%
- Active inventory
- 174
- Price-to-rent
- 7.7×
Monthly cashflow live
- Estimated rent
- $1,514 high interval (Pro) →
- Mortgage (P&I)
- −$734
- Tax from tax record
- −$62 /mo · $746/yr
- Insurance
- −$58
- HOA
- −$0
- Vacancy / Maint / Mgmt
- −$318
- Net cashflow
- $341
Break-even live
UW: 25.0% down · 7.5% · 30yr · 1.5% tax · 5.0% vac · 8.0% maint · 8.0% mgmt
Financing live
Cash to close
- Down payment
- $35,000
- Closing costs
- $4,200
- Reserves months
- —
- Total cash needed
- —
Loan-product check · same deal, 3 products live
Conventional
25% down · 7.5% · 30yr
- Down + closing
- —
- Monthly P&I
- —
- Monthly cashflow
- —
- DSCR
- —
- Eligible?
- —
Personal DTI + credit; lowest rate.
DSCR
20% down · 8.5% · 30yr
- Down + closing
- —
- Monthly P&I
- —
- Monthly cashflow
- —
- DSCR
- —
- Eligible?
- —
No personal income docs; deal must DSCR.
Hard money
10% down · 12.0% · 12mo
- Down + closing
- —
- Monthly P&I
- —
- Monthly cashflow
- —
- DSCR
- —
- Eligible?
- —
Short-term bridge; refi at stabilization.
Rent comps 30 comps
| Address | Beds | Baths | Sqft | Rent | $/sqft | DOM | Units | Dist |
|---|---|---|---|---|---|---|---|---|
| 2500 Dauphinwood Dr Mobile, AL | 2.0–3.0 | 1.0–2.0 | 1250 | $1,395 | $1.12 | 13d | 19 | 0.21mi |
| 150 Dunn Ave Mobile, AL | 3.0 | 2.0 | 1455 | $1,250 | $0.86 | 21d | 1 | 0.29mi |
| 168 W Collins St Mobile, AL | 3.0 | 1.0 | 968 | $725 | $0.75 | 21d | 1 | 0.38mi |
| 2604 Dauphin St #210 Mobile, AL | 2.0 | 1.0 | 950 | $1,150 | $1.21 | 21d | 1 | 0.39mi |
| 2604 Dauphin St Mobile, AL | 2.0 | 1.0 | 950 | $1,072 | $1.13 | 43d | 2 | 0.39mi |
| 2855 Potter Dr Mobile, AL | 2.0 | 1.0 | 1127 | $1,050 | $0.93 | 43d | 1 | 0.45mi |
| 2861 Potter Dr Unit 1043844P Mobile, AL | 3.0 | 2.0 | 1496 | $2,492 | $1.67 | 21d | 1 | 0.46mi |
| 2863 Potter Dr Unit 1043693P Mobile, AL | 4.0 | 2.0 | 1496 | $3,049 | $2.04 | 13d | 1 | 0.46mi |
| 2861 Ralston Rd Mobile, AL | 3.0 | 2.0 | 1617 | $1,650 | $1.02 | 43d | 1 | 0.51mi |
| 3060 Emogene St Mobile, AL | 3.0 | 1.0 | 1200 | $1,400 | $1.17 | 13d | 1 | 0.53mi |
| 200 S Florida St Unit 101 Mobile, AL | 2.0 | 2.0 | 1150 | $1,375 | $1.20 | 21d | 1 | 0.62mi |
| 2859 Brierwood Dr Mobile, AL | 3.0 | 1.0 | 1057 | $1,500 | $1.42 | 13d | 1 | 0.64mi |
| 2507 Taylor Ave Mobile, AL | 3.0 | 1.0 | 1230 | $1,495 | $1.22 | 13d | 1 | 0.71mi |
| 2656 Pathway Pl Mobile, AL | 2.0–3.0 | 1.0 | 778 | $1,261 | $1.62 | 13d | 9 | 0.71mi |
| 107 Grand Blvd Mobile, AL | 2.0 | 2.0 | 1200 | $1,295 | $1.08 | 21d | 1 | 0.73mi |
| 2503 Richard Ave Mobile, AL | 2.0 | 1.0 | 928 | $805 | $0.87 | 13d | 1 | 0.76mi |
| 156 Hemley Ave Mobile, AL | 3.0 | 1.0 | 936 | $1,195 | $1.28 | 43d | 1 | 0.76mi |
| 120 Paris Ave Mobile, AL | 2.0 | 1.0 | 1054 | $1,150 | $1.09 | 21d | 1 | 0.77mi |
| 315 Hadrian St Mobile, AL | 3.0 | 2.0 | 1843 | $1,800 | $0.98 | 43d | 1 | 0.80mi |
| 3252 Orleans St Mobile, AL | 2.0 | 1.0 | 900 | $850 | $0.94 | 43d | 1 | 0.81mi |
| 104 Ellinor St Mobile, AL | 2.0 | 1.0 | 896 | $1,275 | $1.42 | 21d | 1 | 0.87mi |
| 418 Durande Dr Mobile, AL | 3.0 | 2.0 | 1456 | $1,350 | $0.93 | 13d | 1 | 0.98mi |
| 151 Du Rhu Dr Mobile, AL | 1.0–3.0 | 1.0–2.0 | 1052 | $2,800 | $2.66 | 13d | 12 | 1.18mi |
| 461 Magnolia Rd Unit A Mobile, AL | 2.0 | 1.0 | 989 | $825 | $0.83 | 43d | 1 | 1.19mi |
| 505 Bel Air Blvd Mobile, AL | 1.0–2.0 | 1.0–2.0 | 976 | $1,274 | $1.30 | 13d | 16 | 1.26mi |
| 209 S Fulton St Mobile, AL | 2.0 | 1.5 | 1255 | $1,750 | $1.39 | 21d | 1 | 1.28mi |
| 182 Williams St Unit 1043570P Mobile, AL | 3.0 | 1.0 | 1399 | $2,476 | $1.77 | 13d | 1 | 1.30mi |
| 3655 Old Shell Rd Unit 3655 Mobile, AL | 2.0 | 2.0 | 1200 | $1,850 | $1.54 | 13d | 1 | 1.32mi |
| 186 Stanton Rd Mobile, AL | 1.0–3.0 | 1.0–2.5 | 1263 | $2,450 | $1.94 | 43d | 1 | 1.35mi |
| 423 Devon Dr Mobile, AL | 3.0 | 1.0 | 1220 | $950 | $0.78 | 43d | 1 | 1.45mi |
Listing history 13 events
-
2026-04-21status Pending
-
2026-04-02price $140,000
-
2026-04-02status Active
-
2026-03-28status Pending
-
2026-03-21status Active
-
2026-03-15status Pending
-
2026-03-03$159,900 Active
-
2026-01-06price $168,900
-
2025-12-09status Active
-
2025-11-25status Pending
-
2025-10-30$169,900 Active
-
2025-09-29price $169,900
-
2021-08-18soldstatus $119,000
ⓘ Source: listings_history table (triggers on properties + properties_extension) + one-shot
backfill from property_details.listing_events for pre-trigger history.
Tax reassessment forecast AL · Resets to sale price
- Current annual tax
- $746 · $62/mo
- Projected year-2 tax
- $746 · $62/mo
- Expected delta
- $0/yr ($0/mo · 0.0%)
ⓘ Screening estimate from a state-policy table — verify with the county assessor before closing.
Climate risk First Street
- Flood 1/10 Low FEMA zone X (unshaded) · 0% chance over 30 yrs
- Wildfire 1/10 Low
- Heat 9/10 Extreme 7 d/yr ≥105°F today · 21 d/yr by 30 yrs out
- Wind 9/10 Extreme 99% chance of damaging wind over 30 yrs
- Air quality 2/10 Low 1 unhealthy d/yr today · 1 by 30 yrs out
Nearby sold comps map
Loading sold comps map…
Walkable amenities ~0.75 mi
Loading nearby amenities…
Taxation est. · year 1
- Rental income
- $18,163
- − Mortgage interest
- −$7,842
- − Property taxes
- −$746
- − Insurance
- −$700
- − Repairs & maintenance
- −$1,453
- − Management
- −$1,453
- − Depreciation
- −$4,073
- Taxable income
- $1,896
- Est. tax owed @ 24.0%
- −$455
- After-tax cash flow
- $3,638/yr
For passive investors: Depreciation is non-cash, so a rental often shows a tax loss while cash-flowing — sheltering income. Rental losses are passive: they offset passive income freely, and up to $25,000/yr can offset ordinary (W-2) income if you actively participate and your MAGI is under $100k (phasing out to $0 by $150k); unused losses carry forward. On sale, claimed depreciation is recaptured at up to 25%, and gains may owe capital-gains tax (a 1031 exchange can defer both). Figures are a year-1 estimate at your 24.0% rate — not tax advice; consult a CPA.
Schools (NCES district)
- District
- Mobile County
- NCES district ID
- 0102370
- Math proficiency
- 15% ▼ -28.00%
- Reading proficiency
- 39% ▬ 0.00%
- Median HH income
- $42,455
- Composite
- 22.9/100
- National rank
- #8002
- State rank
- #81 of 129 in AL
Livability — Mobile
- Score
- 75/100
- State rank
- #20
- US rank
- #4262
Category grades
Schools grade is shown separately in the Schools card above.
Census & demographics
- Census place
- Mobile, AL
- County
- Mobile County · 246,577 people
- City population
- 205,729
- Metro
- Mobile, AL
- Population (ZIP)
- 18,728
- Household income
- $51,303
- Rent vs Own
- Severe rent burden
- 999.0
Population outlook (Mobile County) Hauer SSP2
- Today (2025)
- 415,303 people
- By 2030
- 411,755 · -0.9%
- By 2040
- 399,670 · -3.8%
- By 2050
- 382,616 · -7.9%
- By 2075
- 337,353 · -18.8%
- By 2100
- 283,391 · -31.8%
Race, ethnicity, and origin ACS 2023
- Neighborhood character
- Majority Black (56%)
- Race & ethnicity
- Black 56% White 37% Two or more races 5% Hispanic / Latino 4%
- Common ancestry
- Italian 2% Scottish 2% Lithuanian 1%
- Foreign-born
- 3% · Canada
- Languages at home
- 96% English-only · Spanish 3%
Political lean MEDSL · Mobile
- 2024 margin
- R (+16.4) · D 41.3% · R 57.7%
- 2008→2024 swing
- -7.7pp toward R · 2008: -8.7pp · 2024: -16.4pp
- All cycles
- 2024: R+16.4 2020: R+11.9 2016: R+13.9 2012: R+9.3 2008: R+8.7
Not yet ingested
- Civics
- —
Market trends
- HPI YoY
- ▼ -232.19%
- Current HPI
- 145.9025
- Rent YoY
- ▲ 5.06%
- Metro
- Mobile, AL
- State GDP YoY
- ▲ 2.94%
- F500 in state
- 4
Industry mix (Fortune 500 HQ in AL)
| Industry | F500 HQs | Revenue |
|---|---|---|
| Financial Services | 1 | $8B |
|
||
| Healthcare | 1 | $5B |
|
||
Price history
+17.6% since first listed13 events — show timeline
- 2026-04-21 Pending — GCMLS AL
- 2026-04-02 Price Changed $140,000 GCMLS AL
- 2026-04-02 Relisted — GCMLS AL
- 2026-03-28 Pending — GCMLS AL
- 2026-03-21 Relisted — GCMLS AL
- 2026-03-15 Pending — GCMLS AL
- 2026-03-03 Listed $159,900 GCMLS AL
- 2026-01-06 Price Changed $168,900 GCMLS AL
- 2025-12-09 Relisted — BCAR
- 2025-11-25 Pending — BCAR
- 2025-10-30 Listed $169,900 BCAR
- 2025-09-29 Price Changed $169,900 GCMLS AL
- 2021-08-18 Sold (Public Records) $119,000 Public Records
Property tax history
+4.7%/yrLatest (2025): $746 · +7.5% YoY. Source: county tax records.
Cash-flow waterfall
monthlySold comps — $/sqft
last 12 mo · ≤1 miLoading sold comps…