4951 Haggerty Rd #18 · Canton, MI
Flood risk No data
- FEMA flood zone
- —
- Chance of flooding over 30 yrs
- —
- Est. flood insurance / yr
- —
Fire risk No data
- Est. fire insurance / yr
- —
Heat risk No data
- Hot days now (above threshold)
- —
- Hot days in 30 yrs
- —
Wind risk No data
- Chance of severe wind over 30 yrs
- —
Air-quality risk No data
- Unhealthy air days now
- —
- Unhealthy air days in 30 yrs
- —
Risk factors via First Street. Map © Google.
Why this score? — see what drove the C+ grade
The composite is a weighted blend of 9 inputs, each scored 0–100. Each bar is that input's sub-score; the figure is the points it added to the 100-point composite (weight × sub-score).
- Cash flow +30.0/30.0
- 1% rule +10.0/10.0
- DSCR +10.0/10.0
- Condition / age +4.0/5.0
- Rent growth +2.6/5.0
- Livability +2.5/5.0
- Schools +1.6/10.0
- ARV discount +0.0/15.0
- Appreciation +0.0/10.0
$71,400
🖨 Deal sheet 📄 Offer letter ✓ Due diligence
Listing remarks
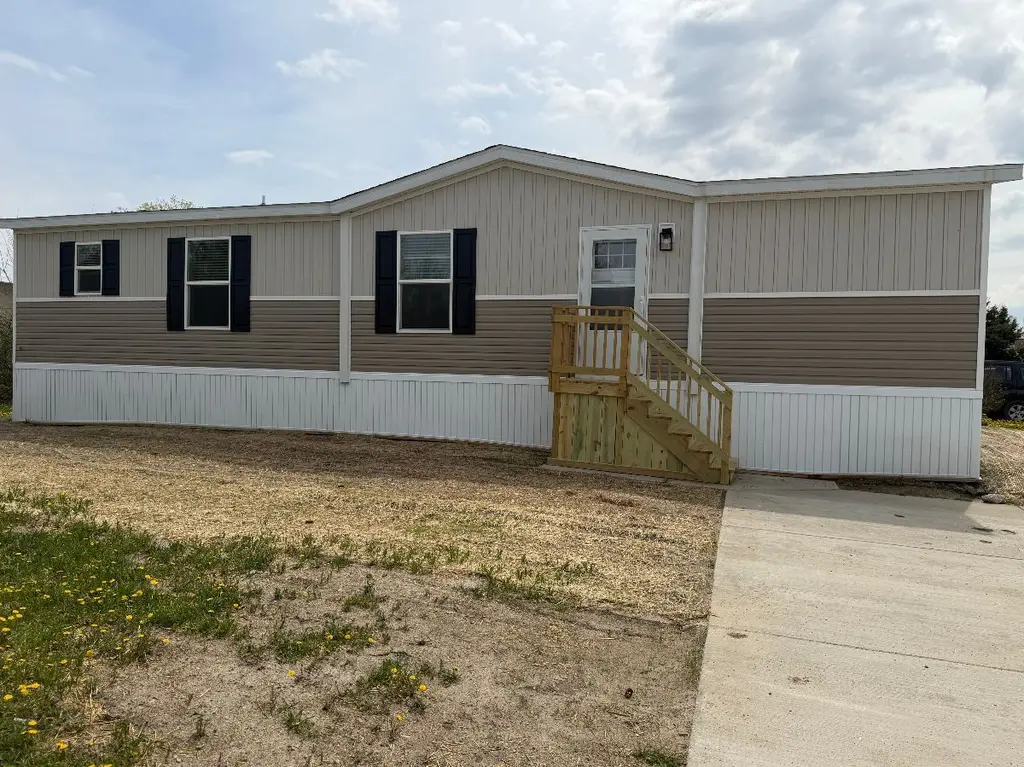
Your brand new 3 bedroom, 2 bathroom home is waiting for you to move in! This comfortable home features premium entry doors, a modern bathroom, as well as new brand name appliances. In the community, enjoy with your friends and family all the amenities we have to offer such as community events, scenic views, and a playground. This home won't be on the market long, so call us today for more information or to schedule a tour. Deposits & Fees are subject to change.
Key facts
- Scenic views
- Modern bathroom
- Premium entry doors
Tags
Property features AI
Finance
- Other: Address: 4951 Haggerty Rd #18, Canton Township, MI 48188; Listing status: Active
- Financial info: List price $71,400
Exterior
- Utilities: Natural gas; Central air
- Home design: Spec new construction (Plan 94260)
- Exterior features: Living area 1,456 (living space size provided)
Interior
- Bedrooms: 3 bedrooms
- Bathrooms: 2 full bathrooms
- Heating & cooling: Natural gas heating; Central air conditioning
- Interior features: 2 bathrooms total
Neighborhood map
What this means for you Summary
Snapshot
- This is a 3-bed/2.0-bath manufactured listed at $71k. Condition is rated good.
Deal economics
- At list price, monthly cash flow is $1k ($12k/yr) — positive.
- The deal already cash-flows at list — no discount required.
- Meets the 1% rule at list price ($2k rent vs $71k).
- Recommended offer: $69k (3.0% below list) — sets the bar for market timing.
Location & tenants
- Location reads: area grade C — affects rentability + tenant quality, not the cash-flow math above.
- Wayne-Westland Community School District (suburban): math 11% / reading 27% proficiency, ranked #474 of 540 in MI (top 88%) — low school quality limits family demand, transient renter base, plan for 1-2y turnover.
- Market conditions: Rents flat; 245 active listings in the ZIP; 2 comparable units currently listed for rent nearby; high-income renter base; 2,639 units permitted in Wayne County in 2024 (1,216 in 5+ unit buildings).
Forward outlook
- Local home prices are declining (-3.0%/yr); year-one equity from $494 of loan paydown is wiped out by about $2k of value loss. Plan a longer hold.
- Wayne County population projected at -17% by 2050 — secular population decline; favor cash flow + early exit over multi-decade hold.
- At projected returns (-3.0% appreciation + 0.5% rent growth), your $20k cash investment doubles in ~2 years — after that, you're playing with house money.
Negotiation context
- It's been on market 37 days — a 3% lower offer ($69k) is reasonable based on typical stale-listing flexibility.
Questions for the listing agent
- It's been on market 37 days. Have you received any prior offers? Is the seller open to a 3% concession, seller financing, or rate buy-down credit?
- Is there a deadline driving the sale (1031 exchange, divorce, estate, relocation)? That informs how much negotiation room exists.
- What's the average days-on-market for RENTAL listings here right now (not sales)? A rising rental-DOM trend means longer vacancies and softer asking-rent achievability than the comps imply.
- What's the recent tenant-quality profile in this submarket — average credit score on applications, eviction rate, late-payment / NSF rate, and stable-employment percentage? A property-management company in the area should have these aggregated.
- How much new for-sale + rental construction is in the pipeline within 1–3 miles? Heavy new supply typically softens prices + rents 12–24 months out; constrained supply supports both.
Investment metrics
- 1% rule
- 2.67% ✓
- Cap rate
- 23.28%
- Cash-on-cash
- 60.69%
- DSCR
- 3.70
- GRM
- 3.1
CMA / ARV
- ARV (median comp)
- $49,359
- List price
- $71,400
- Delta
- 44.66%
- Verdict
- OVERPRICED
- Comps
- 1 within 2.0 mi
Show comp detail 1 sale within ~0.75 mi
| Address | Dist | Beds/Ba | Sqft | Sold | Price | $/sf | Match |
|---|---|---|---|---|---|---|---|
| 41021 Lot 46 Old Michigan Ave | 0.35mi | 3/2.0 | 1,343 (-8%) | 6mo | $55,000 | $41 | 66 |
Match score weights: distance 35% · size 25% · config 20% · recency 20%. Top-matched comps best support the ARV.
Projected returns pro-forma
-3.0% appreciation · 0.46% rent growth · sell at horizon
- IRR
- 56.6%
- Equity multiple
- 3.41×
- Total profit
- $48,104
- Equity at exit
- $10,646
- IRR
- 60.6%
- Equity multiple
- 6.32×
- Total profit
- $106,409
- Equity at exit
- $6,173
Cash invested: $19,992 (down + closing). Projections, not guarantees.
Landlord ↔ Tenant lean methodology
- Overall (STATE)
- 62 Landlord-Friendly
- State Michigan
- 62 Landlord-Friendly · EVEN
- County
- — inherits STATE
- City
- — inherits STATE
ZIP-level market 48188
- Rents YoY
- 0.5%
- Active inventory
- 245
- Price-to-rent
- 3.1×
Monthly cashflow live
- Estimated rent
- $1,904 medium interval (Pro) →
- Mortgage (P&I)
- −$374
- Tax est. 1.5%
- −$89 /mo · $1,071/yr
- Insurance
- −$30
- HOA
- −$0
- Vacancy / Maint / Mgmt
- −$400
- Net cashflow
- $1,011
Break-even live
UW: 25.0% down · 7.5% · 30yr · 1.5% tax · 5.0% vac · 8.0% maint · 8.0% mgmt
Financing live
Cash to close
- Down payment
- $17,850
- Closing costs
- $2,142
- Reserves months
- —
- Total cash needed
- —
Loan-product check · same deal, 3 products live
Conventional
25% down · 7.5% · 30yr
- Down + closing
- —
- Monthly P&I
- —
- Monthly cashflow
- —
- DSCR
- —
- Eligible?
- —
Personal DTI + credit; lowest rate.
DSCR
20% down · 8.5% · 30yr
- Down + closing
- —
- Monthly P&I
- —
- Monthly cashflow
- —
- DSCR
- —
- Eligible?
- —
No personal income docs; deal must DSCR.
Hard money
10% down · 12.0% · 12mo
- Down + closing
- —
- Monthly P&I
- —
- Monthly cashflow
- —
- DSCR
- —
- Eligible?
- —
Short-term bridge; refi at stabilization.
Rent comps 2 comps
| Address | Beds | Baths | Sqft | Rent | $/sqft | DOM | Units | Dist |
|---|---|---|---|---|---|---|---|---|
| 41021 Old Michigan Ave Canton, MI | 2.0 | 2.0 | 900 | $1,229 | $1.37 | 43d | 1 | 0.50mi |
| 2268 Arcadia Dr Canton, MI | 2.0 | 2.0 | 1168 | $1,900 | $1.63 | 17d | 1 | 1.45mi |
Listing history 15 events
-
2026-06-18days on market $71,400 Active 37 DOM
-
2026-06-17days on market $71,400 Active 36 DOM
-
2026-06-16days on market $71,400 Active 35 DOM
-
2026-06-15days on market $71,400 Active 34 DOM
-
2026-06-13days on market $71,400 Active 32 DOM
-
2026-06-13days on market $71,400 Active 31 DOM
-
2026-06-09days on market $71,400 Active 28 DOM
-
2026-06-08days on market $71,400 Active 27 DOM
-
2026-06-07days on market $71,400 Active 26 DOM
-
2026-06-04days on market $71,400 Active 23 DOM
-
2026-06-03days on market $71,400 Active 22 DOM
-
2026-06-02days on market $71,400 Active 21 DOM
-
2026-06-01days on market $71,400 Active 20 DOM
-
2026-05-31days on market $71,400 Active 19 DOM
-
2026-05-12$71,400 Active 472-char remark
ⓘ Source: listings_history table (triggers on properties + properties_extension) + one-shot
backfill from property_details.listing_events for pre-trigger history.
Nearby sold comps map
Loading sold comps map…
Walkable amenities ~0.75 mi
Loading nearby amenities…
Taxation est. · year 1
- Rental income
- $22,852
- − Mortgage interest
- −$4,000
- − Property taxes
- −$1,071
- − Insurance
- −$357
- − Repairs & maintenance
- −$1,828
- − Management
- −$1,828
- − Depreciation
- −$2,077
- Taxable income
- $11,691
- Est. tax owed @ 24.0%
- −$2,806
- After-tax cash flow
- $9,326/yr
For passive investors: Depreciation is non-cash, so a rental often shows a tax loss while cash-flowing — sheltering income. Rental losses are passive: they offset passive income freely, and up to $25,000/yr can offset ordinary (W-2) income if you actively participate and your MAGI is under $100k (phasing out to $0 by $150k); unused losses carry forward. On sale, claimed depreciation is recaptured at up to 25%, and gains may owe capital-gains tax (a 1031 exchange can defer both). Figures are a year-1 estimate at your 24.0% rate — not tax advice; consult a CPA.
Condition & rehab AI · 11 photos
This brand new 3-bedroom, 2-bathroom home is move-in ready with modern finishes and a welcoming exterior. Potential buyers and renters will appreciate the fresh paint, smart home devices, and outdoor lighting opportunities.
Value-add opportunities
- Both Paint interior walls — Fresh paint can enhance the home's curb appeal and interior aesthetics.
- Both Install smart home devices — Smart home devices can increase the home's value and appeal to tech-savvy buyers/renters.
- Both Add outdoor lighting — Outdoor lighting can improve safety and curb appeal, making the home more attractive to potential buyers/renters.
- Both Install a smart thermostat — A smart thermostat can improve energy efficiency and comfort, making the home more attractive to potential buyers/renters.
Renovation cost estimate screening
Value-add ROI direction
- Both Paint interior walls — Fresh paint can enhance the home's curb appeal and interior aesthetics. ↑
- Both Install smart home devices — Smart home devices can increase the home's value and appeal to tech-savvy buyers/renters. ↑
- Both Add outdoor lighting — Outdoor lighting can improve safety and curb appeal, making the home more attractive to potential buyers/renters. ↑
- Both Install a smart thermostat — A smart thermostat can improve energy efficiency and comfort, making the home more attractive to potential buyers/renters. ↑
ⓘ Cost ranges are severity-bucket heuristics (US national rule-of-thumb). Get contractor quotes + a written scope before underwriting a rehab budget.
Schools (NCES district)
- District
- Wayne-Westland Community School District
- NCES district ID
- 2600015
- Math proficiency
- 11% ▼ -6.00%
- Reading proficiency
- 27% ▼ -2.00%
- Median HH income
- $43,524
- Composite
- 16.4/100
- National rank
- #9195
- State rank
- #474 of 540 in MI
Livability — Canton
No livability data for this city. (Only ~50 U.S. cities are tracked.)
Census & demographics
- County
- Wayne County · 1,562,939 people
- City population
- 99,041
- Metro
- Detroit-Warren-Dearborn, MI
- Population (ZIP)
- 45,665
- Household income
- $122,781
- Rent vs Own
- Severe rent burden
- 486.0
Population outlook (Wayne County) Hauer SSP2
- Today (2025)
- 1,675,273 people
- By 2030
- 1,620,300 · -3.3%
- By 2040
- 1,502,341 · -10.3%
- By 2050
- 1,384,039 · -17.4%
- By 2075
- 1,124,592 · -32.9%
- By 2100
- 881,193 · -47.4%
Race, ethnicity, and origin ACS 2023
- Neighborhood character
- Diverse neighborhood (Simpson 0.59)
- Race & ethnicity
- White 58% Asian 23% Black 11% Two or more races 6% Hispanic / Latino 3%
- Common ancestry
- Romanian 8% Lithuanian 3% Slovak 2%
- Foreign-born
- 23% · Canada, China, Vietnam
- Languages at home
- 74% English-only · Other Indo-European 12% Other Asian/Pacific 4% Arabic 3%
Political lean MEDSL · Wayne
- 2024 margin
- Strong D (+29.0) · D 62.7% · R 33.7% · Other 3.6%
- 2008→2024 swing
- -20.5pp toward R · 2008: 49.5pp · 2024: 29.0pp
- All cycles
- 2024: D+29.0 2020: D+38.1 2016: D+37.3 2012: D+46.9 2008: D+49.5
Not yet ingested
- Civics
- —
Market trends
- HPI YoY
- ▼ -299.09%
- Current HPI
- 193.4673
- Rent YoY
- ▲ 0.46%
- Metro
- Detroit-Warren-Dearborn, MI
- State GDP YoY
- ▲ 1.37%
- F500 in state
- 28
Industry mix (Fortune 500 HQ in MI)
| Industry | F500 HQs | Revenue |
|---|---|---|
| Automotive Parts | 3 | $48B |
|
||
| Automotive | 2 | $372B |
|
||
| Chemicals | 1 | $45B |
|
||
| Automotive Retail | 1 | $29B |
|
||
| Healthcare / Medical Devices | 1 | $23B |
|
||
| Automotive Technology | 1 | $20B |
|
||
Cash-flow waterfall
monthlySold comps — $/sqft
last 12 mo · ≤1 miLoading sold comps…